OpenTelemetry trace correlation
azure-functions-logging can bind the Azure Functions host's W3C trace context
into your handler so that OpenTelemetry log records inherit the host invocation
span's trace_id and span_id. This makes your structured logs correlate with
the distributed trace in Application Insights — without this package creating,
recording, or exporting any spans.
What this feature does
- Reads the host-provided
traceparent/tracestatefrom the invocationcontextand attaches the extracted W3C context for the duration of the handler (vialogging_context/with_context). - While that context is active, any OpenTelemetry
LoggingHandlerstamps emitted records with the host span'strace_id/span_id. - Emits
trace_idandspan_idinJsonFormatteroutput regardless of OpenTelemetry availability (they arenullwhen no context is present).
What this feature does not do
- It does not start, record, or export spans — it only activates the context the host already produced.
- It does not replace
azure-monitor-opentelemetry/configure_azure_monitor(). You still configure the exporter yourself; this package only ensures the host span context is active while your handler runs. - It is not a general distributed-tracing library.
Installation
The base install stays zero-dependency. Trace-context activation requires the
optional [otel] extra:
When OpenTelemetry is not installed, activation degrades to a silent no-op —
your logs still emit trace_id: null / span_id: null and nothing raises.
Enabling activation
Activation is opt-in. The value is resolved in this order (highest priority first):
- The per-call
activate_trace_context=argument onlogging_context()/@with_context(...), when notNone. - The process-wide default set by
setup_logging(activate_trace_context=True). False(the built-in default — no activation).
from azure_functions_logging import setup_logging, logging_context

# Option A: process-wide default
setup_logging(activate_trace_context=True)

def handler(req, context):
    with logging_context(context):  # inherits the default → activates
        ...

# Option B: per-call override (wins over the default either way)
def handler(req, context):
    with logging_context(context, activate_trace_context=True):
        ...
You can also use the low-level activated_trace_context() context manager
directly if you manage trace headers yourself.
Required call order
The OpenTelemetry LoggingHandler is attached to the root logger by
configure_azure_monitor(). setup_logging() only decorates handlers that
already exist when it runs. Call configure_azure_monitor() before
setup_logging() so that context filters — and any RedactionFilter /
SamplingFilter you attach — actually land on the OTel handler:
from azure.monitor.opentelemetry import configure_azure_monitor
from azure_functions_logging import setup_logging

configure_azure_monitor()                    # 1. attaches the OTel handler
setup_logging(activate_trace_context=True)   # 2. decorates the now-present handler
configure_azure_monitor()installs the non-deprecatedopentelemetry.instrumentation.logging.LoggingHandler. This package detects any handler whose class lives under theopentelemetry.*namespace, so both that handler and the olderopentelemetry.sdk._logs.LoggingHandlerare recognised — you do not need to pin a specific handler class.
If you reverse the order, the OTel handler is added after setup_logging()
and never receives your filters — PII redaction is silently bypassed. See
Troubleshooting: PII appears in Application Insights attributes.
For handlers that must be attached after setup_logging(), pass
use_record_factory=True so context is injected at record-creation time instead
of via handler filters.
use_record_factory=Truecovers context injection only. It guarantees thattrace_id/span_id/ invocation fields reach records emitted through late-attached handlers, but it does not attachRedactionFilter,SamplingFilter, orAttributeFlattenFilterto those handlers. Security and noise filters must still be added explicitly to any OTel handler created aftersetup_logging()(e.g. by a laterconfigure_azure_monitor()) — otherwise PII redaction and sampling are silently bypassed on that handler.
Filters in OpenTelemetry mode
In OTel mode the entire extra mapping is exported as log attributes, which
makes RedactionFilter and SamplingFilter more important, not less — attach
them to the OTel handler. Nested dict values in extra are silently dropped by
the OTel SDK; use AttributeFlattenFilter to
flatten them into dotted scalar keys (order={"id": 1} → order.id=1).
import logging

from azure_functions_logging import (
    AttributeFlattenFilter,
    RedactionFilter,
    setup_logging,
)

setup_logging()
for handler in logging.getLogger().handlers:
    handler.addFilter(RedactionFilter())        # mask PII before export
    handler.addFilter(AttributeFlattenFilter())  # keep nested dicts from being dropped
Scope
AttributeFlattenFilterto the OTel handler. The filter mutates the sharedLogRecordin place, so if the same filter also runs on a standaloneJsonFormatterstream handler your plain JSON output is flattened too: a nestedextra={"order": {"id": 1}}is emitted as{"order.id": 1}instead of a nested object. That is what you want for OTel attribute export, but usually not for local/standalone JSON logs — attach it to the specific OTel handler rather than the root logger when both kinds of handler are present.Handler scoping reduces blast radius but does not isolate mutation. stdlib
loggingpasses the sameLogRecordobject to every handler in sequence, so if the OTel handler runs before a JSON/stdout handler on the same logger, that later handler still sees the flattened record. Scoping the filter to the OTel handler shrinks the window but cannot fully isolate in-place mutation when multiple handlers process one record. To keep plain JSON output nested, emit it on a separate logger (not sharing handlers with the OTel path).
Known limitation: thread boundaries
Trace-context activation uses contextvars, which do not automatically
propagate across thread boundaries. Logs emitted from
loop.run_in_executor(...) or a ThreadPoolExecutor worker lose the host span
correlation unless you propagate the context yourself (e.g. by capturing
contextvars.copy_context() and running the work inside it). Async code on the
same event loop is unaffected.
Behavior change: spans you create become children of the host span
While activation is on, the host invocation span is the current span for
the duration of your handler. Any span you start inside the handler — e.g.
tracer.start_as_current_span("work") — is therefore parented to the host span
instead of becoming a new top-level (root) span. This is usually what you want
(your work nests under the invocation in the Application Insights end-to-end
transaction), but it is a trace-structure change for code that previously
created top-level spans. If you need a detached root span, capture a fresh
root context yourself before starting it.
Runnable example
A minimal Function App wiring azure-monitor-opentelemetry together with this
package lives in examples/otel_app.
Verified in Azure Application Insights
The examples/otel_app
app was deployed to a real Azure Function App (Flex Consumption, Python 3.11) with a
workspace-based Application Insights resource, then driven with live traffic. The
screenshots below are the actual query results.
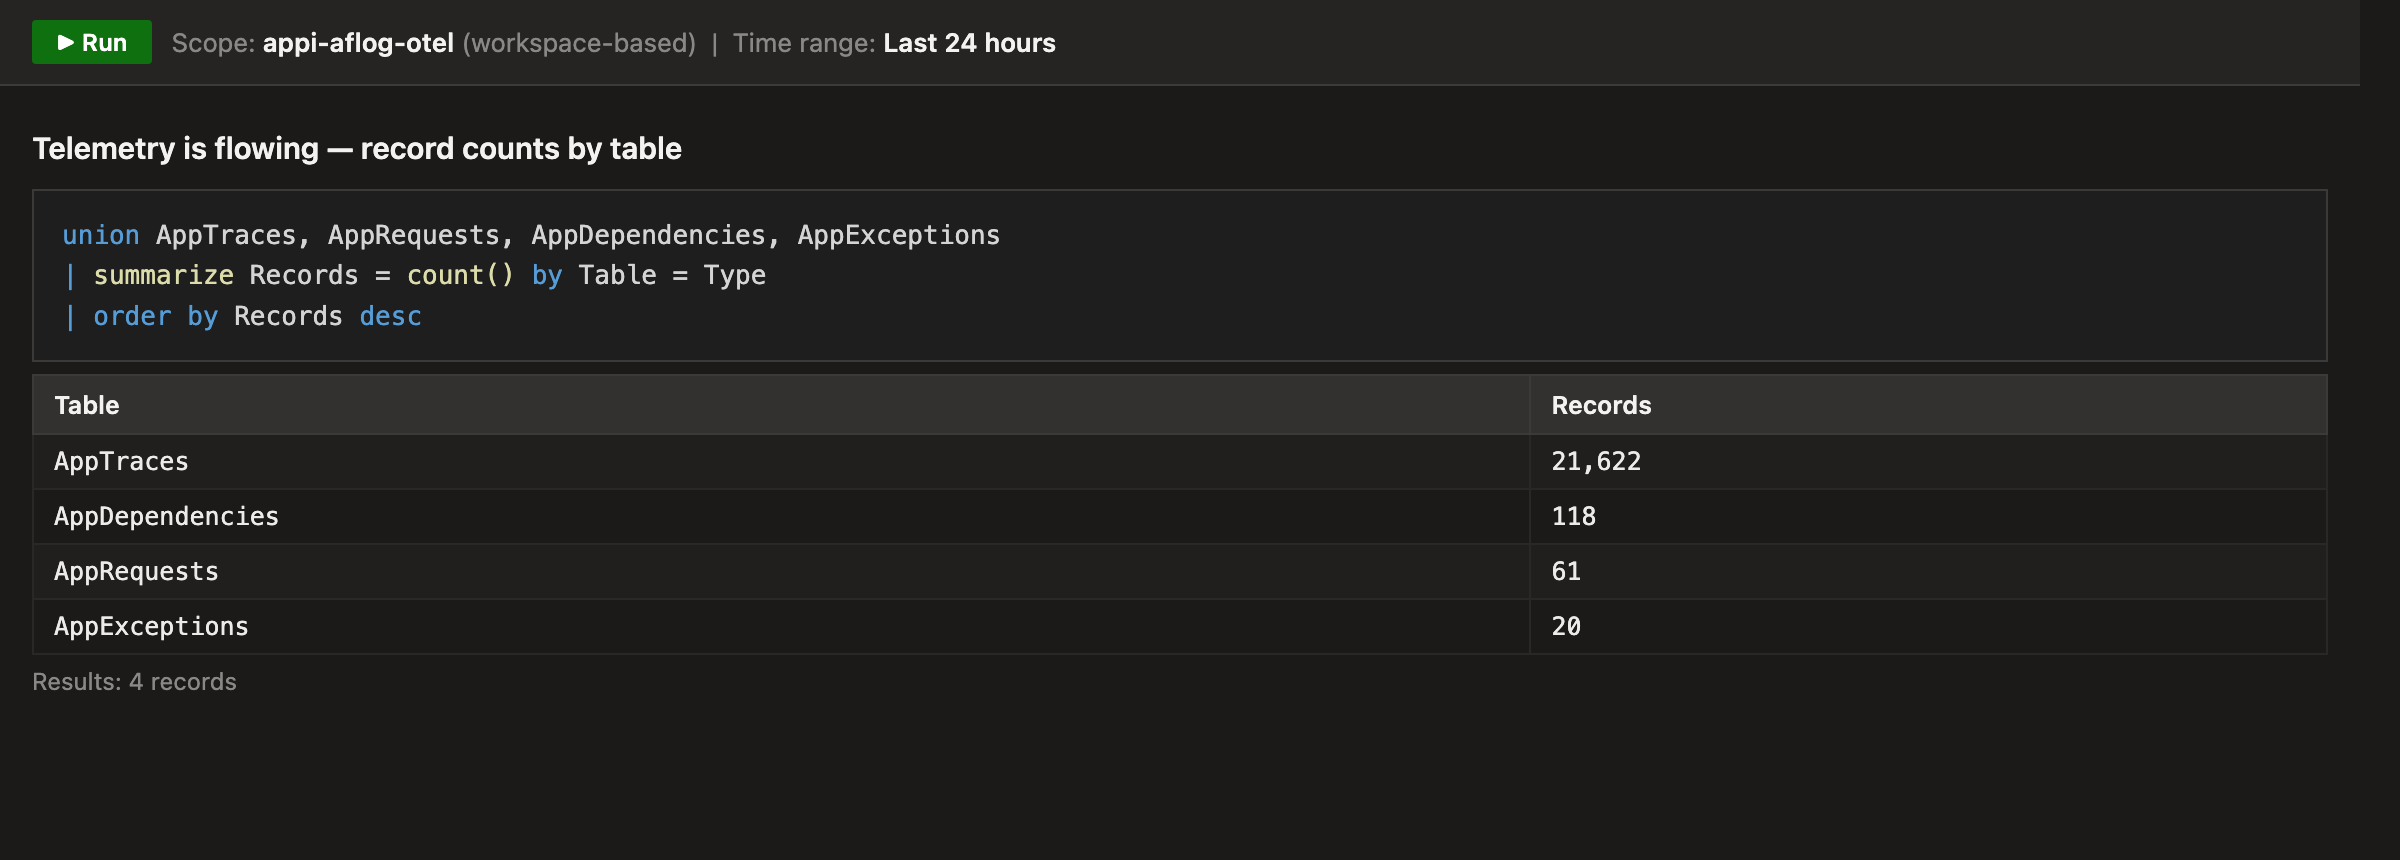
Querying a workspace-based Application Insights resource. When Application Insights is workspace-based, telemetry lands in the backing Log Analytics workspace under the
App*tables (AppTraces,AppRequests,AppDependencies,AppExceptions) — not the classictraces/requeststables. Query the workspace directly (Logs blade, oraz monitor log-analytics query -w <workspace-id> --analytics-query "...").
Telemetry is flowing. A single union over the App* tables confirms the
exporter is delivering traces, requests, dependencies, and exceptions:
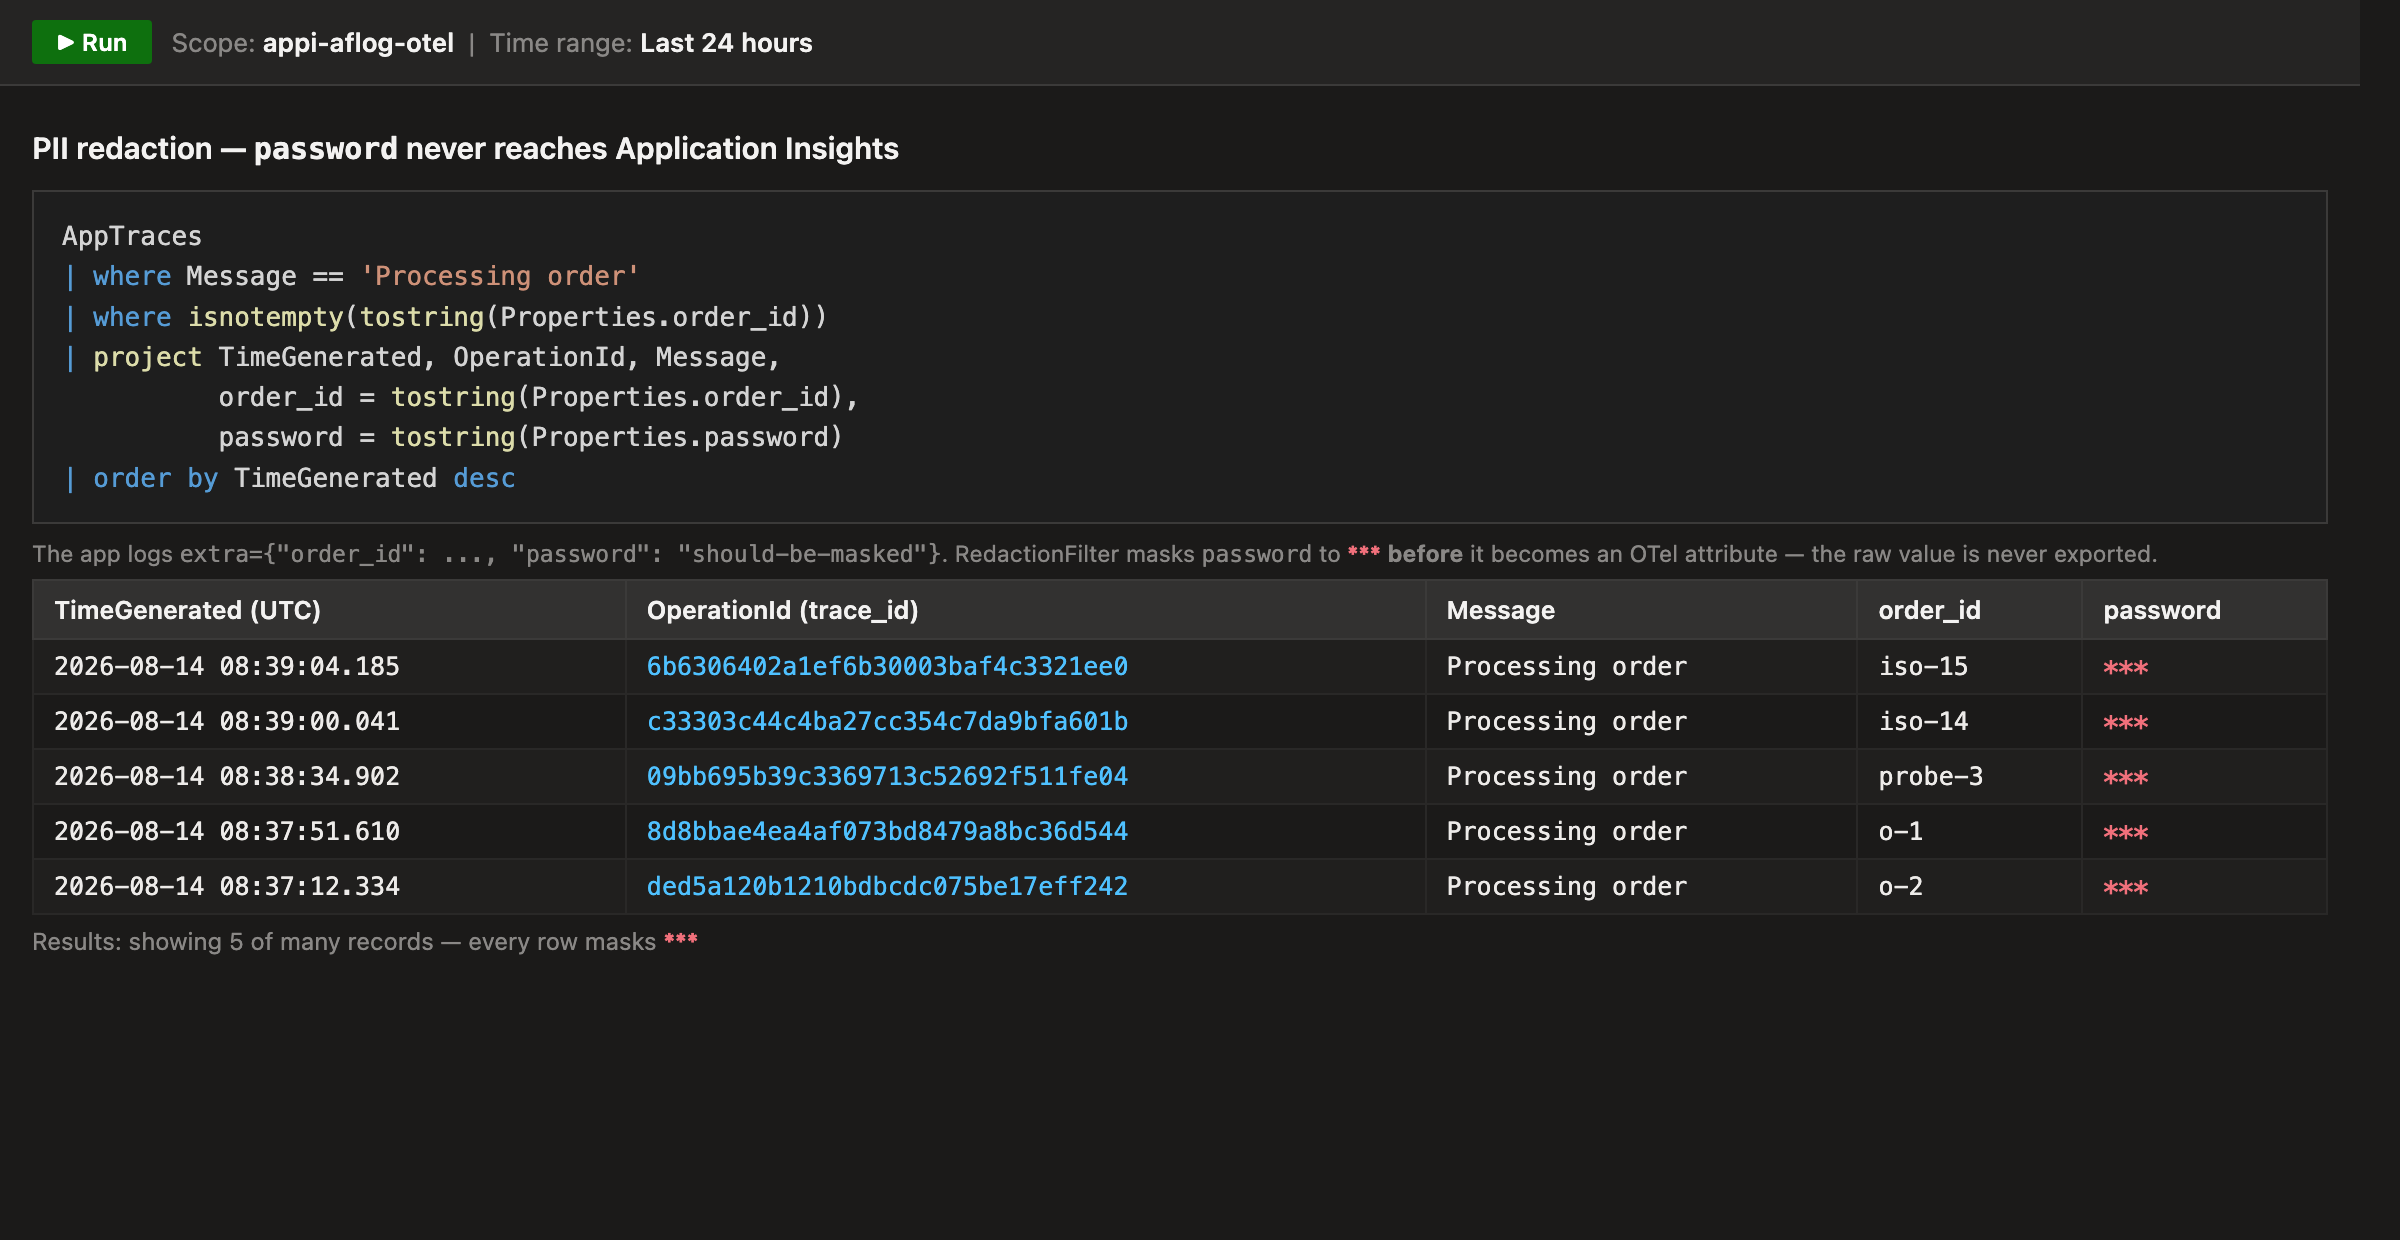
PII redaction works end to end. The app logs
extra={"order_id": ..., "password": "should-be-masked"}. RedactionFilter,
attached to the OTel LoggingHandler, masks password to *** before it
becomes an exported attribute — so the raw value never reaches Application
Insights. Every returned row shows the mask:
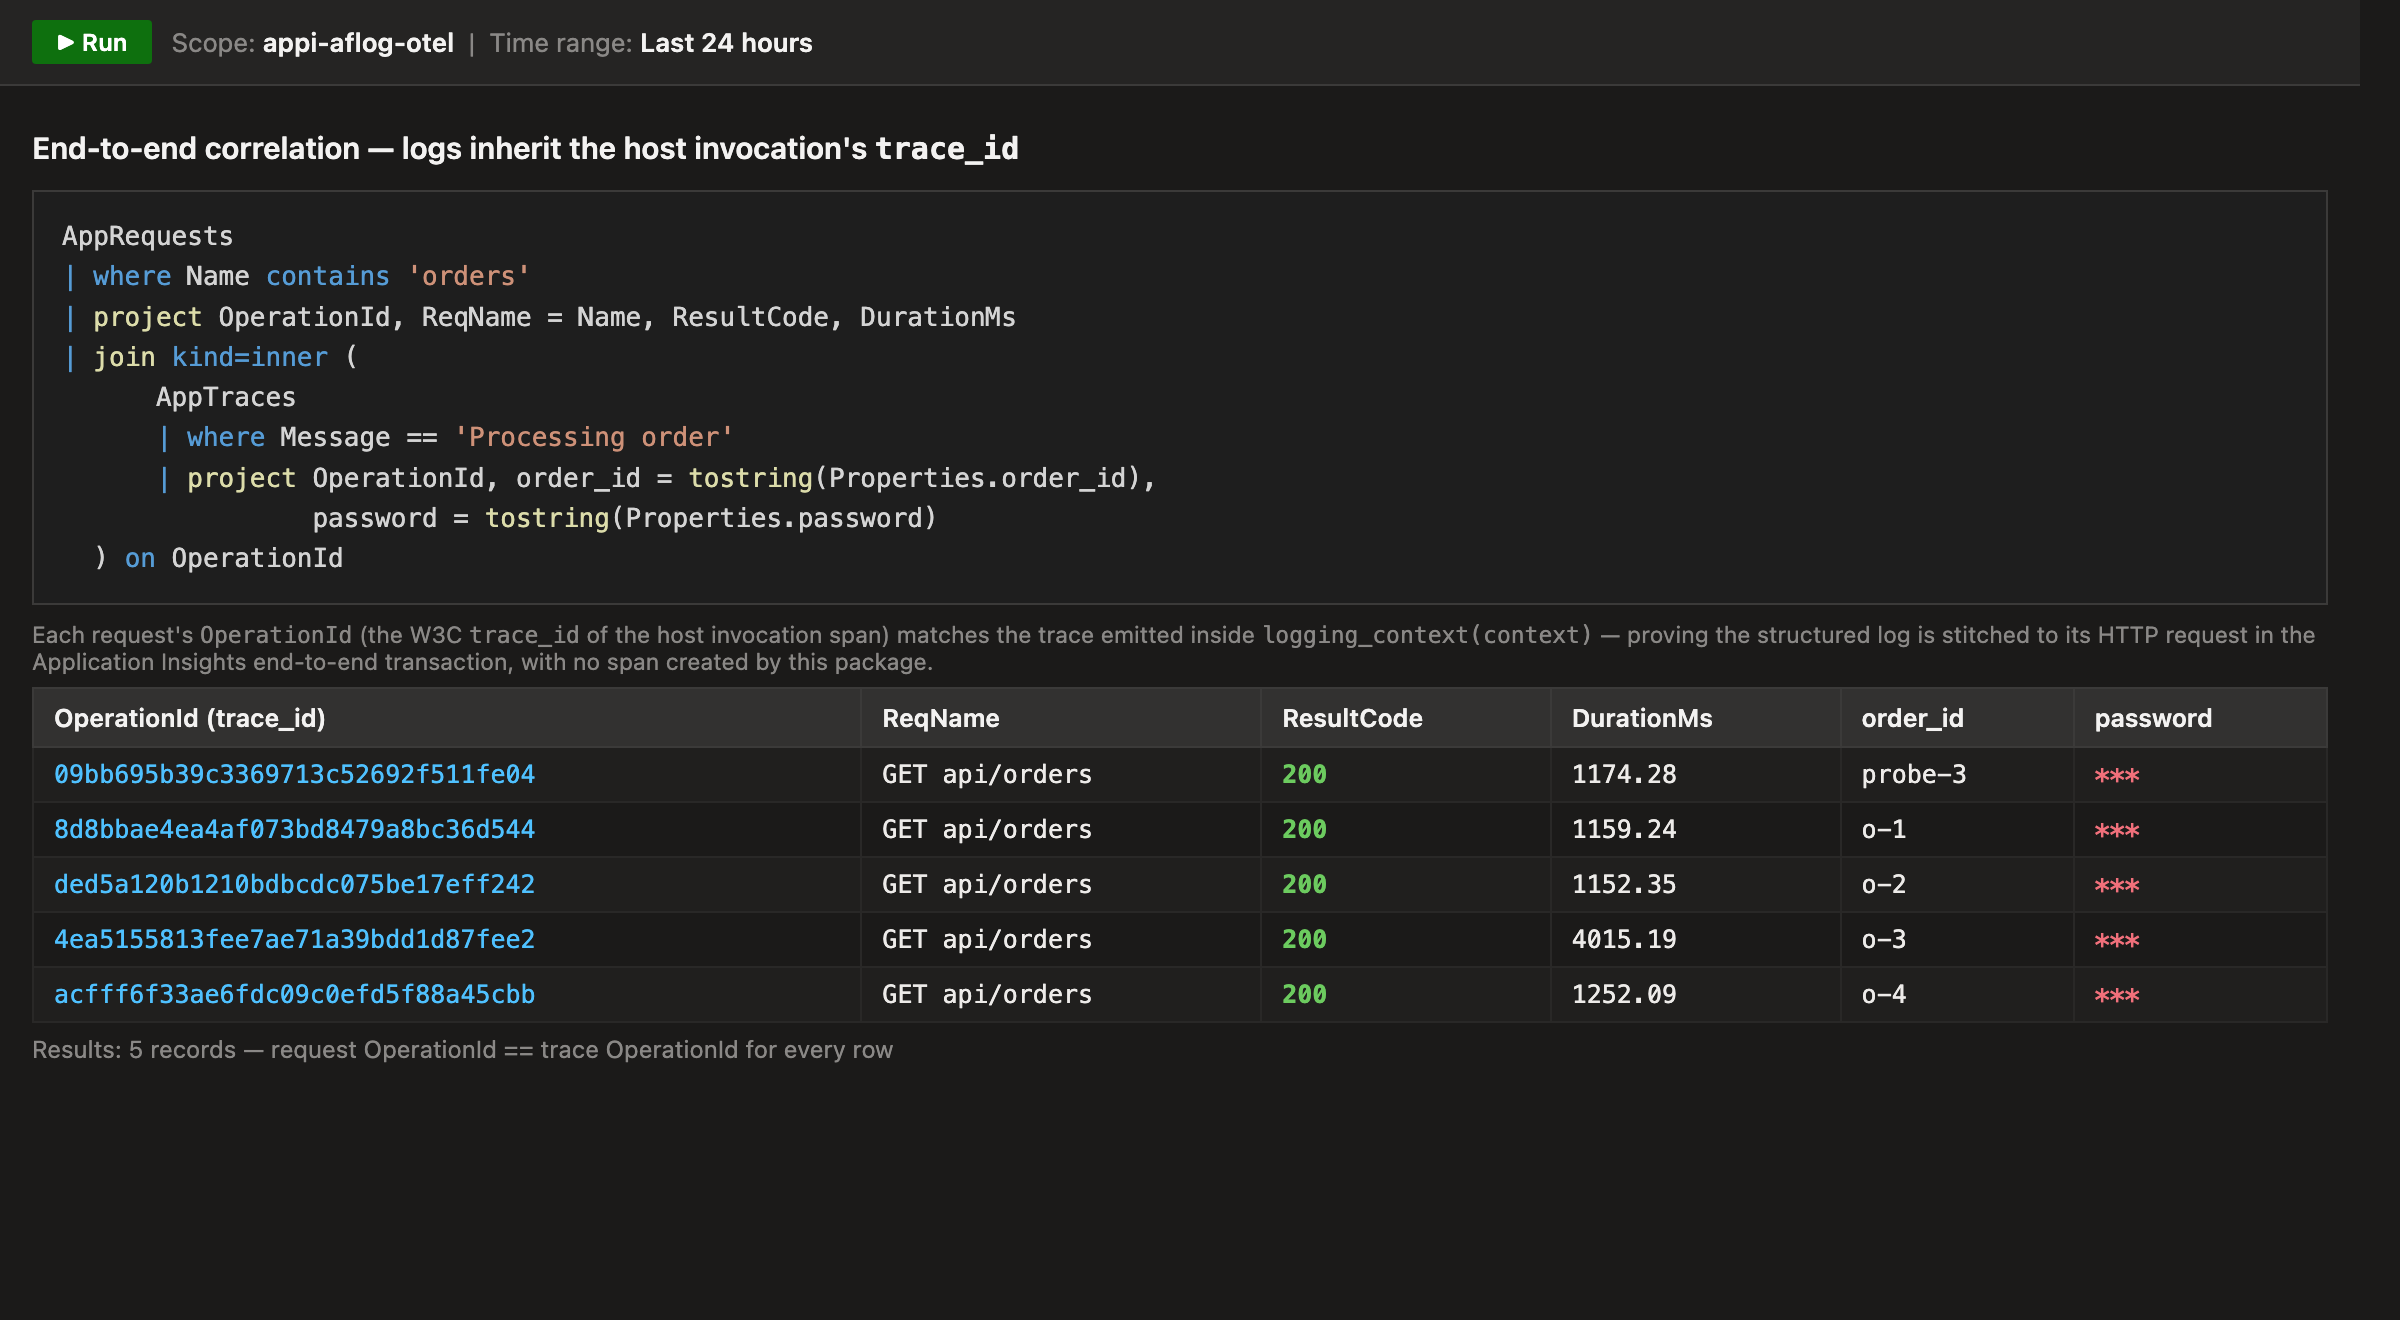
Logs correlate with their invocation. Joining AppRequests to AppTraces
on OperationId shows that each Processing order log carries the same
trace_id as the host invocation span for its HTTP request — the end-to-end
correlation activate_trace_context=True provides, without this package ever
creating a span:
The same correlation in the Application Insights portal
The KQL results above prove the correlation at the query layer. The portal views below show the same deployed app the way you would actually explore it — without writing a single query.
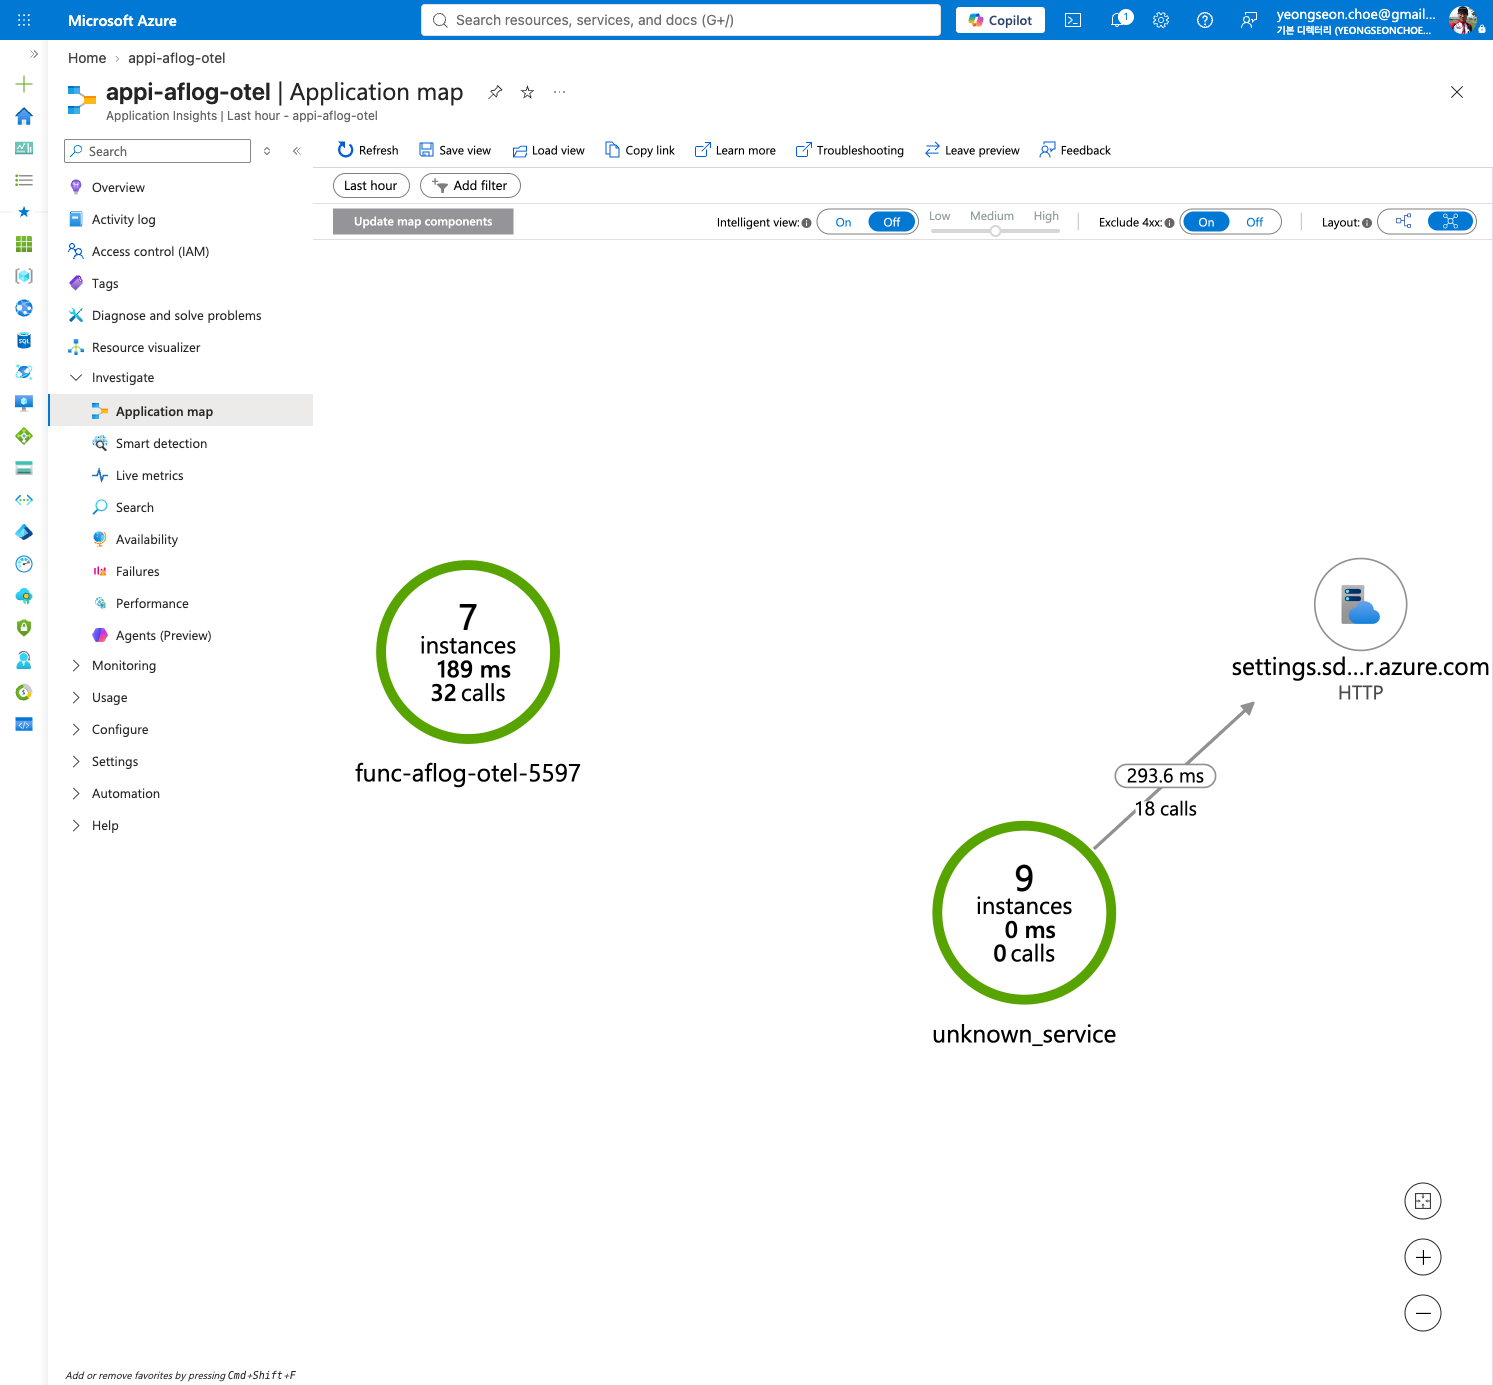
Application map. The Function App node (func-aflog-otel-5597) and its
downstream HTTP dependency are stitched together from the exported
request/dependency telemetry:
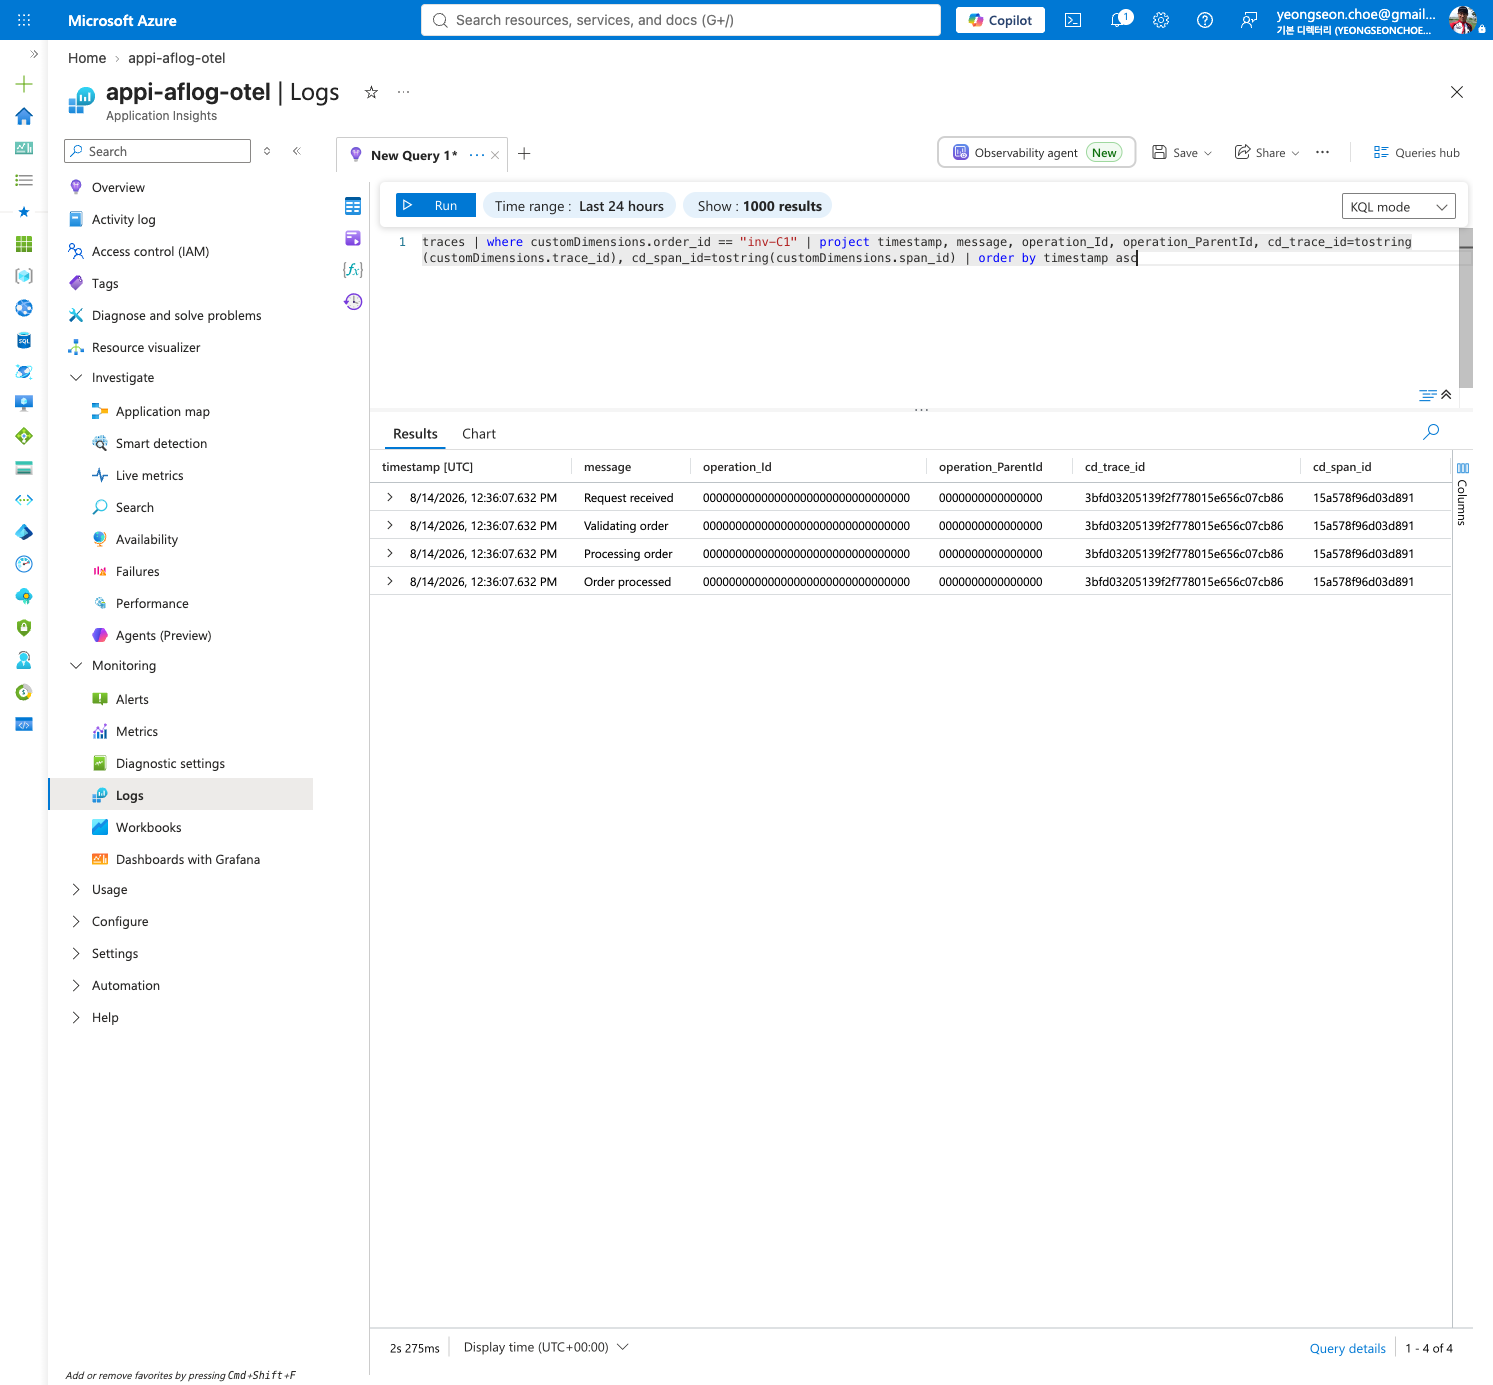
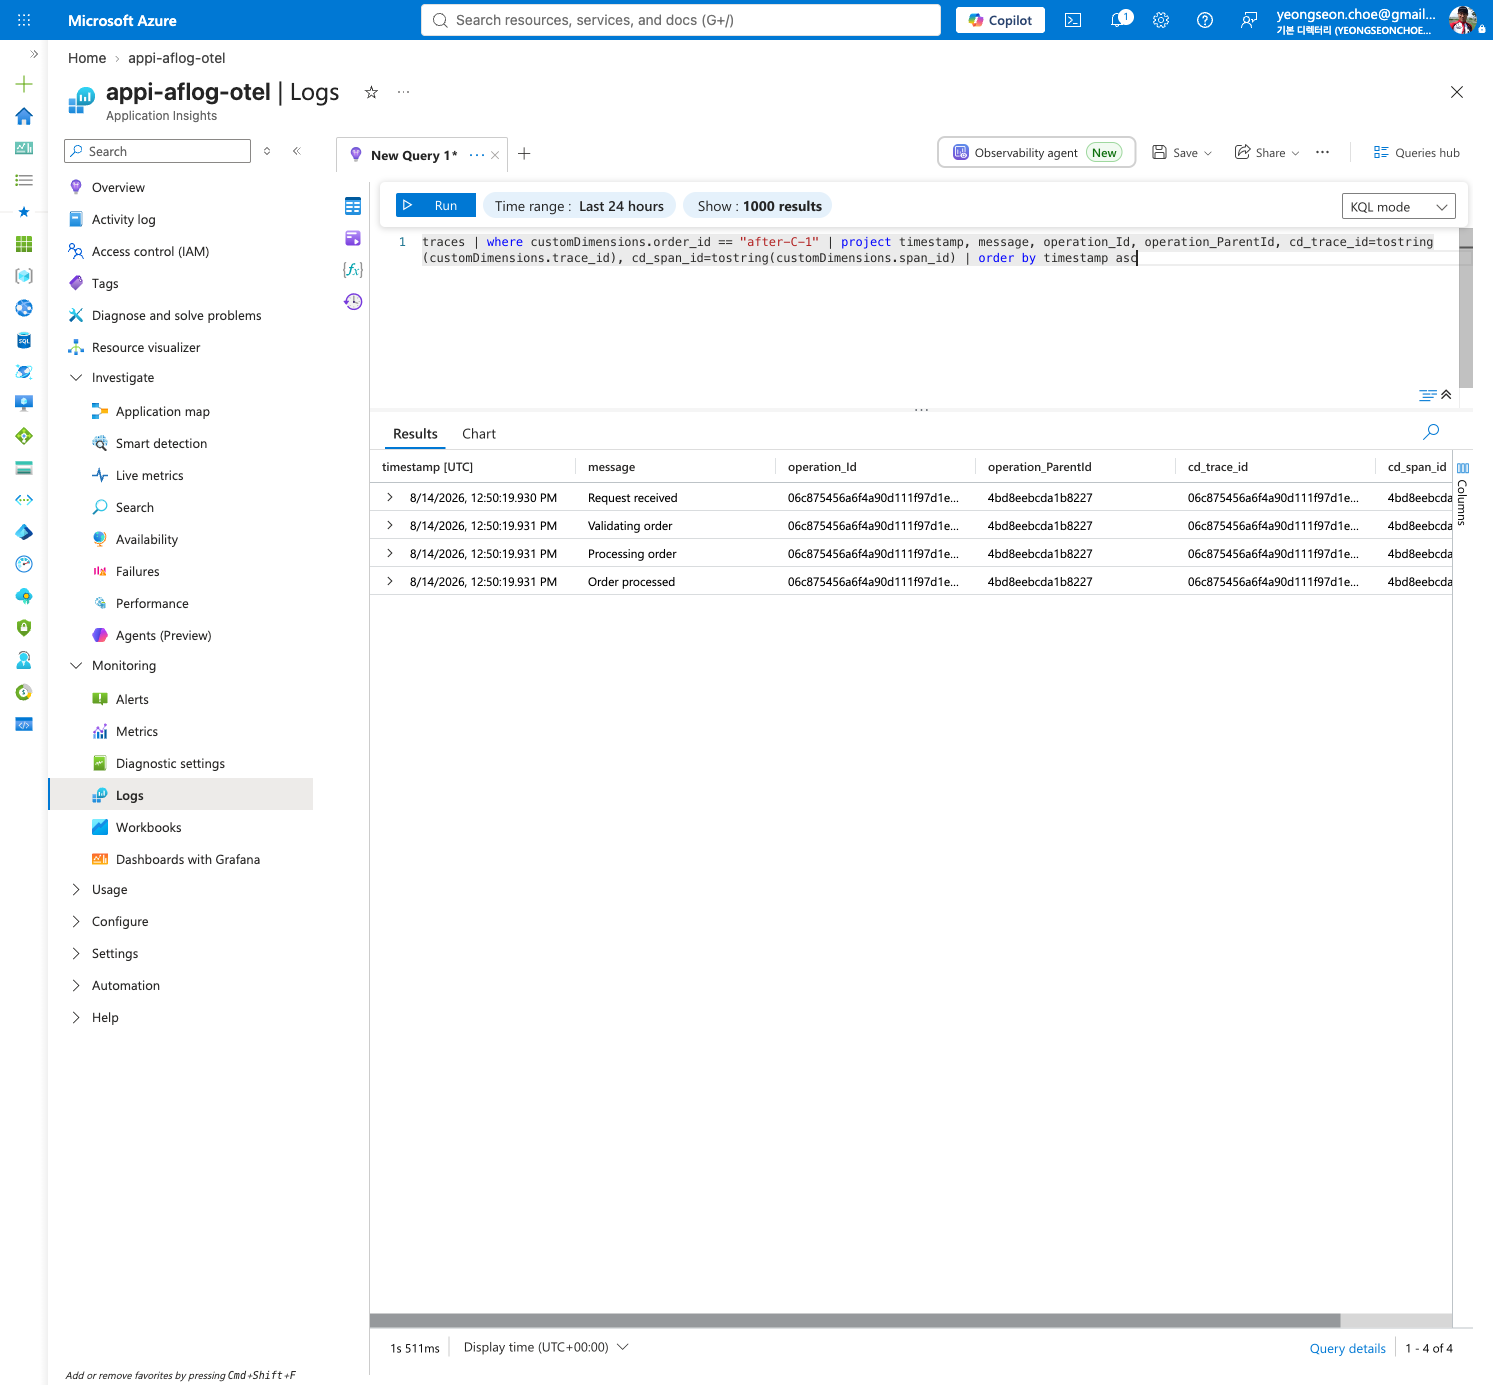
End-to-end correlation, before and after. The clearest proof is the same
process_order invocation queried the same way, with activate_trace_context
off versus on. The projection surfaces Application Insights' own correlation keys
(operation_Id, operation_ParentId) next to the trace_id / span_id this
package writes as custom dimensions.
Without activation, every worker log record lands with operation_Id and
operation_ParentId all zeros — orphaned from the host invocation at the
correlation layer, even though the custom-dimension trace_id / span_id are
present:
With activate_trace_context=True, the four records of the invocation share a
real operation_Id / operation_ParentId, and operation_Id now equals the
package's custom-dimension trace_id — the log records are bound to the host
invocation span, without this package ever creating one:
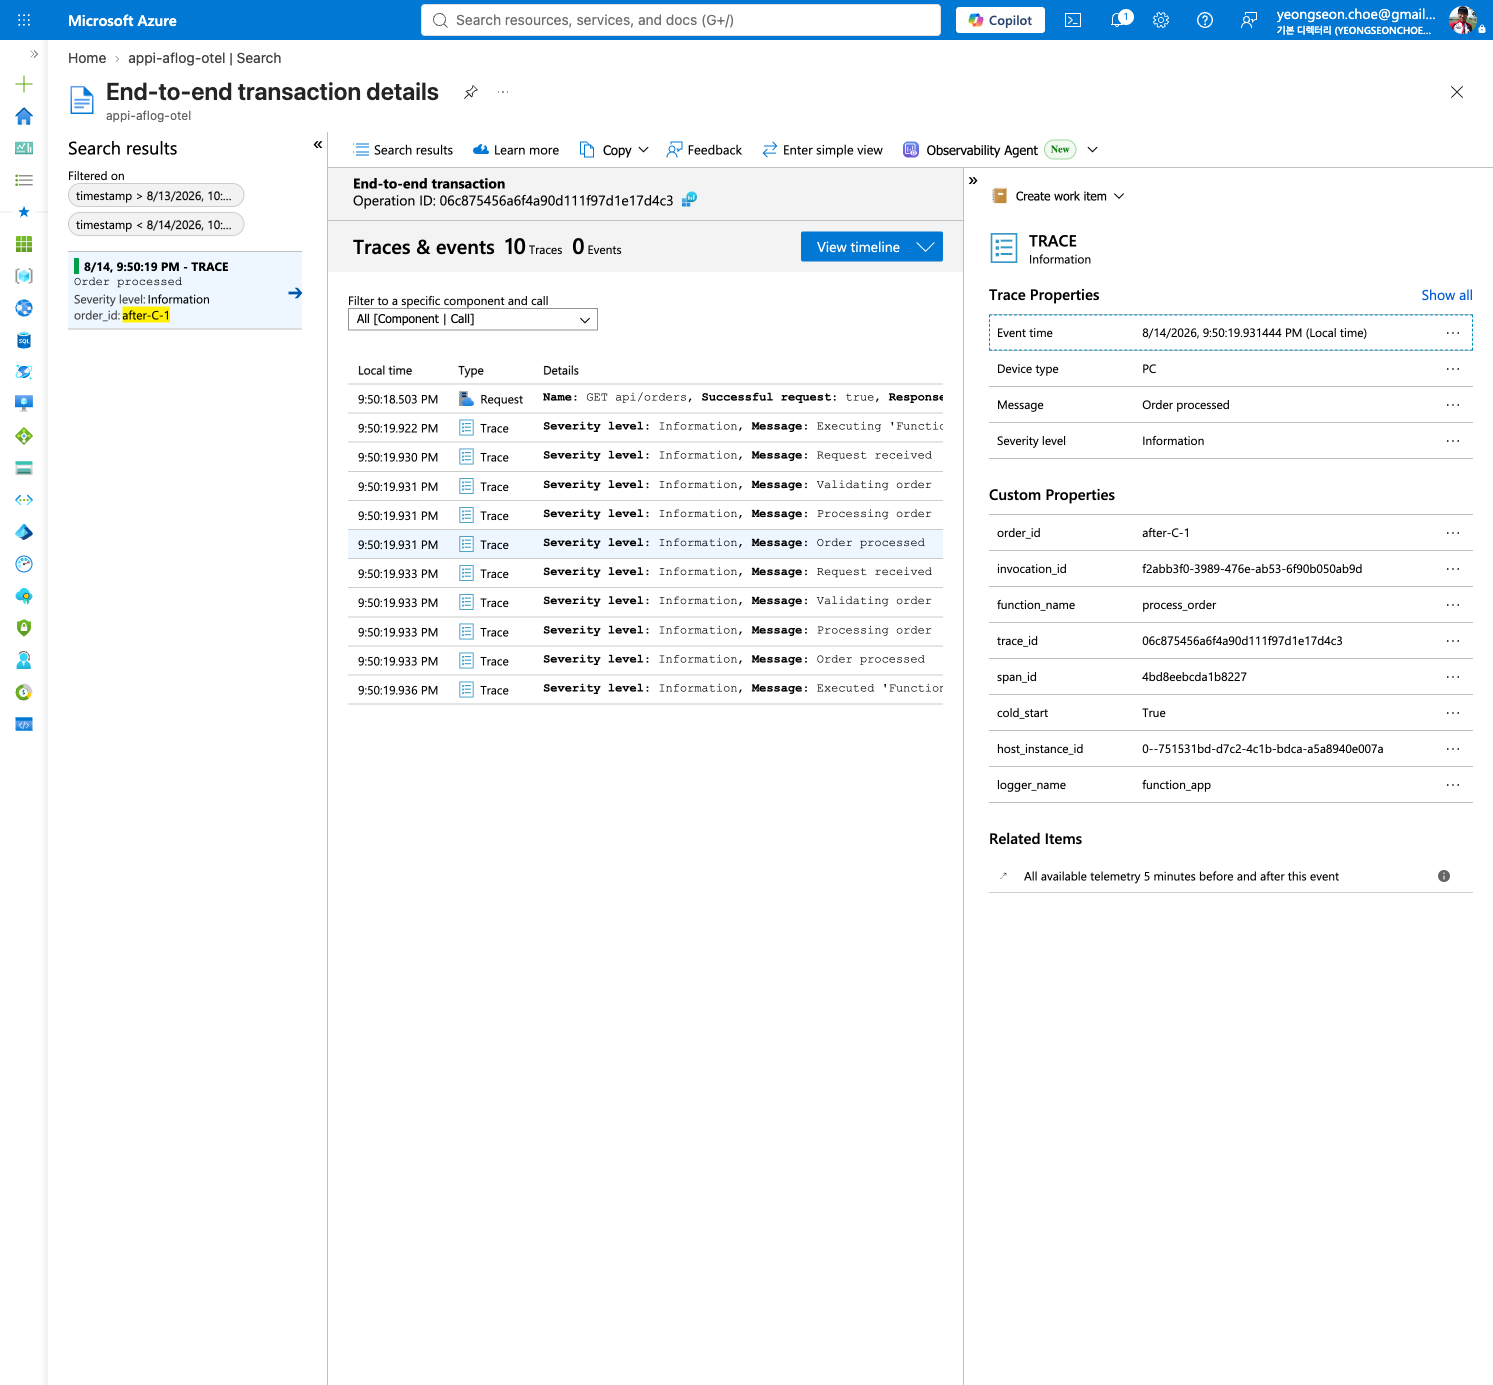
Correlated log records. Expanding Traces & events lists the worker's own
Processing order log records under the same Operation ID as the host
invocation span — the correlation activate_trace_context=True provides. Each
trace carries the invocation's InvocationId / functionName in its custom
properties, so the worker logs are no longer orphaned from the invocation: