Example: Cold Start Detection
azure-functions-logging automatically flags cold starts through the cold_start field when logging_context(context) is used.
Goal
Track first-invocation behavior and build simple metrics patterns from logs.
How It Works
Cold start logic is process-scoped:
- First call within
logging_context(context)in a process setscold_start=True. - Subsequent calls set
cold_start=False.
No manual counters are required in your code.
Baseline Azure Function
import azure.functions as func
from azure_functions_logging import JsonFormatter, get_logger, logging_context, setup_logging

setup_logging(functions_formatter=JsonFormatter())
logger = get_logger("cold-start-demo")

app = func.FunctionApp()


@app.route(route="status")
def status(req: func.HttpRequest, context: func.Context) -> func.HttpResponse:
    with logging_context(context):
        logger.info("status endpoint hit")
        return func.HttpResponse("ok")
Expected Event Pattern
After starting a new process:
{"message":"status endpoint hit","cold_start":true,...}
{"message":"status endpoint hit","cold_start":false,...}
{"message":"status endpoint hit","cold_start":false,...}
The first invocation after startup is your cold start marker.
In Application Insights
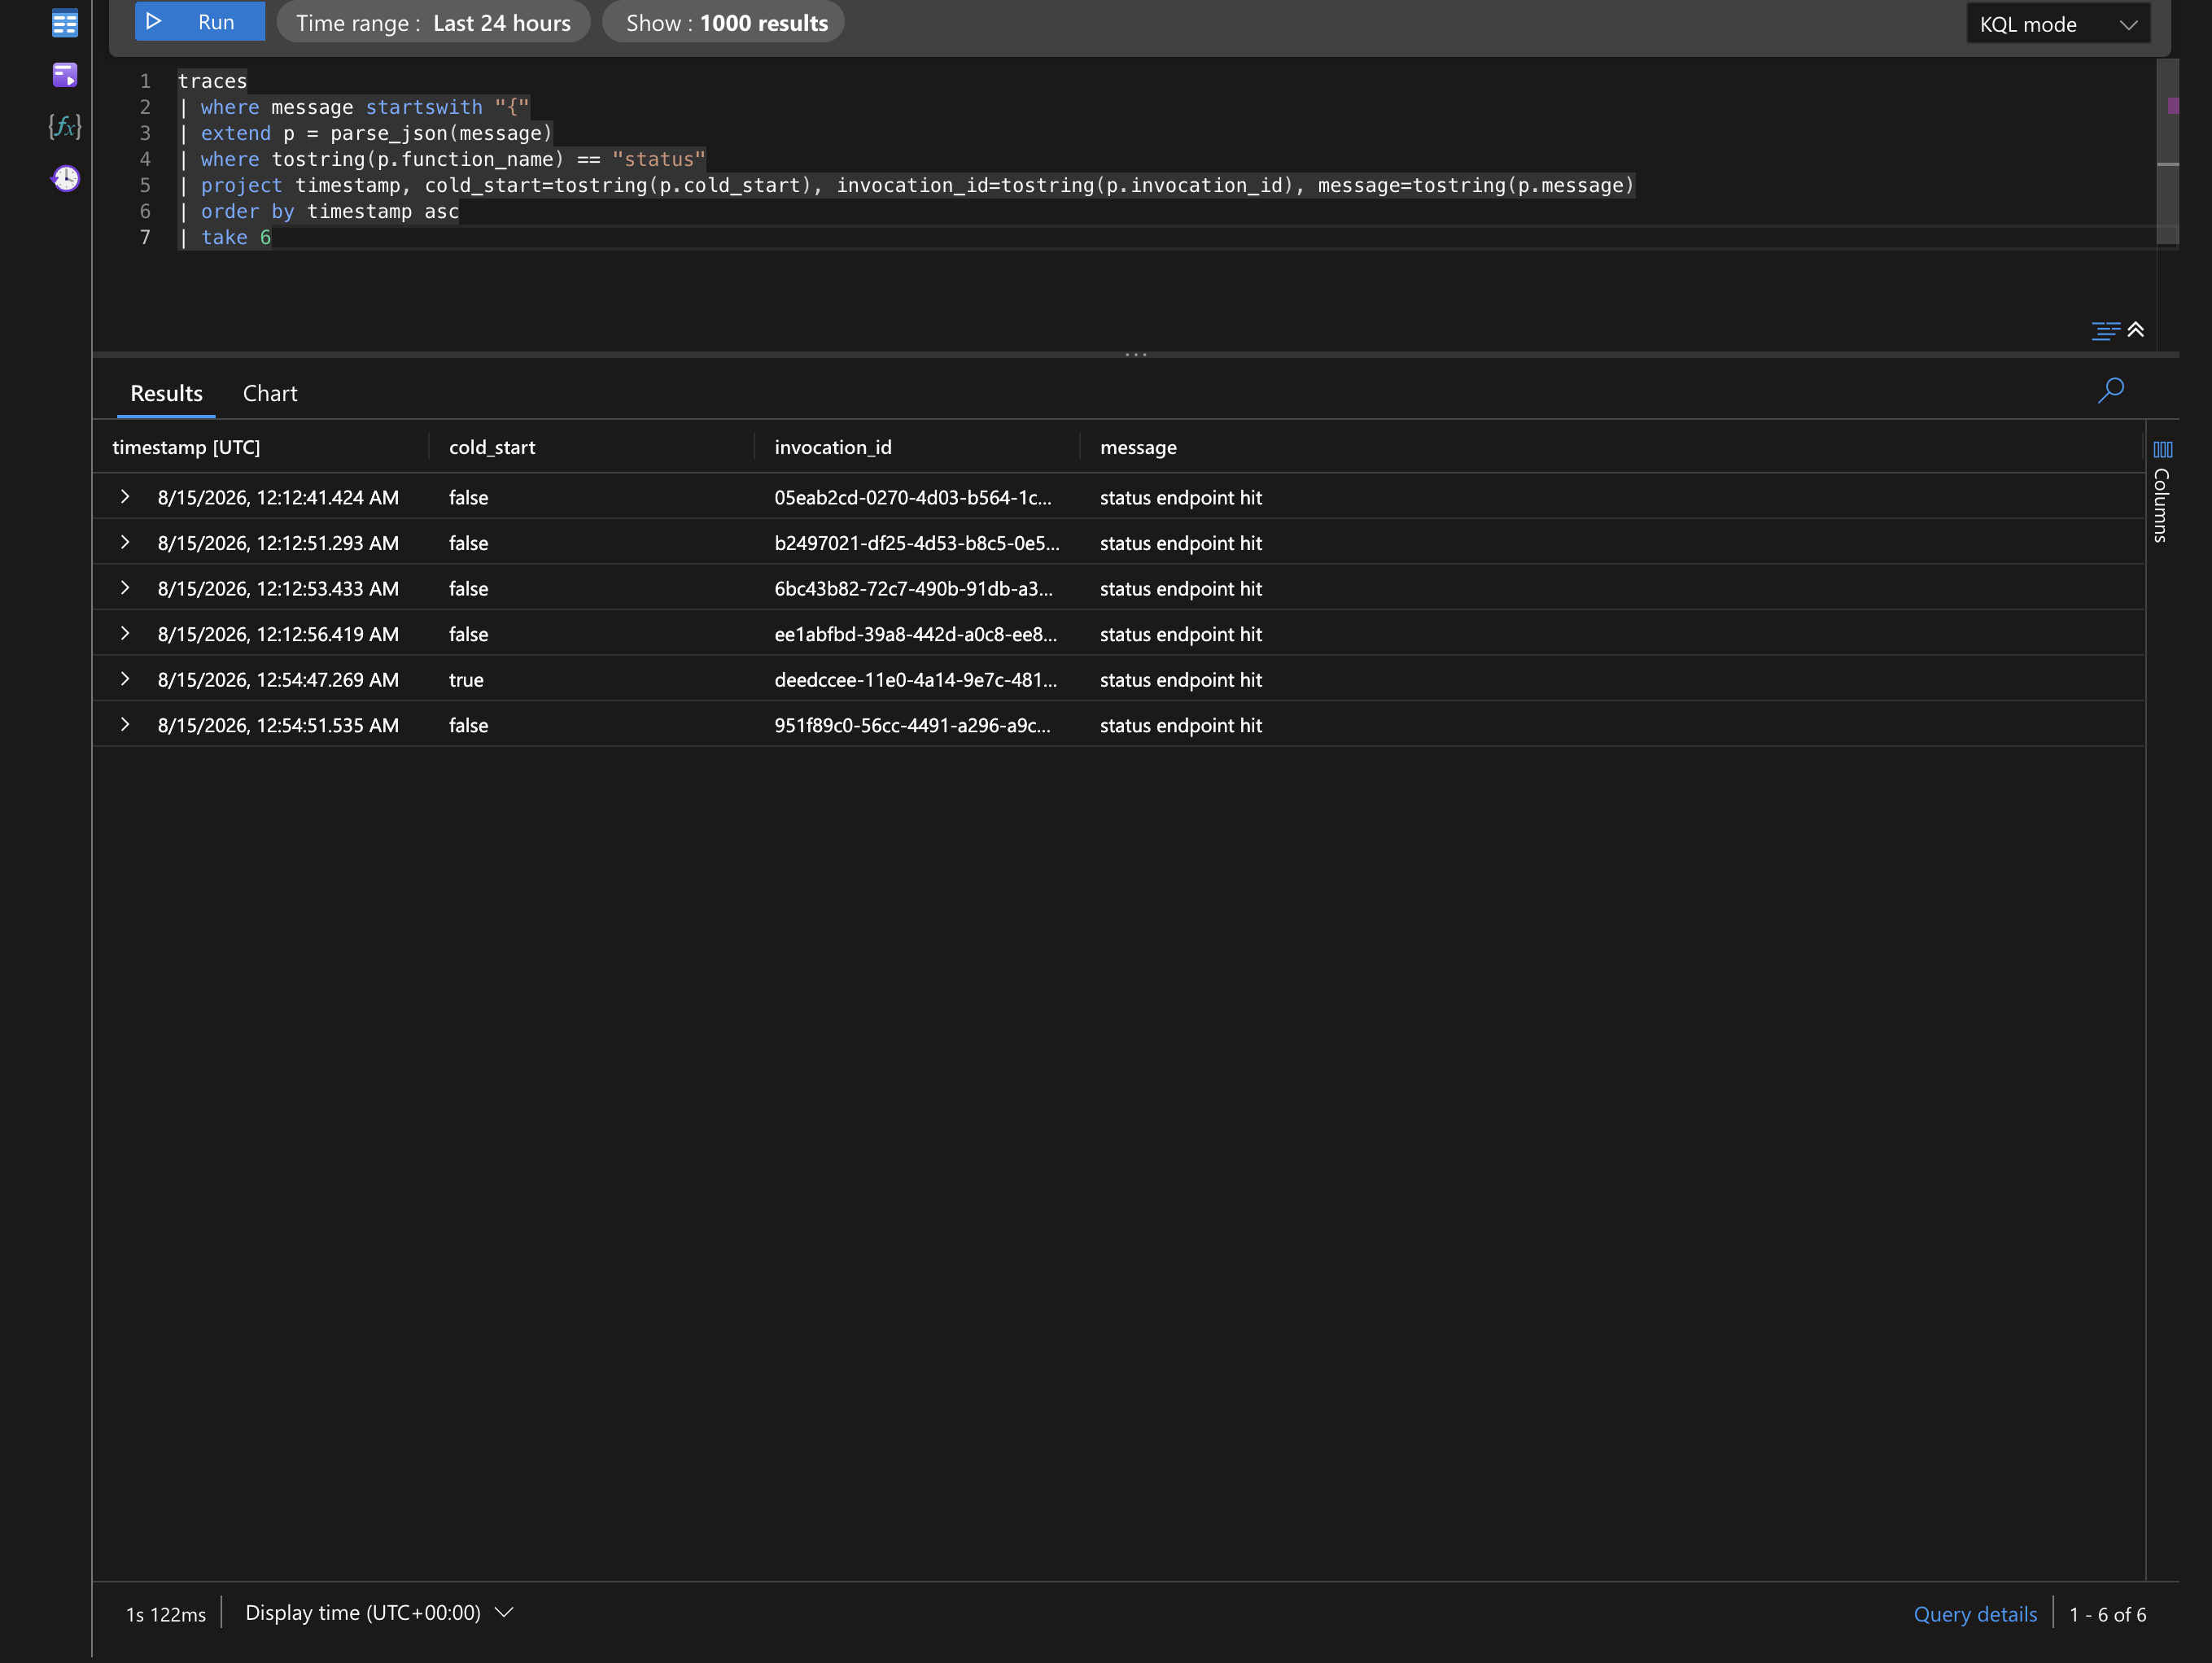
After deploying and sending a few requests to /api/status, query the traces table. In this deployment the structured JSON stays inside the message column, so we parse it with parse_json(message) (see the deployment query guide for the customDimensions-parsed variant).
traces
| where message startswith "{"
| extend p = parse_json(message)
| where tostring(p.function_name) == "status"
| project timestamp, cold_start=tostring(p.cold_start), invocation_id=tostring(p.invocation_id), message=tostring(p.message)
| order by timestamp asc
| take 6
Result from a real deployed app — only the first invocation on a fresh worker is flagged cold_start=true:
Cold start ratio over the last hour (matches the metrics pattern above):
traces
| where message startswith "{"
| extend p = parse_json(message)
| where timestamp > ago(1h)
| summarize cold = countif(tostring(p.cold_start) == "true"), total = count()
| extend cold_start_ratio = todouble(cold) / total
| cold | total | cold_start_ratio |
|---|---|---|
| 3 | 420 | 0.0071 |
If your pipeline parses the JSON into
customDimensionsinstead, dropparse_json(message)and readcustomDimensions.cold_startdirectly.
Local Verification Steps
- Start local function host.
- Send one request and inspect logs.
- Confirm
cold_start=trueon first event. - Send additional requests and confirm
false. - Restart host and repeat.
Metrics Pattern: Cold Start Ratio
From structured logs:
- Numerator: count of events where
cold_start=true. - Denominator: count of invocation-start events.
- Ratio: cold starts / total invocations.
This gives a simple startup pressure signal over time.
Metrics Pattern: Cold Start Latency Split
Log duration and group by cold_start:
import time

start = time.perf_counter()
# ... handler logic ...
elapsed_ms = int((time.perf_counter() - start) * 1000)
logger.info("request completed", duration_ms=elapsed_ms)
Then compare p50/p95 duration where:
cold_start=truecold_start=false
This separates startup cost from warm-path performance.
Alerting Pattern
Create alert rules for:
- Spike in cold start ratio.
- Elevated error rate when
cold_start=true. - Long tail latency concentrated in cold starts.
These rules improve operational clarity during scaling events.
Combining with Context Binding
request_logger = logger.bind(route="/status", method=req.method)
request_logger.info("request begin")
Now each event includes:
- Invocation metadata from
logging_context(context). - Route/request metadata from
bind().
Caveats
- Cold start state is process-local, not global to an app instance fleet.
- Scale-out introduces multiple processes with independent first invocations.
- Restarting host or recycling worker resets the first-call marker.
Practical Dashboard Dimensions
Use these dimensions together:
function_namecold_startlevelextra.duration_msextra.route
This enables fast drill-down from availability to startup-specific regressions.
Example Query Intention
Look for events like:
message == "request completed"cold_start == true- group by
function_name
Then compare against warm-path events over same time window.