High Latency / Slow Responses
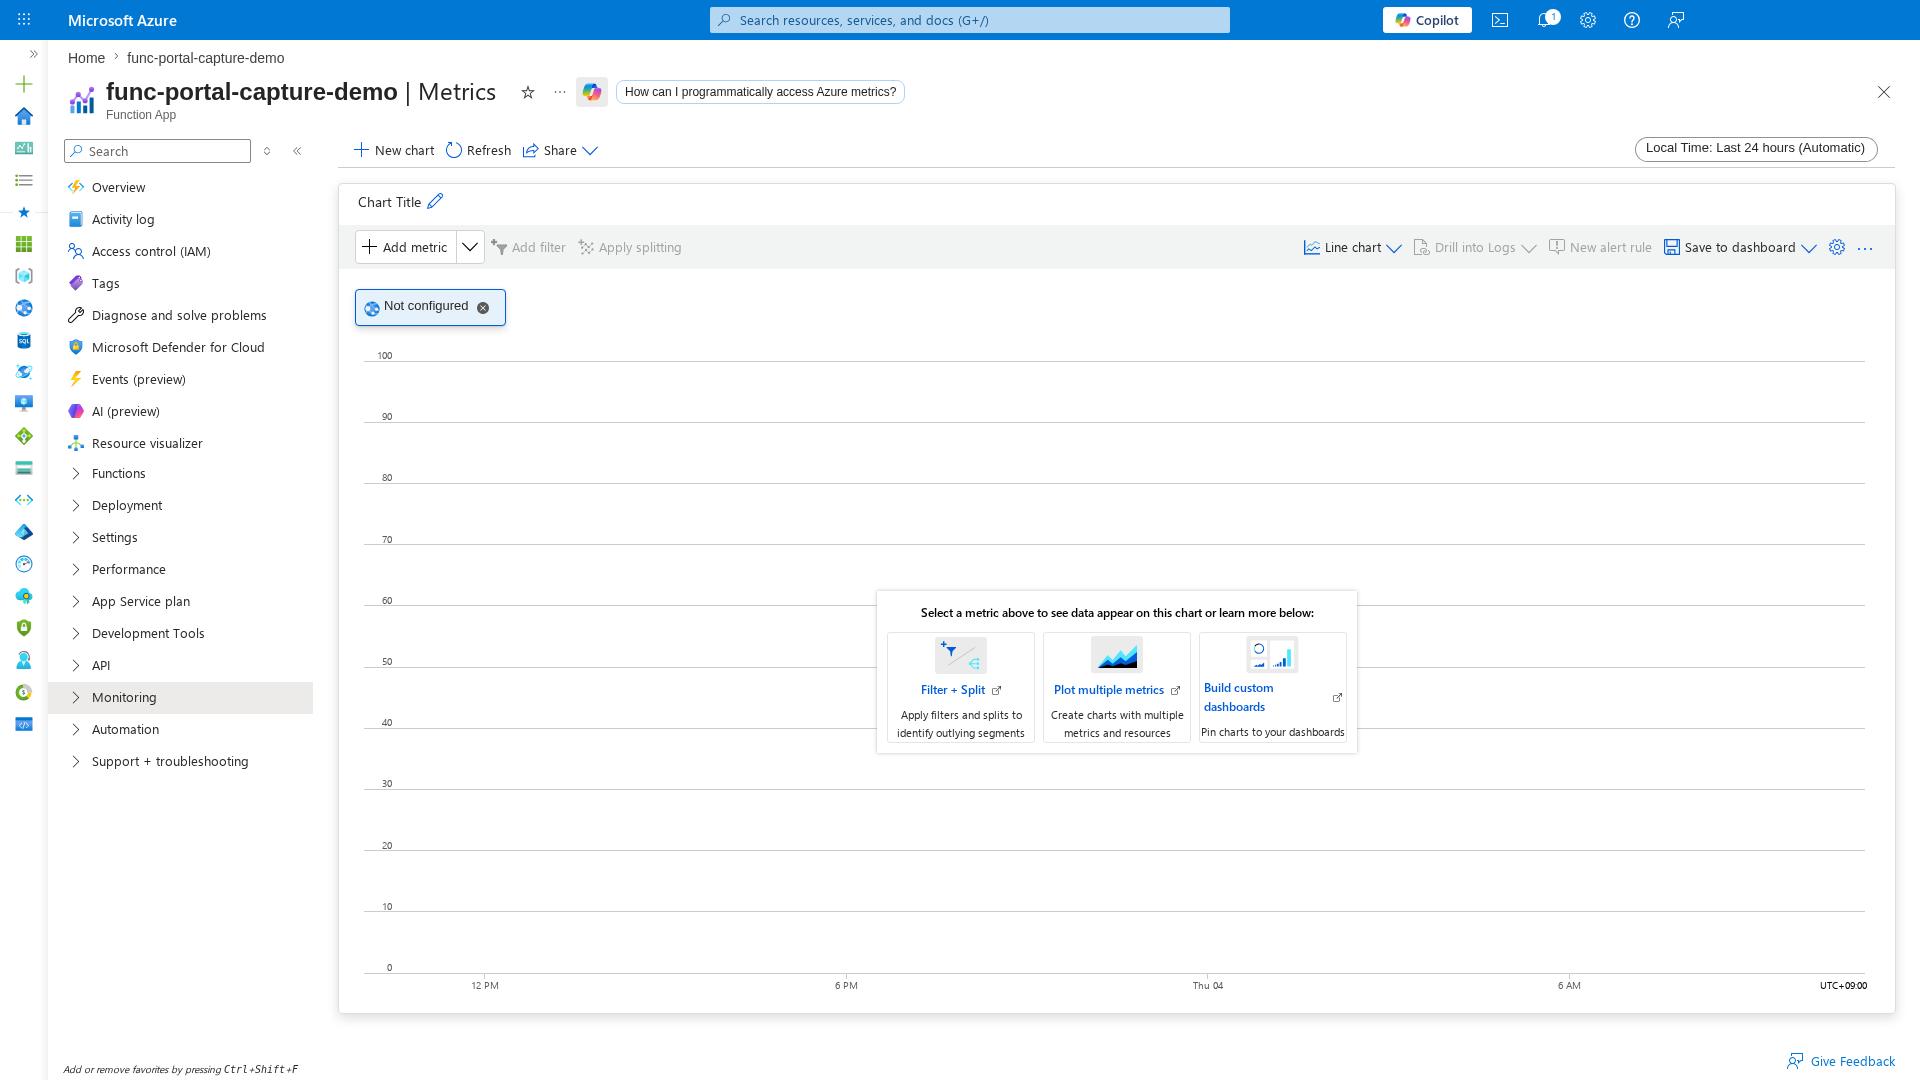
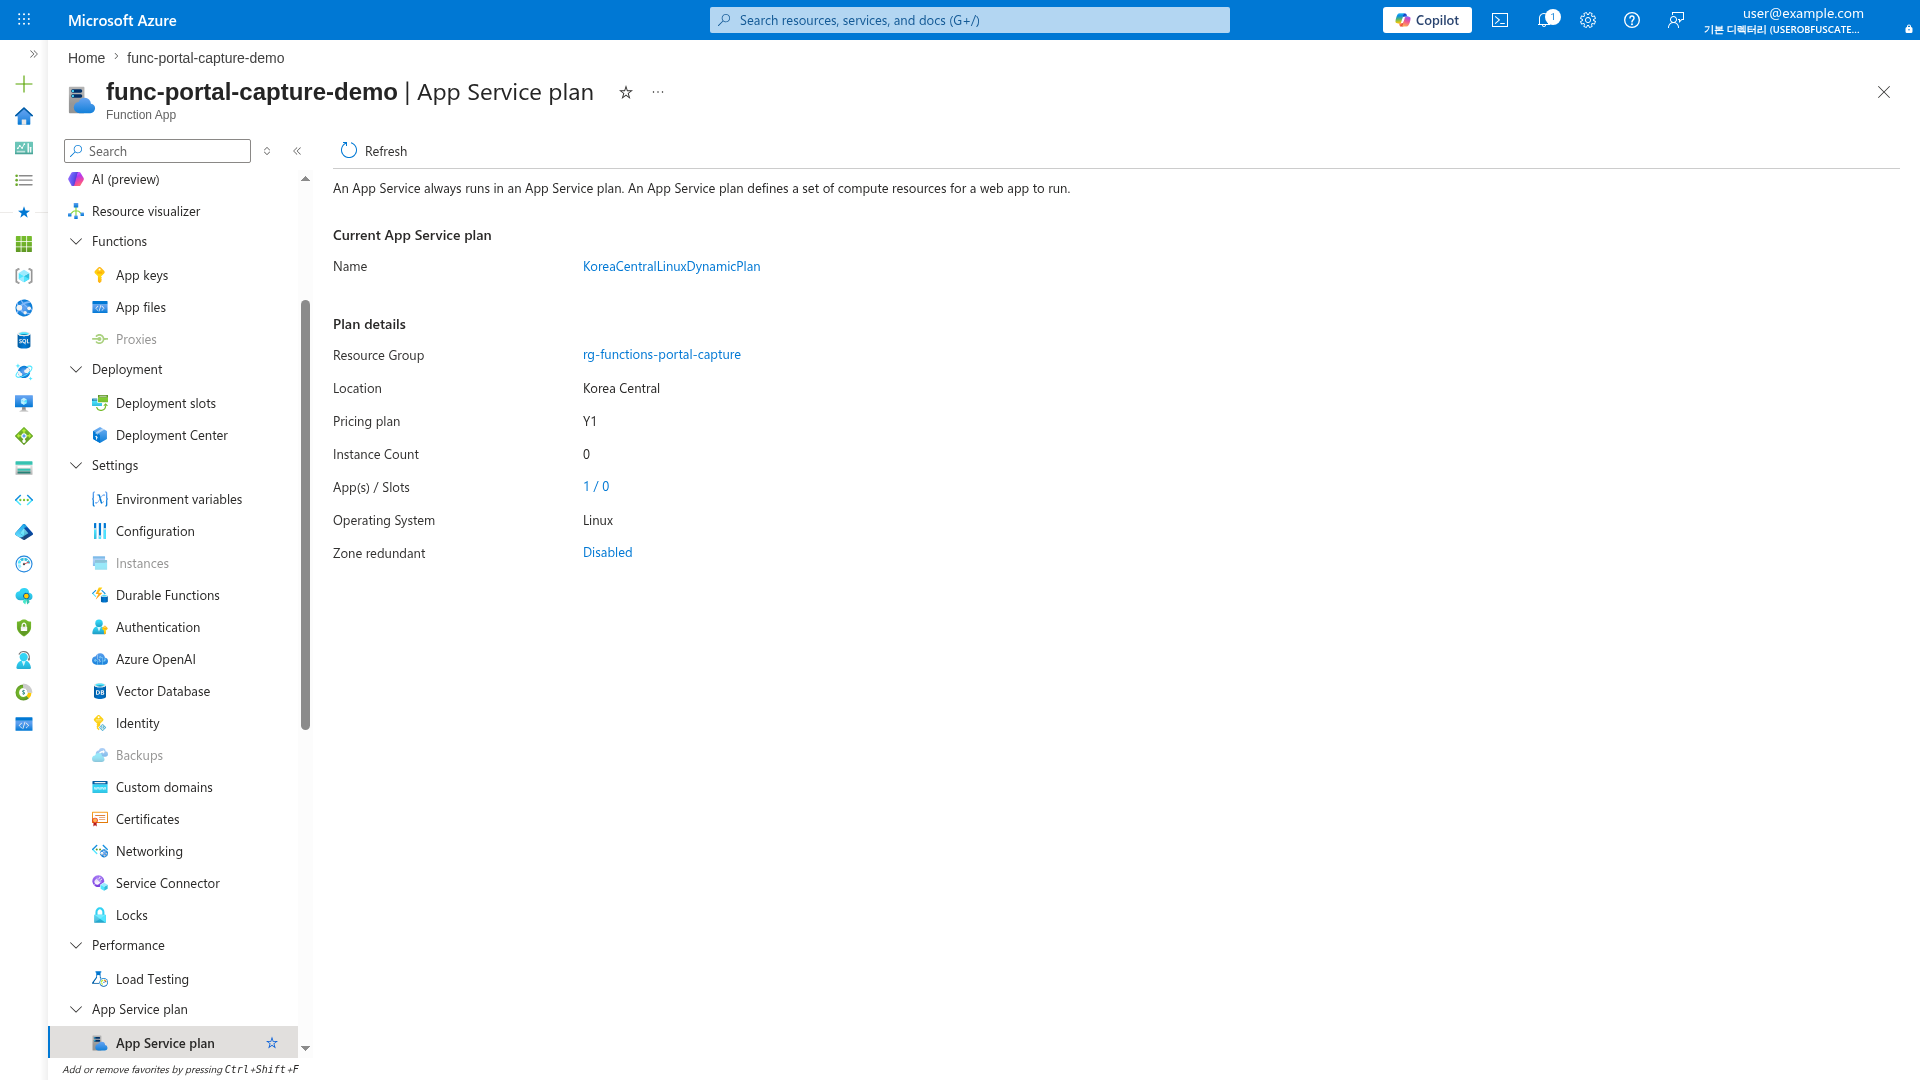
Portal Walkthrough
Key portal blades for high-latency investigation. Captures from a Consumption (Y1) Function App with PII masked.
1. Summary
This playbook handles incidents where Azure Functions shows slow responses, elevated p95/p99 latency, and intermittent timeout behavior. Use it when performance degradation is user-visible, even if failure rate is still low.
Troubleshooting decision flow
flowchart TD
    A[Latency alert or customer report] --> B{Mostly first request after idle?}
    B -->|Yes| H1[H1 Cold start delays]
    B -->|No| C{One dependency target has high p95?}
    C -->|Yes| H2[H2 Slow downstream dependency]
    C -->|No| D{Traffic grows but completion lags?}
    D -->|Yes| H3[H3 Concurrency saturation]
    D -->|No| E{Worker restart or pressure traces?}
    E -->|Yes| H4[H4 Plan-level resource limits]
    E -->|No| F[Correlate operation_Id end-to-end]
    H1 --> G[Mitigate and verify p95 improvement]
    H2 --> G
    H3 --> G
    H4 --> G
    F --> G
Scope and severity
| CLI element | Explanation |
|---|---|
| Command(s) | az account set, az monitor metrics list, az monitor log-analytics query |
| Key flags | --subscription, --resource, --metric, --interval, --aggregation, --offset, --output, --workspace, --analytics-query |
| Variables | $SUBSCRIPTION_ID, $RG, $APP_NAME, $WORKSPACE_ID |
| Expected result | Azure CLI applies the configuration change; confirm the returned JSON or follow-up query shows the expected value. |
Example output:
MetricName            TimeGrain  Average   Total
--------------------  ---------  --------  ------
AverageResponseTime   PT1M       330       0
AverageResponseTime   PT1M       1420      0
Requests              PT1M       0         158
Http5xx               PT1M       0         15
operation_Name                 P95Ms   Failures   Invocations
-----------------------------  ------  ---------  -----------
Functions.HttpIngress          2458    3          340
target                         type  Calls  Failed  P95Ms
-----------------------------  ----  -----  ------  -----
api.partner.internal           HTTP  328    2       1260
Decision trigger points
- Prioritize H1 when first invocation after idle is consistently slow.
- Prioritize H2 when one dependency target has clear p95 concentration.
- Prioritize H3 when p95 increases with traffic and completion lag.
5. Evidence to Collect
Mandatory artifacts
- Incident timeline with UTC timestamps and deployment/configuration changes.
- Request duration trend (p50/p95/p99) for at least 60 minutes.
- Dependency summary by target/type with p95 and failure rate.
- Host lifecycle traces (startup, shutdown, scale, drain, worker start).
Sample Log Patterns
# Abnormal: severe cold start
[2026-04-04T11:05:10Z] Host started (12543ms)
# Abnormal: dependency timeout
[2026-04-04T11:16:02Z] Executing 'Functions.HttpIngress' (Id=xxxxxxxx-xxxx-xxxx-xxxx-xxxxxxxxxxxx)
[2026-04-04T11:16:32Z] Dependency call failed: target=api.partner.internal, error=TimeoutException, duration=30011ms
[2026-04-04T11:16:32Z] Executed 'Functions.HttpIngress' (Failed, Duration=30218ms)
# Abnormal: concurrency pressure
[2026-04-04T11:22:45Z] Requests in flight=412, completed per second=25, queued=187
[2026-04-04T11:22:46Z] Function execution delayed due to host concurrency limits.
# Normal: warm baseline
[2026-04-04T11:40:00Z] Host started (200ms)
[2026-04-04T11:40:01Z] Dependency call success: target=api.partner.internal, duration=84ms
KQL Queries with Example Output
Query 1: Function execution summary (from kql/index.md #1)
let appName = "func-myapp-prod";
requests
| where timestamp > ago(1h)
| where cloud_RoleName =~ appName
| where operation_Name startswith "Functions."
| summarize
    Invocations = count(),
    Failures = countif(success == false),
    FailureRatePercent = round(100.0 * countif(success == false) / count(), 2),
    P95Ms = percentile(duration, 95)
  by FunctionName = operation_Name
| order by Failures desc, P95Ms desc
Query 2: Cold start analysis (from kql/index.md #3)
let appName = "func-myapp-prod";
traces
| where timestamp > ago(6h)
| where cloud_RoleName =~ appName
| where message has_any ("Host started", "Initializing Host", "Host lock lease acquired")
| summarize StartupEvents=count() by bin(timestamp, 15m)
| join kind=leftouter (
    requests
    | where timestamp > ago(6h)
    | where cloud_RoleName =~ appName
    | where operation_Name startswith "Functions."
    | summarize FirstInvocation=min(timestamp), FirstDurationMs=arg_min(timestamp, toreal(duration / 1ms)) by bin(timestamp, 15m)
) on timestamp
| order by timestamp desc
Query 3: Dependency call failures (from kql/index.md #4)
let appName = "func-myapp-prod";
dependencies
| where timestamp > ago(1h)
| where cloud_RoleName =~ appName
| summarize
    Calls=count(),
    Failed=countif(success == false),
    FailureRatePercent=round(100.0 * countif(success == false) / count(), 2),
    P95Ms=percentile(duration, 95)
  by target, type
| order by Failed desc, P95Ms desc
Data quality checks
- Ensure all queries filter
cloud_RoleNameand consistent time windows. - Confirm IDs are masked (
xxxxxxxx-xxxx-xxxx-xxxx-xxxxxxxxxxxx).
6. Validation and Disproof by Hypothesis
H1: Cold start delays
Signals that support
- Slow requests cluster at idle-to-active transitions.
- Startup events increase near latency spike windows.
Signals that weaken
- Latency remains high during sustained warm traffic.
- No startup events near latency windows.
What to verify with INLINE KQL
let appName = "func-myapp-prod";
traces
| where timestamp > ago(6h)
| where cloud_RoleName =~ appName
| where message has_any ("Host started", "Initializing Host", "Host lock lease acquired")
| summarize StartupEvents=count() by bin(timestamp, 15m)
| join kind=leftouter (
    requests
    | where timestamp > ago(6h)
    | where cloud_RoleName =~ appName
    | where operation_Name startswith "Functions."
    | summarize FirstInvocation=min(timestamp), FirstDurationMs=arg_min(timestamp, toreal(duration / 1ms)) by bin(timestamp, 15m)
) on timestamp
| order by timestamp desc
How to Read This
Rising StartupEvents together with elevated FirstDurationMs supports H1. If startup events rise but first duration stays low, H1 is weaker.
CLI investigation
az monitor log-analytics query \
  --workspace "$WORKSPACE_ID" \
  --analytics-query "traces | where timestamp > ago(6h) | where cloud_RoleName =~ '$APP_NAME' | where message has_any ('Host started','Initializing Host','Host lock lease acquired') | summarize StartupEvents=count() by bin(timestamp, 15m) | order by timestamp desc" \
  --output table
| CLI element | Explanation |
|---|---|
| Command(s) | az monitor log-analytics query |
| Key flags | --workspace, --analytics-query, --output |
| Variables | $WORKSPACE_ID, $APP_NAME |
| Expected result | Azure CLI returns the requested resource data; verify names, IDs, status fields, or metric values match the scenario. |
Example output:
H2: Slow downstream dependency
Signals that support
- One target has sustained high dependency p95.
- Request latency follows that target's latency profile.
Signals that weaken
- Dependency p95 is normal while request p95 is high.
- No concentration by
target.
What to verify with INLINE KQL
let appName = "func-myapp-prod";
dependencies
| where timestamp > ago(1h)
| where cloud_RoleName =~ appName
| summarize
    Calls=count(),
    Failed=countif(success == false),
    FailureRatePercent=round(100.0 * countif(success == false) / count(), 2),
    P95Ms=percentile(duration, 95)
  by target, type
| order by Failed desc, P95Ms desc
How to Read This
A single target with high P95Ms and high concentration strongly supports H2. Low failure rate does not disprove H2 when latency is dominant.
CLI investigation
az monitor log-analytics query \
  --workspace "$WORKSPACE_ID" \
  --analytics-query "dependencies | where timestamp > ago(1h) | where cloud_RoleName =~ '$APP_NAME' | summarize Calls=count(), Failed=countif(success==false), FailureRatePercent=round(100.0*countif(success==false)/count(),2), P95Ms=percentile(duration,95) by target, type | order by Failed desc, P95Ms desc" \
  --output table
| CLI element | Explanation |
|---|---|
| Command(s) | az monitor log-analytics query |
| Key flags | --workspace, --analytics-query, --output |
| Variables | $WORKSPACE_ID, $APP_NAME |
| Expected result | Azure CLI returns the requested resource data; verify names, IDs, status fields, or metric values match the scenario. |
Example output:
target                          type  Calls  Failed  FailureRatePercent  P95Ms
------------------------------  ----  -----  ------  ------------------  -----
api.partner.internal            HTTP  328    2       0.61                1310
H3: Concurrency saturation
Signals that support
- Request volume increases while completion rate plateaus.
- p95 and p99 rise together and remain elevated.
Signals that weaken
- Latency spikes during low traffic.
- High latency only on first invocation after idle.
What to verify with INLINE KQL
let appName = "func-myapp-prod";
requests
| where timestamp > ago(2h)
| where cloud_RoleName =~ appName
| where operation_Name startswith "Functions."
| summarize
    Invocations=count(),
    Failures=countif(success == false),
    FailureRatePercent=round(100.0 * countif(success == false) / count(), 2),
    P95Ms=percentile(duration, 95),
    P99Ms=percentile(duration, 99)
  by FunctionName=operation_Name, bin(timestamp, 5m)
| order by timestamp desc
How to Read This
Rising load plus sustained p95/p99 growth supports H3. Combine with scale/worker traces to separate transient burst from saturation.
CLI investigation
az monitor metrics list \
  --resource "/subscriptions/$SUBSCRIPTION_ID/resourceGroups/$RG/providers/Microsoft.Web/sites/$APP_NAME" \
  --metric "Requests" "AverageResponseTime" \
  --interval PT1M \
  --aggregation Total Average \
  --offset 2h \
  --output table
az monitor log-analytics query \
  --workspace "$WORKSPACE_ID" \
  --analytics-query "traces | where timestamp > ago(2h) | where cloud_RoleName =~ '$APP_NAME' | where message has_any ('worker','instance','concurrency','drain','scale') | project timestamp, severityLevel, message | order by timestamp desc" \
  --output table
| CLI element | Explanation |
|---|---|
| Command(s) | az monitor metrics list, az monitor log-analytics query |
| Key flags | --resource, --metric, --interval, --aggregation, --offset, --output, --workspace, --analytics-query |
| Variables | $SUBSCRIPTION_ID, $RG, $APP_NAME, $WORKSPACE_ID |
| Expected result | Azure CLI returns the requested resource data; verify names, IDs, status fields, or metric values match the scenario. |
Example output:
MetricName            TimeGrain  Total  Average
--------------------  ---------  -----  -------
Requests              PT1M       164    0
AverageResponseTime   PT1M       0      1490
timestamp                severityLevel  message
-----------------------  -------------  ---------------------------------------------------------
2026-04-04T11:22:46.000Z 1              Function execution delayed due to host concurrency limits.
2026-04-04T11:22:45.000Z 1              Requests in flight=412, completed per second=25, queued=187
H4: Plan-level resource limits
Signals that support
- Multiple pressure signals: latency increase, retries, intermittent failures.
- Frequent worker starts, drain events, or host shutdown traces.
Signals that weaken
- One dependency fully explains the latency increase.
- No lifecycle or pressure traces during incident window.
What to verify with INLINE KQL
let appName = "func-myapp-prod";
traces
| where timestamp > ago(6h)
| where cloud_RoleName =~ appName
| where message has_any ("scale", "instance", "worker", "concurrency", "drain", "Host shutdown", "Host is shutting down")
| project timestamp, severityLevel, message
| order by timestamp desc
How to Read This
Repeated restart/drain patterns during high latency support H4. Validate together with request and dependency trends before final attribution.
CLI investigation
az monitor log-analytics query \
  --workspace "$WORKSPACE_ID" \
  --analytics-query "traces | where timestamp > ago(6h) | where cloud_RoleName =~ '$APP_NAME' | where message has_any ('scale','instance','worker','concurrency','drain','Host shutdown','Host is shutting down') | project timestamp, severityLevel, message | order by timestamp desc" \
  --output table
az functionapp plan show \
  --resource-group "$RG" \
  --name "$PLAN_NAME" \
  --output json
| CLI element | Explanation |
|---|---|
| Command(s) | az monitor log-analytics query, az functionapp plan show |
| Key flags | --workspace, --analytics-query, --output, --resource-group, --name |
| Variables | $WORKSPACE_ID, $APP_NAME, $RG, $PLAN_NAME |
| Expected result | Azure CLI returns the requested resource data; verify names, IDs, status fields, or metric values match the scenario. |
Example output:
timestamp                severityLevel  message
-----------------------  -------------  -----------------------------------------------
2026-04-04T11:31:20.000Z 1              Host is shutting down.
{
  "name": "plan-func-prod",
  "sku": {
    "tier": "ElasticPremium",
    "name": "EP1"
  },
  "maximumElasticWorkerCount": 20
}
Correlation query for single slow invocation
Use this when you have a known operation_Id.
let opId = "<operation-id>";
union isfuzzy=true
(
    requests
    | where operation_Id == opId
    | project timestamp, itemType="request", name=operation_Name, success, resultCode, duration, details=tostring(url)
),
(
    dependencies
    | where operation_Id == opId
    | project timestamp, itemType="dependency", name=target, success, resultCode, duration, details=tostring(data)
),
(
    exceptions
    | where operation_Id == opId
    | project timestamp, itemType="exception", name=type, success=bool(false), resultCode="", duration=timespan(null), details=outerMessage
),
(
    traces
    | where operation_Id == opId
    | project timestamp, itemType="trace", name="trace", success=bool(true), resultCode="", duration=timespan(null), details=message
)
| order by timestamp asc
7. Likely Root Cause Patterns
Pattern catalog
| Pattern ID | Symptom cluster | Strongest evidence | Likely root cause |
|---|---|---|---|
| P1 | First invocation slow after idle | Startup events + high first duration | Cold start and instance allocation cost |
| P2 | One dependency dominates latency | Target-level p95 concentration | Downstream API/database bottleneck |
| P3 | Tail latency rises with traffic | Load increase + queueing signals | Concurrency saturation |
| P4 | Broad latency with worker churn | Restart/drain/shutdown traces | Plan-level resource constraints |
| ### Normal vs Abnormal Comparison | |||
| Signal | Normal | Abnormal | Interpretation |
| --- | --- | --- | --- |
| Host startup trace | Host started (< 1000ms) | Host started (> 5000ms) repeated | Cold start or recycle pressure |
| Dependency p95 by target | Critical targets < 300ms | Single target > 1000ms sustained | Downstream bottleneck likely |
| Request latency distribution | Stable p95 with brief spikes | Sustained p95/p99 growth | Systemic latency degradation |
| Scale and worker lifecycle | Occasional starts under load | Frequent drain/restart loops | Capacity instability |
| Failures with latency | Independent or low failures | Latency and failures rise together | Timeout/retry amplification |
| ### Common misdiagnoses | |||
| - Declaring H1 without checking H2 and H3 evidence. | |||
| ## 8. Immediate Mitigations | |||
| ### H1 mitigations | |||
| - Enable always-ready/pre-warmed capacity where plan supports it. | |||
| - Minimize startup cost with lazy initialization and dependency trimming. | |||
| ### H2 mitigations | |||
| - Apply per-target timeout budgets aligned to end-to-end SLO. | |||
| - Use circuit breaker and fallback for unstable dependencies. | |||
| ### H3 mitigations | |||
| - Limit in-flight work and apply backpressure on hot routes. | |||
| - Shift blocking operations off synchronous request path. | |||
| ### H4 mitigations | |||
| - Increase capacity tier or scale-out headroom. | |||
| - Review connection pools, socket reuse, and outbound call patterns. | |||
| ### Post-mitigation verification | |||
| 1. Re-run request/dependency KQL with same granularity and window. | |||
| 2. Confirm p95/p99 reduction is sustained for at least 30 minutes. | |||
| 3. Confirm timeout and retry rates decline without backlog growth. | |||
| ## 9. Prevention | |||
| ### Engineering controls | |||
| - Define SLO alerts for p50, p95, and p99 separately. | |||
| - Add synthetic probes for idle-to-first-request latency regression. | |||
| - Instrument target-level dependency latency and timeout telemetry. | |||
| - Emit metrics for in-flight work, queue delay, and completion throughput. | |||
| ### Capacity and architecture controls | |||
| - Run performance tests with burst, idle, and downstream slowdown scenarios. | |||
| - Validate hosting plan choice against concurrency and latency SLO. | |||
| ### Operational controls | |||
| - Maintain baseline workbook with normal startup and dependency signatures. | |||
| - Require hypothesis validation/disproof evidence in post-incident reviews. | |||
| ### Related Labs | |||
| - Cold Start Lab | |||
| ## See Also | |||
| - First 10 Minutes | |||
| - Troubleshooting Methodology | |||
| - KQL Query Library | |||
| - Troubleshooting Playbooks | |||
| ## Sources | |||
| - Monitor Azure Functions | |||
| - Application Insights telemetry data model | |||
| - Kusto Query Language overview | |||
| - Azure Functions hosting options |