First 10 Minutes: High Latency
When function execution latency is elevated or users report slow responses, use this checklist to narrow down the cause within the first 10 minutes.
Portal Walkthrough
These portal blades are the first places to check during high-latency triage. All captures from a Consumption (Y1) Function App with PII masked.
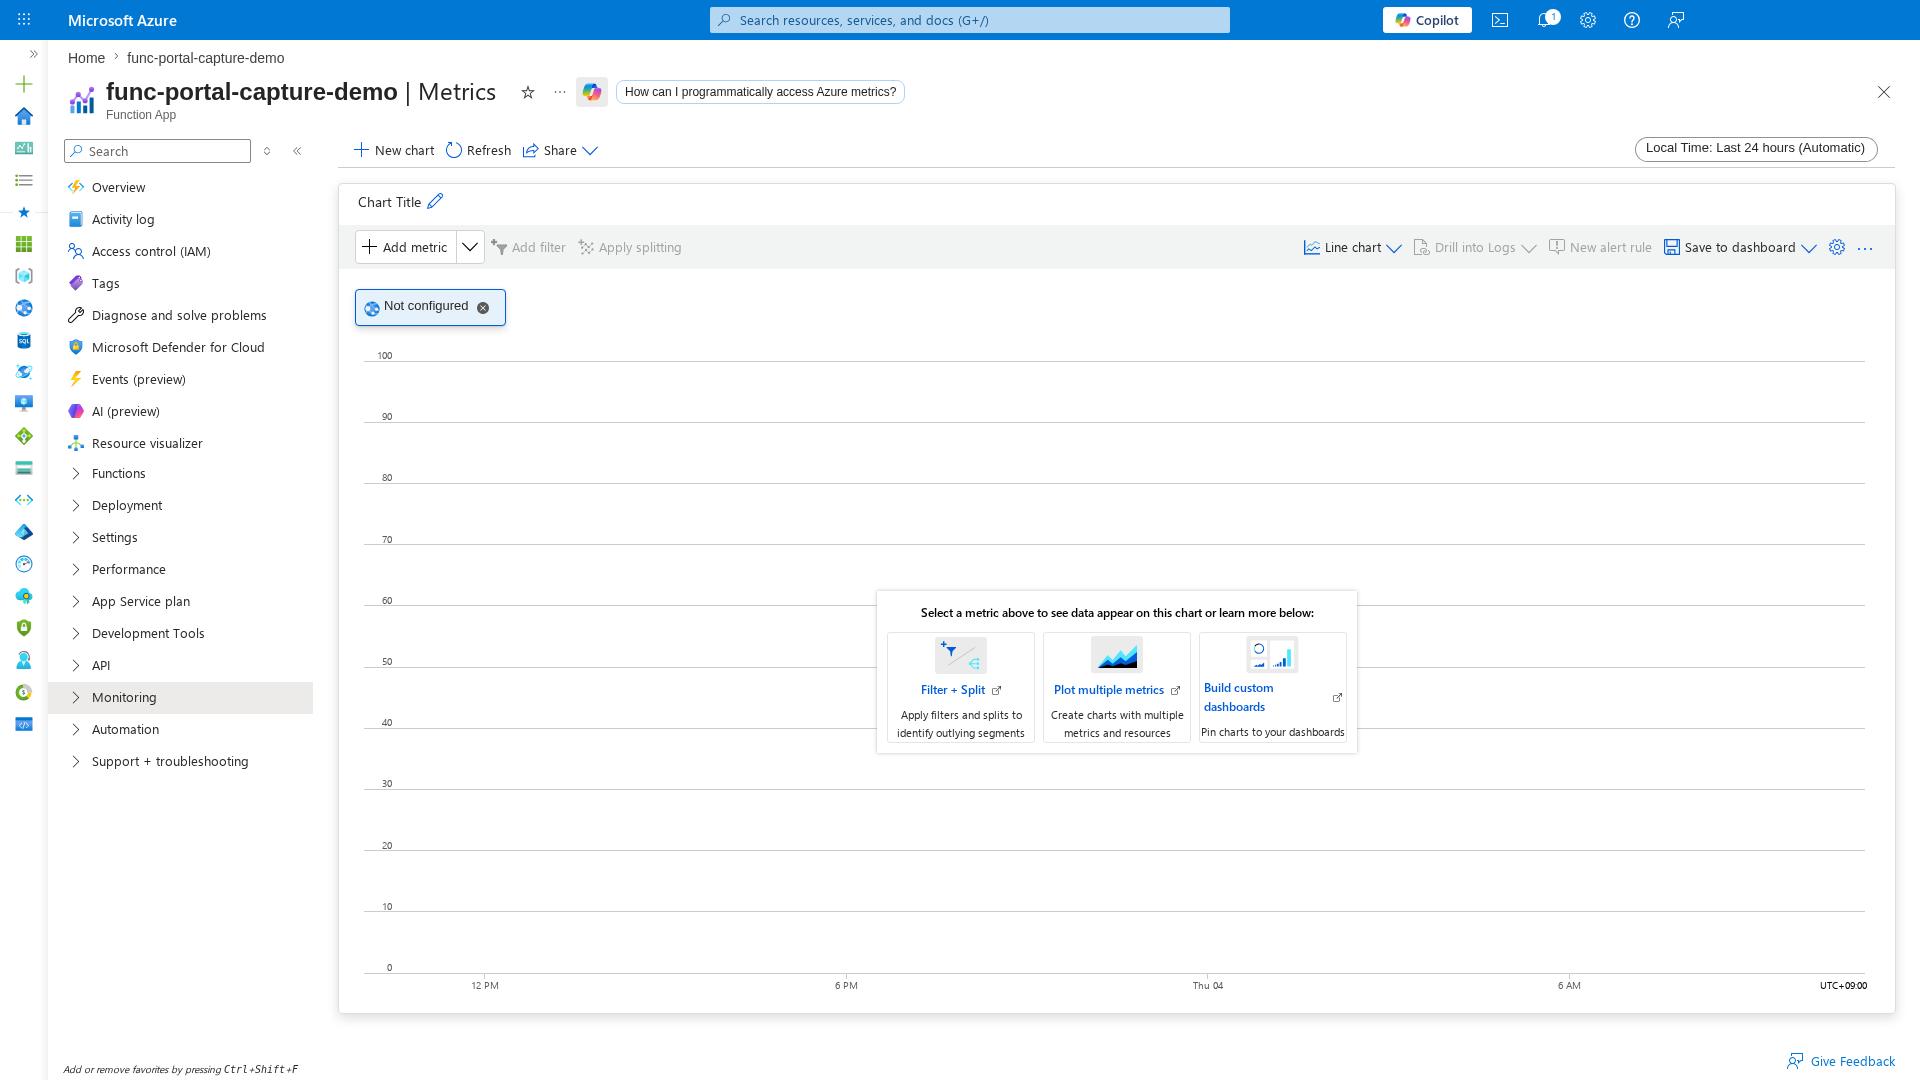
Metrics Explorer
[Observed] The Metrics blade lets you chart FunctionExecutionCount, FunctionExecutionUnits, and HTTP latency percentiles to identify when latency began rising:
Log Stream
[Observed] The Log stream blade shows real-time execution output, making it easy to spot slow invocations and dependency timeouts as they happen:
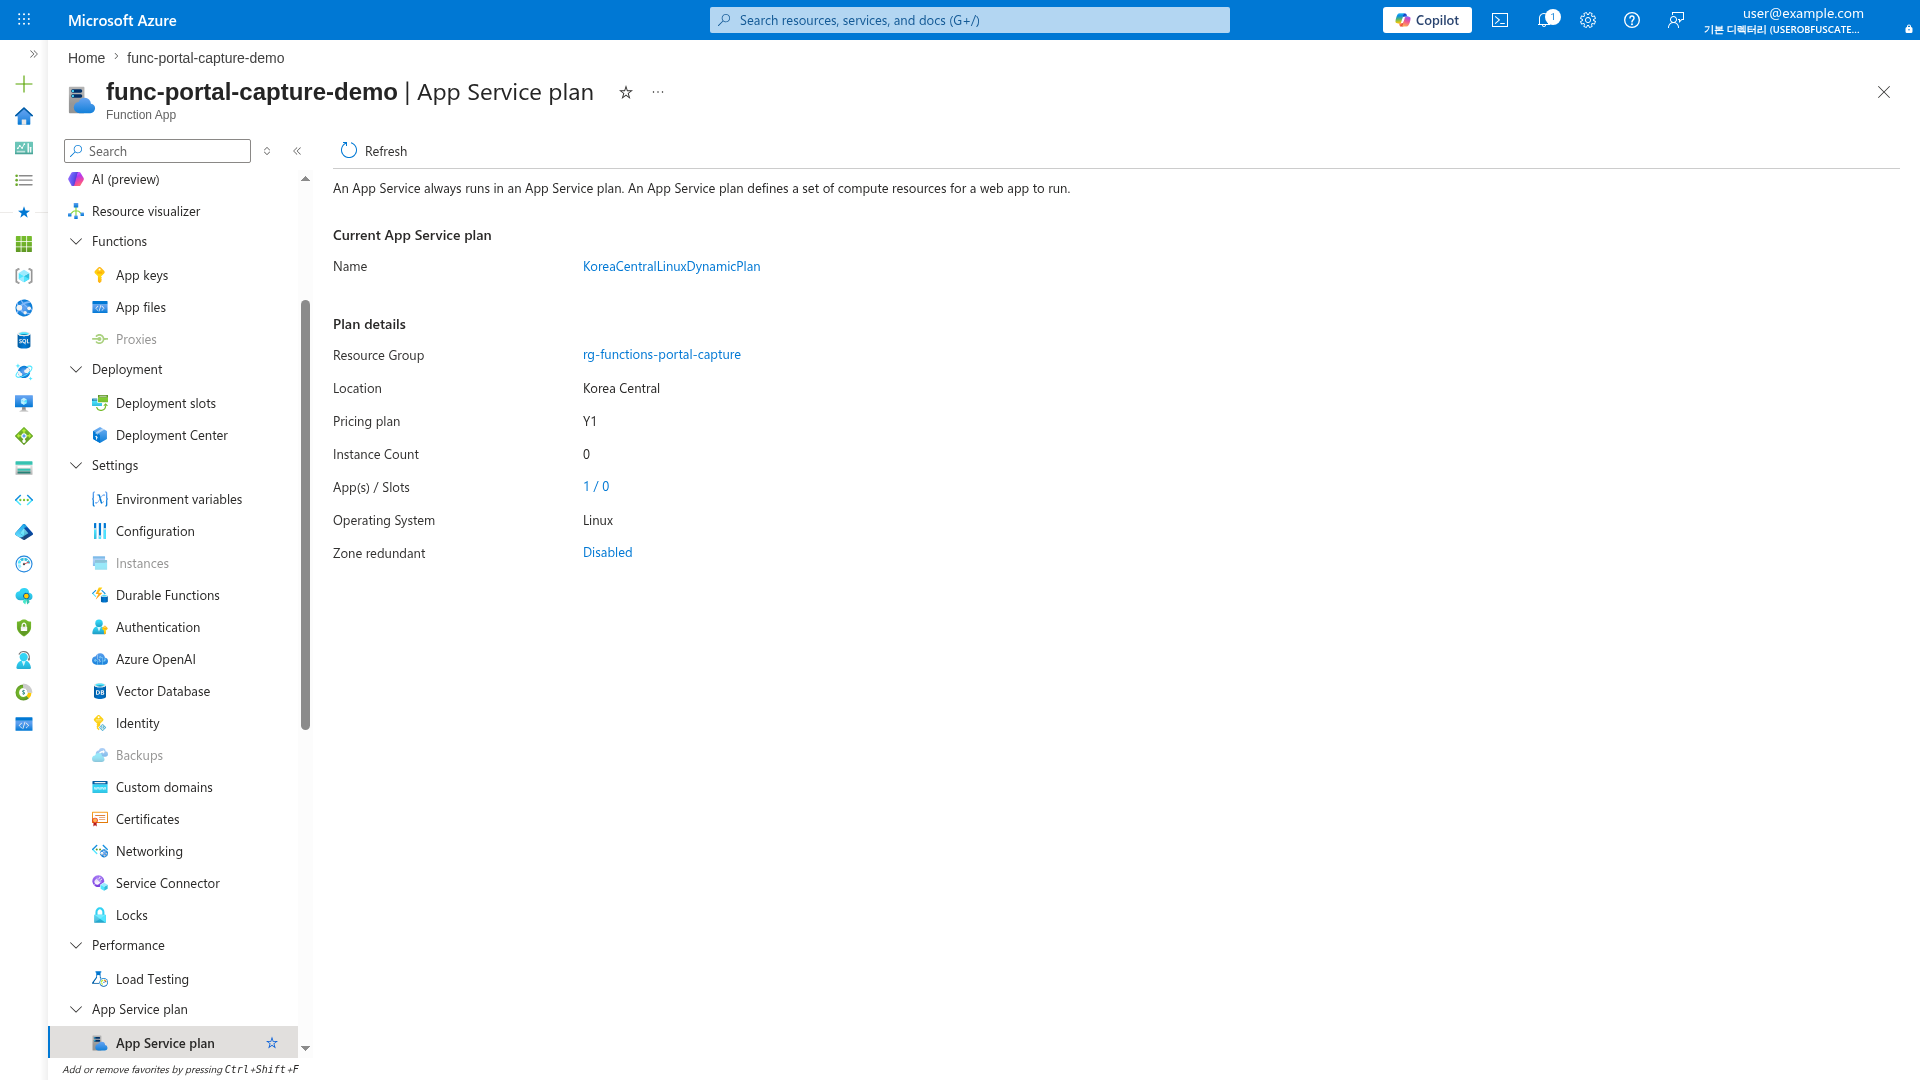
App Service Plan
[Observed] The App Service plan blade confirms the hosting plan (Y1/EP/FC1) and instance count, which directly affects cold-start behavior:
Prerequisites
- Azure CLI access to the production subscription.
- Access to Application Insights and Log Analytics.
- Health endpoint implemented at
GET /api/health.
Set shared variables:
RG="rg-myapp-prod"
APP_NAME="func-myapp-prod"
SUBSCRIPTION_ID="<subscription-id>"
APP_INSIGHTS_NAME="appi-myapp-prod"
WORKSPACE_ID="xxxxxxxx-xxxx-xxxx-xxxx-xxxxxxxxxxxx"
flowchart TD
    A[High latency reported] --> B["Check regional/platform status"]
    B --> C[Latency trend by function]
    C --> D{Cold start correlation?}
    D -->|Yes| E[Plan-specific cold-start mitigation]
    D -->|No| F[Dependency latency analysis]
    F --> G{Timeout signatures present?}
    G -->|Yes| H["Apply timeout/architecture mitigation"]
    G -->|No| I[Check recent deployments]
1) Check Azure status and regional incidents
Rule out platform-wide latency degradation.
Check in Portal
Azure portal → Service Health → Health advisories.
Filter for the production region and services: Azure Functions, Storage, Azure Monitor.
Check with Azure CLI
az account set --subscription "$SUBSCRIPTION_ID"
az rest --method get \
  --url "https://management.azure.com/subscriptions/$SUBSCRIPTION_ID/providers/Microsoft.ResourceHealth/events?api-version=2022-10-01&\$filter=eventType eq 'ServiceIssue' and status eq 'Active'"
| CLI element | Explanation |
|---|---|
| Command(s) | az account set, az rest |
| Key flags | --subscription, --method, --url |
| Variables | $SUBSCRIPTION_ID, $filter |
| Expected result | Azure CLI applies the configuration change; confirm the returned JSON or follow-up query shows the expected value. |
How to Read This
| Signal | Interpretation | Action |
|---|---|---|
| No active service issues | Latency is app or dependency-level | Continue to Step 2 |
| Active incident on Storage or Networking | Platform dependency degraded | Monitor advisory, apply mitigations |
2) Check function execution latency trend
Determine whether latency is broad or isolated to specific functions.
Check with KQL
let appName = "func-myapp-prod";
requests
| where timestamp > ago(1h)
| where cloud_RoleName =~ appName
| where operation_Name startswith "Functions."
| summarize
    P50Ms = percentile(duration, 50),
    P95Ms = percentile(duration, 95),
    P99Ms = percentile(duration, 99),
    Invocations = count()
  by FunctionName = operation_Name, bin(timestamp, 5m)
| order by timestamp desc
Example Output
FunctionName              timestamp               P50Ms    P95Ms    P99Ms    Invocations
------------------------  ----------------------  -------  -------  -------  -----------
Functions.HttpTrigger     2026-04-04T11:30:00Z    120      450      890      85
Functions.HttpTrigger     2026-04-04T11:25:00Z    115      420      850      92
Functions.QueueProcessor  2026-04-04T11:30:00Z    45       180      350      210
Functions.ExternalDep     2026-04-04T11:30:00Z    2100     8500     12000    30
How to Read This
| Pattern | Interpretation | Action |
|---|---|---|
| One function slow, others normal | Function-specific issue (dependency or code) | Focus on that function's dependencies |
| All functions slow | Platform or shared dependency issue | Check cold starts and storage health |
| P95 >> P50 | Tail latency — likely cold starts or intermittent dependency | Check cold start frequency |
| Latency rising over time bins | Progressive degradation | Check memory and dependency trends |
3) Check cold start impact
Cold starts are the most common cause of tail latency in Azure Functions.
Check with KQL
let appName = "func-myapp-prod";
traces
| where timestamp > ago(1h)
| where cloud_RoleName =~ appName
| where message has "Host started"
| summarize StartupCount = count() by bin(timestamp, 5m)
| join kind=leftouter (
    requests
    | where timestamp > ago(1h)
    | where cloud_RoleName =~ appName
    | summarize P95Ms = percentile(duration, 95) by bin(timestamp, 5m)
) on timestamp
| order by timestamp desc
How to Read This
| Pattern | Interpretation | Action |
|---|---|---|
| Startup count high + P95 elevated | Cold starts driving tail latency | Pre-warm instances or upgrade plan |
| Startup count normal + P95 elevated | Not cold start related | Check dependencies |
| FC1 with many startups + low latency | Normal Flex Consumption scaling | No action needed |
Plan-specific cold start behavior
- Consumption (Y1): Cold starts after idle periods are expected, and first-hit latency is commonly in the seconds range.
- Flex Consumption (FC1): Cold-start impact is generally reduced versus Y1, but startup-related tail latency can still appear under bursts.
- Premium (EP): Always-ready/prewarmed capacity reduces cold-start risk. If cold starts appear, review always-ready and prewarmed instance configuration.
- Dedicated: No cold starts unless app restarts.
4) Check dependency latency
Dependency bottlenecks are the second most common cause of function latency.
Check with KQL
let appName = "func-myapp-prod";
dependencies
| where timestamp > ago(1h)
| where cloud_RoleName =~ appName
| summarize
    P95Ms = percentile(duration, 95),
    FailureRate = round(100.0 * countif(success == false) / count(), 2),
    Calls = count()
  by target, type
| order by P95Ms desc
Example Output
target                  type     P95Ms    FailureRate  Calls
----------------------  -------  -------  -----------  -----
api.partner.internal    HTTP     8500     2.40         120
stmyappprod.blob.core   Azure    45       0.00         890
stmyappprod.queue.core  Azure    12       0.00         1240
How to Read This
| Pattern | Interpretation | Action |
|---|---|---|
| One dependency P95 >> others | That dependency is the bottleneck | Investigate downstream service |
| Storage dependency slow | Storage account may be throttled | Check storage metrics and region |
| All dependencies slow | Network-level issue | Check VNet, DNS, private endpoint |
5) Check for timeout errors
Azure Functions have hard execution timeouts that vary by plan.
Timeout limits by plan
| Plan | Default Timeout | Maximum Timeout |
|---|---|---|
| Consumption (Y1) | 5 minutes | 10 minutes |
| Flex Consumption (FC1) | 30 minutes | Up to 4 hours |
| Premium (EP) | 30 minutes | Unlimited |
| Dedicated | 30 minutes | Unlimited |
Check with KQL
let appName = "func-myapp-prod";
traces
| where timestamp > ago(1h)
| where cloud_RoleName =~ appName
| where message has_any ("timeout", "exceeded", "Timeout value of", "cancellation", "Task was cancelled")
| project timestamp, severityLevel, message
| order by timestamp desc
How to Read This
| Signal | Interpretation | Action |
|---|---|---|
Timeout value of 00:05:00 exceeded | Consumption plan timeout hit | Reduce execution time or upgrade plan |
Task was cancelled | CancellationToken triggered | Check if function handles graceful shutdown |
| No timeout messages | Latency is not from timeouts | Focus on dependency and cold start causes |
HTTP trigger 230-second limit
HTTP-triggered functions have an additional 230-second timeout imposed by the Azure load balancer, regardless of the functionTimeout setting in host.json. For long-running HTTP work, use the Durable Functions async HTTP pattern.
6) Check recent deployments
az monitor activity-log list \
  --resource-group "$RG" \
  --offset 2h \
  --status Succeeded \
  --output table
| CLI element | Explanation |
|---|---|
| Command(s) | az monitor activity-log list |
| Key flags | --resource-group, --offset, --status, --output |
| Variables | $RG |
| Expected result | Azure CLI returns the requested resource data; verify names, IDs, status fields, or metric values match the scenario. |
Correlate deployment timestamps with latency onset.
Fast routing after triage
| What you see | Likely area | Next action |
|---|---|---|
| Cold starts driving P95 | Scaling/plan | Use Cold Start lab guide |
| Single dependency bottleneck | Downstream service | Investigate target service health |
| Timeout errors in logs | Execution limits | Use Timeout / Execution Limit playbook |
| All functions slow after deploy | Regression | Roll back, then follow Methodology |
| Memory pressure signals | Resource exhaustion | Use Out of Memory playbook |