Monitoring
This guide describes how to monitor Azure Functions in production using Azure Monitor and Application Insights. It combines metrics, logs, traces, and dashboards into a practical operational workflow.
Platform Guide
For scaling architecture and plan comparison, see Scaling.
Language Guide
For Python deployment specifics, see the Python Tutorial.
Prerequisites
- A running Function App in Consumption, Flex Consumption, Premium, or Dedicated.
- An Application Insights resource connected to the app.
- Access to Azure Monitor metrics and Log Analytics query permissions.
- Azure CLI installed and authenticated.
- Resource placeholders ready for commands.
| Command/Parameter | Purpose |
|---|---|
RG | Sets the resource group name variable |
APP_NAME | Sets the function app name variable |
SUBSCRIPTION_ID | Sets the Azure subscription identifier variable |
When to Use
Use the signal that best answers the operational question.
| Scenario | Primary approach | Why | Secondary approach |
|---|---|---|---|
| Traffic increase/decrease | Metrics | Fast trend view with low query cost | Logs |
| Error spike after deployment | Logs (requests, exceptions) | Rich failure context | Traces |
| Latency regression | Metrics + KQL percentile | Quantify p95/p99 drift | Live Metrics |
| External dependency incident | Dependencies | Clear target/result visibility | Exceptions |
| Host recycle/cold start analysis | Traces | Runtime lifecycle evidence | Instance metrics |
| Configuration change impact | Activity logs | Control-plane history | Logs + traces |
Application Insights Blade
[Observed] The Application Insights blade shows the linked Application Insights resource with a View Application Insights data link for full telemetry access. The Change your resource section allows switching or disconnecting the monitoring resource:
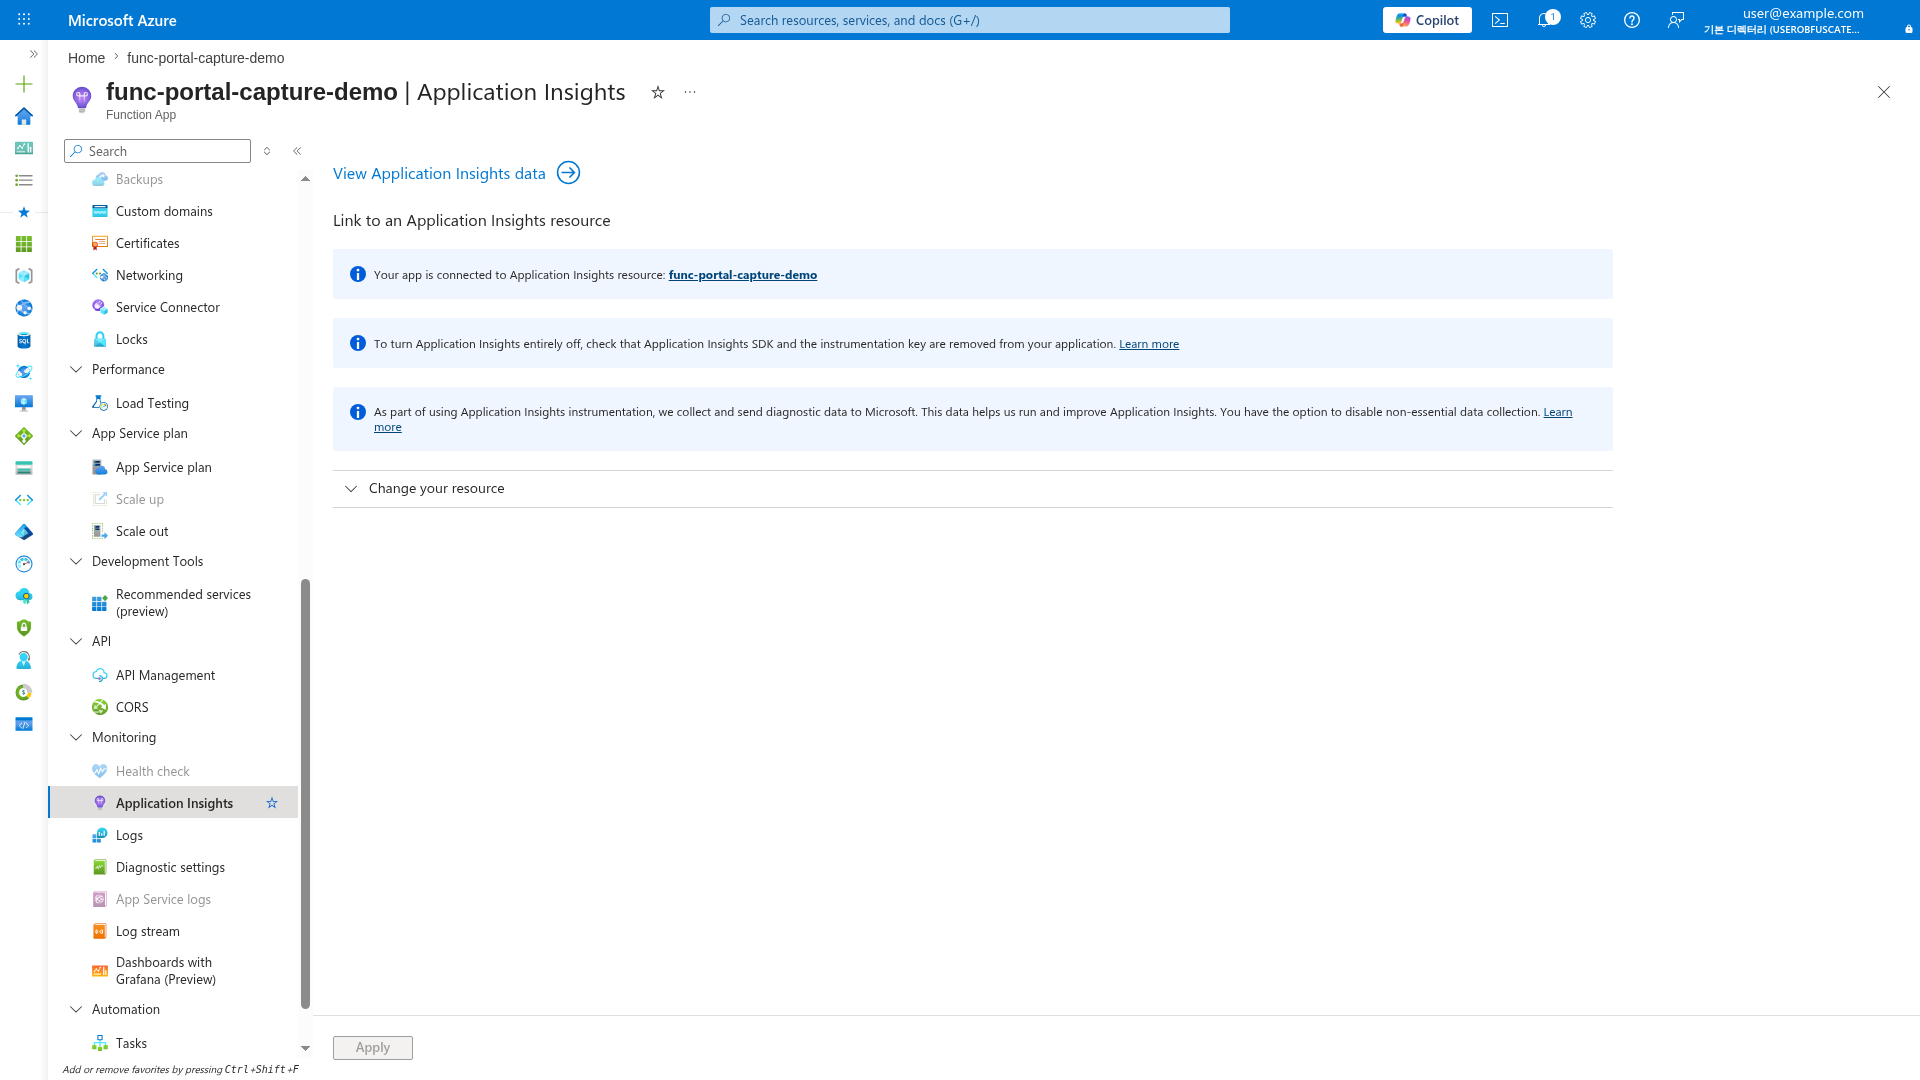
[Inferred] Verify the Application Insights link is active before troubleshooting telemetry gaps. If no resource is linked, function execution data will not appear in Application Insights queries.
Logs (Log Analytics) Blade
[Observed] The Logs blade opens the KQL query editor with a New Query tab, table selector, and time range filter. The Queries hub provides pre-built query templates:
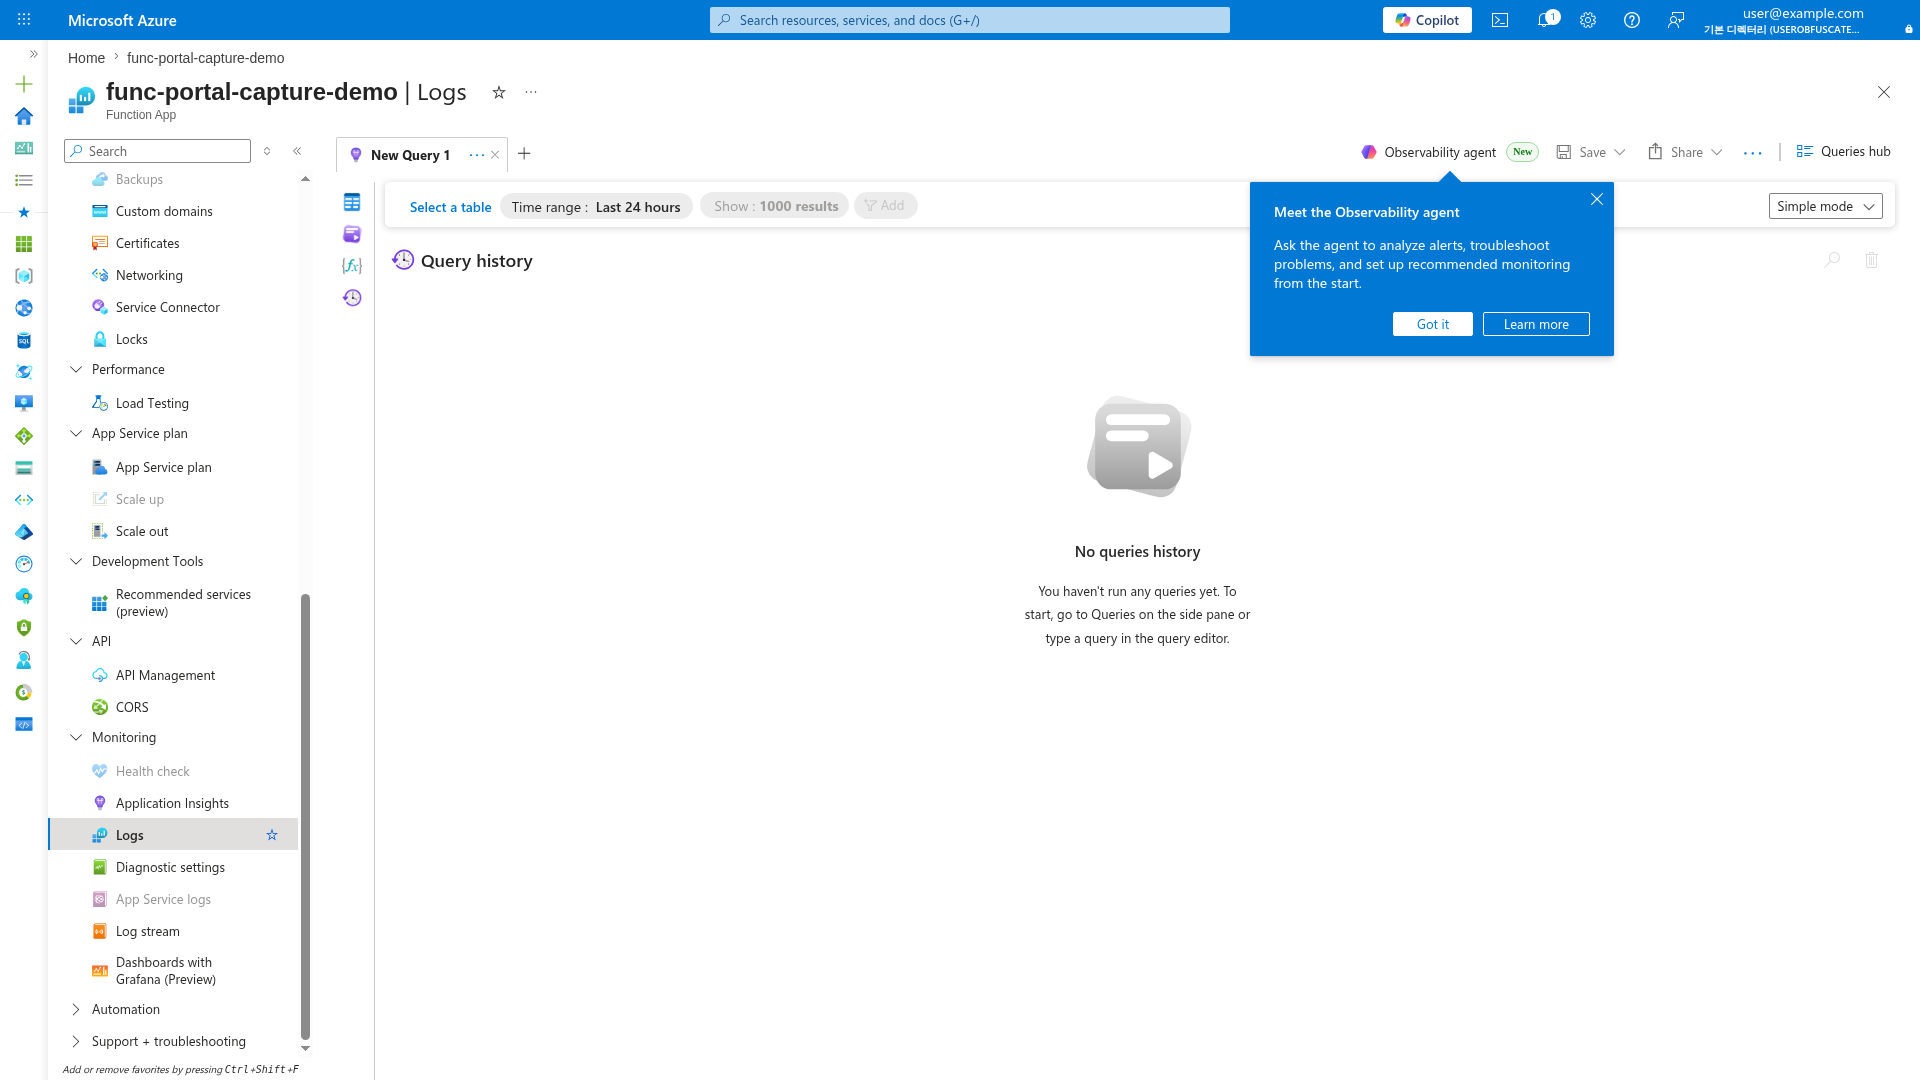
[Inferred] Use this blade to run KQL queries directly against Function App logs. Select tables like FunctionAppLogs, requests, traces, and exceptions for troubleshooting. The time range filter defaults to 24 hours.
Diagnostic Settings Blade
[Observed] The Diagnostic settings blade shows available log categories for streaming export: Function Application Logs, Access Audit Logs, IPSecurity Audit logs, App Service Authentication logs, and AllMetrics. No diagnostic settings are configured:
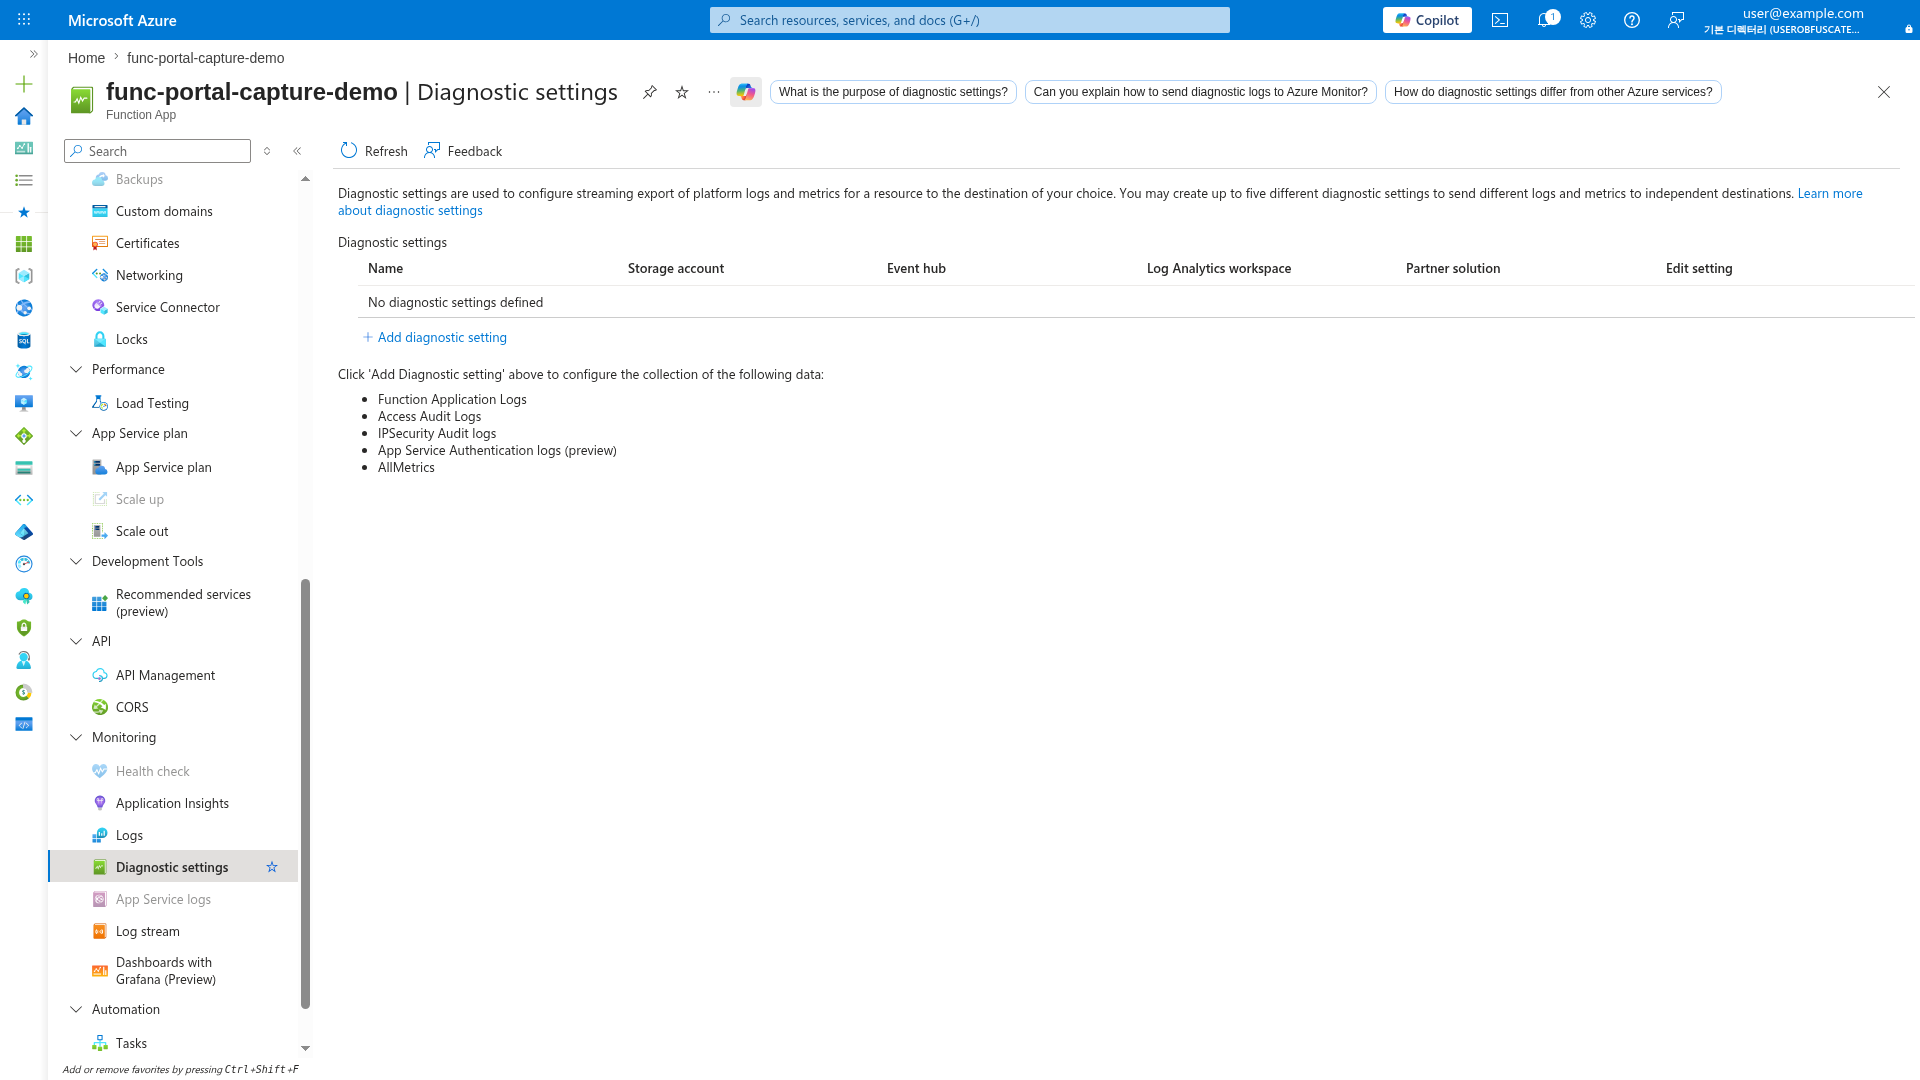
[Inferred] Configure diagnostic settings to stream platform logs to Log Analytics, Storage Account, or Event Hub for long-term retention and compliance. Without diagnostic settings, platform-level logs (not Application Insights telemetry) are not persisted.
Procedure
Monitoring architecture
Azure Functions emits multiple telemetry streams:
- Platform metrics in Azure Monitor (execution count, failures, instance activity).
- Application telemetry in Application Insights (requests, dependencies, traces, exceptions).
- Activity logs for control-plane changes.
Use all three for complete operational visibility.
flowchart TD
    A[Function App Runtime] --> B[Azure Monitor Metrics]
    A --> C[Application Insights]
    A --> D[Activity Log]
    B --> E[Metric Alerts]
    C --> F["KQL / Log Analytics"]
    C --> G[Workbooks]
    F --> H[Log Alerts]
    E --> I[Action Group]
    H --> I
Enable Application Insights
Set the connection string in app settings:
az functionapp config appsettings set \
    --resource-group <resource-group> \
    --name <app-name> \
    --settings APPLICATIONINSIGHTS_CONNECTION_STRING="InstrumentationKey=<masked>;IngestionEndpoint=https://<region>.in.applicationinsights.azure.com/"
| Command/Parameter | Purpose |
|---|---|
az functionapp config appsettings set | Configures the Application Insights connection string |
--resource-group <resource-group> | Specifies the resource group |
--name <app-name> | Specifies the function app name |
--settings | Sets the connection string to route telemetry to the correct resource |
Prefer connection strings over legacy instrumentation-key-only configuration.
Core metrics to track
Track a small set of high-signal metrics first:
| Signal | Why it matters |
|---|---|
| Execution count | Detect traffic shifts and workload volume |
| Execution duration | Detect latency regressions and cold start symptoms |
| Failure count/rate | Detect runtime and dependency instability |
| Instance count | Observe scale behavior per plan |
| Queue or backlog depth | Detect processing lag in event-driven flows |
Backlog metrics
Queue-length and lag metrics usually come from the messaging service (for example, Storage Queue or Service Bus), not only from the Function App resource.
Query metrics with Azure CLI:
APP_ID=$(az functionapp show \
    --resource-group "$RG" \
    --name "$APP_NAME" \
    --query id \
    --output tsv)

az monitor metrics list \
    --resource "$APP_ID" \
    --metric "Function Execution Count" "Function Execution Units" \
    --interval PT5M \
    --aggregation Total Average \
    --start-time 2026-04-05T00:00:00Z \
    --end-time 2026-04-05T01:00:00Z \
    --output table
| Command/Parameter | Purpose |
|---|---|
az functionapp show | Gets the resource ID of the function app |
az monitor metrics list | Retrieves numerical platform metrics |
--resource "$APP_ID" | Target resource for metric retrieval |
--metric | List of metrics to query (execution count and units) |
--interval PT5M | Aggregates data into 5-minute time grains |
--aggregation Total Average | Specified aggregation types to return |
--start-time / --end-time | ISO 8601 timestamps for the query window |
--output table | Formats the metrics as a table |
Sample output (PII masked):
Cost    Interval    Metric                    TimeStamp                   Total    Average
0       PT5M        Function Execution Count  2026-04-05T00:00:00Z       184      6.13
0       PT5M        Function Execution Units  2026-04-05T00:00:00Z       42       1.40
Live Metrics stream
Use Live Metrics during deployments and incidents for near real-time visibility:
- Open Application Insights.
- Select Live Metrics.
- Watch request rate, failures, and server response time during rollout.
This is especially useful during slot swaps and traffic ramp-up windows.
Log Analytics and KQL basics
Application Insights data is queryable with KQL.
Recent failed invocations
requests
| where timestamp > ago(1h)
| where success == false
| project timestamp, name, resultCode, duration, operation_Id
| order by timestamp desc
Slow operations over time
requests
| where timestamp > ago(24h)
| summarize p95_duration=percentile(duration, 95), avg_duration=avg(duration) by bin(timestamp, 5m)
| render timechart
Exceptions by type
exceptions
| where timestamp > ago(7d)
| summarize failures=count() by type, outerMessage
| order by failures desc
End-to-end correlation
union requests, dependencies, traces, exceptions
| where operation_Id == "<operation-id>"
| project timestamp, itemType, name, message, resultCode, duration
| order by timestamp asc
Host startup events
traces
| where timestamp > ago(24h)
| where message has_any ("Host started", "Host initialized", "Stopping JobHost")
| project timestamp, severityLevel, cloud_RoleName, message
| order by timestamp desc
Dependency health by target
dependencies
| where timestamp > ago(6h)
| summarize total_calls=count(), failed_calls=countif(success == false), p95_duration=percentile(duration, 95) by target, type
| extend failure_rate = toreal(failed_calls) / iif(total_calls == 0, 1.0, toreal(total_calls))
| order by failure_rate desc, failed_calls desc
Dashboards and workbooks
Build a workbook that answers these operational questions:
- Is availability stable?
- Are failures isolated to a function, dependency, or region?
- Did a deployment change latency or error distribution?
- Is queue backlog growing faster than throughput?
Recommended workbook visuals:
- Timechart of request count and failure rate.
- P95/P99 duration trend by function name.
- Exceptions by type and operation.
- Dependency failure trend for external calls.
- Queue depth trend alongside execution rate.
Sampling and data volume control
Adjust Application Insights sampling in host.json when telemetry volume grows.
{
  "version": "2.0",
  "logging": {
    "applicationInsights": {
      "samplingSettings": {
        "isEnabled": true,
        "maxTelemetryItemsPerSecond": 5,
        "excludedTypes": "Request;Exception"
      }
    }
  }
}
Keep request and exception data unsampled for reliable incident triage.
Operational monitoring decision flow
flowchart TD
    A[Alert or Incident] --> B{"Availability/latency issue?"}
    B -- Yes --> C[Check metrics first]
    B -- No --> D[Check logs and traces]
    C --> E{Anomaly detected?}
    E -- Yes --> F[Run focused KQL]
    E -- No --> G[Review Activity Log]
    D --> H{Error signature found?}
    H -- Yes --> I[Correlate by operation_Id]
    H -- No --> J[Use Live Metrics and widen time range]
    F --> K[Mitigate and tune alerts]
    G --> K
    I --> K
    J --> K
Operational monitoring routine
Daily:
- Check failure trend and top exception signatures.
- Verify queue backlog and processing lag.
Per deployment:
- Monitor Live Metrics during release window.
- Compare before/after latency and failure ratio.
Weekly:
- Review dashboard trends and adjust alert sensitivity.
- Validate telemetry cost and sampling strategy.
Portal Walkthrough
This section shows the key Azure Portal blades for monitoring a Function App. All captures are from a live Consumption (Y1) deployment with PII masked per AGENTS.md rules.
Metrics Explorer
[Observed] The Metrics blade provides a chart builder for Azure Monitor platform metrics. Select metrics such as Function Execution Count, Function Execution Units, or Http5xx to visualize trends. The time range selector in the top-right corner defaults to Last 24 hours (Automatic):
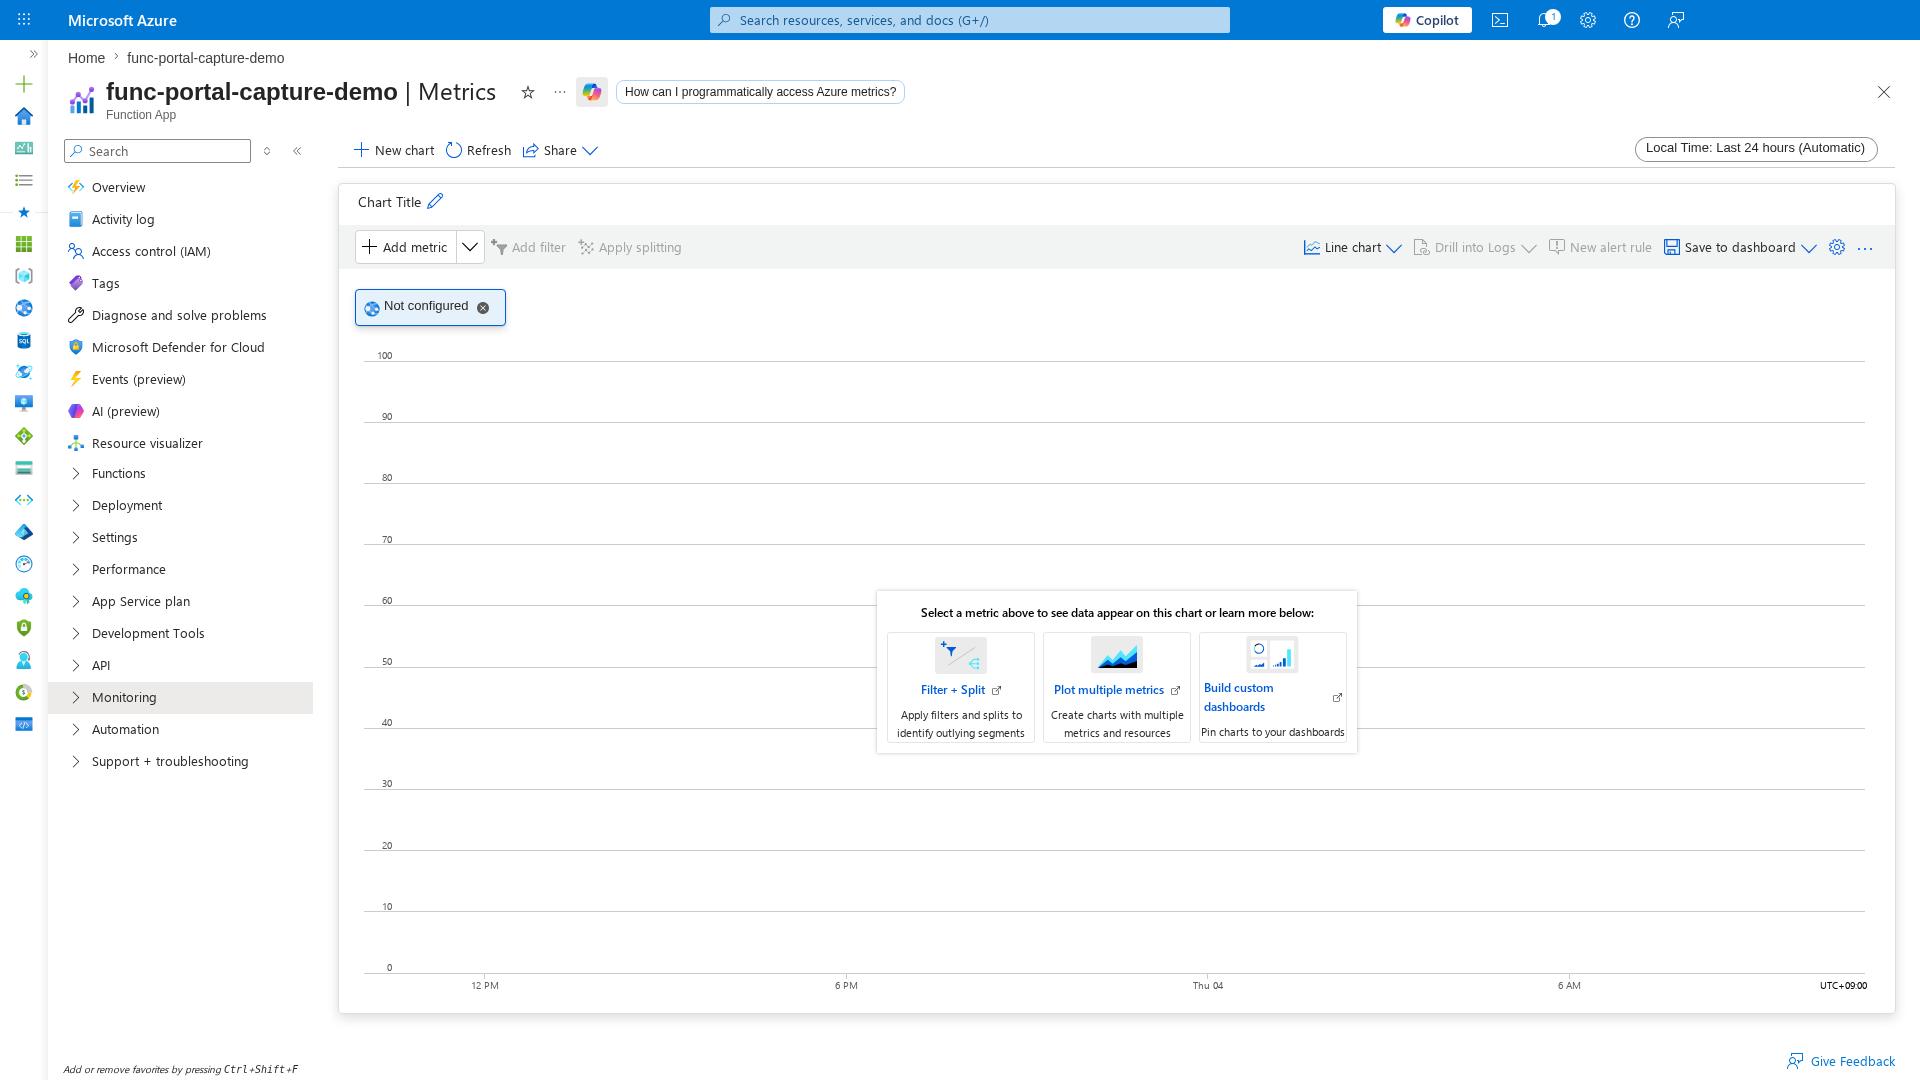
[Inferred] If the chart shows "Not configured", no metric has been selected yet. Click Add metric to begin building the chart. For incident triage, start with Function Execution Count and Http5xx in separate charts.
Log Stream
[Observed] The Log stream blade shows real-time stdout/stderr output from the Function App host. When connected, the status bar reads Connected! and new log lines appear as they are emitted:
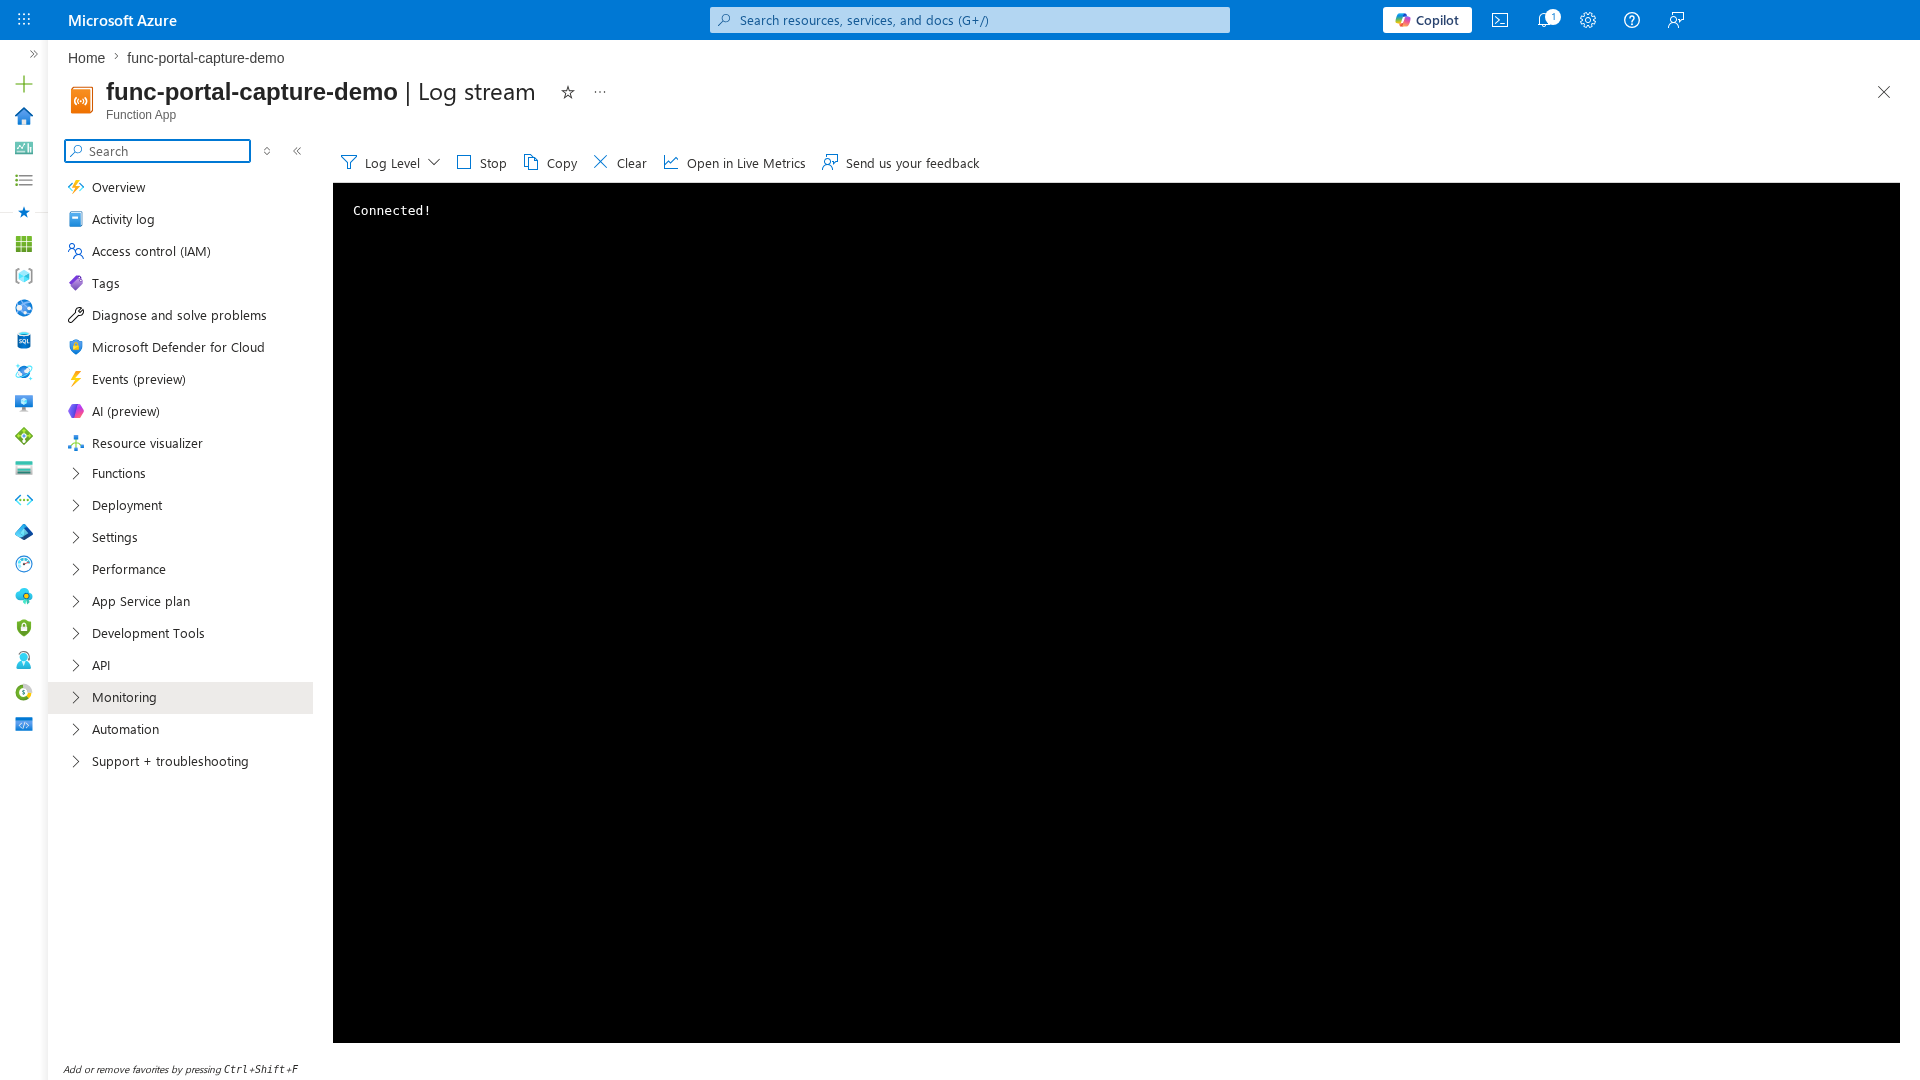
[Inferred] Log stream is useful during deployments and incident triage to confirm the host is running and processing requests. If the stream shows no output, check that the app is not scaled to zero (Consumption plan) or that logging is not disabled in host.json.
Diagnose and Solve Problems
[Observed] The Diagnose and solve problems blade provides built-in troubleshooting categories: Availability and Performance, Configuration and Management, Deployment, Networking, and Diagnostic Tools. A Risk alerts section surfaces active warnings (e.g., "Availability: 1 Warning"):
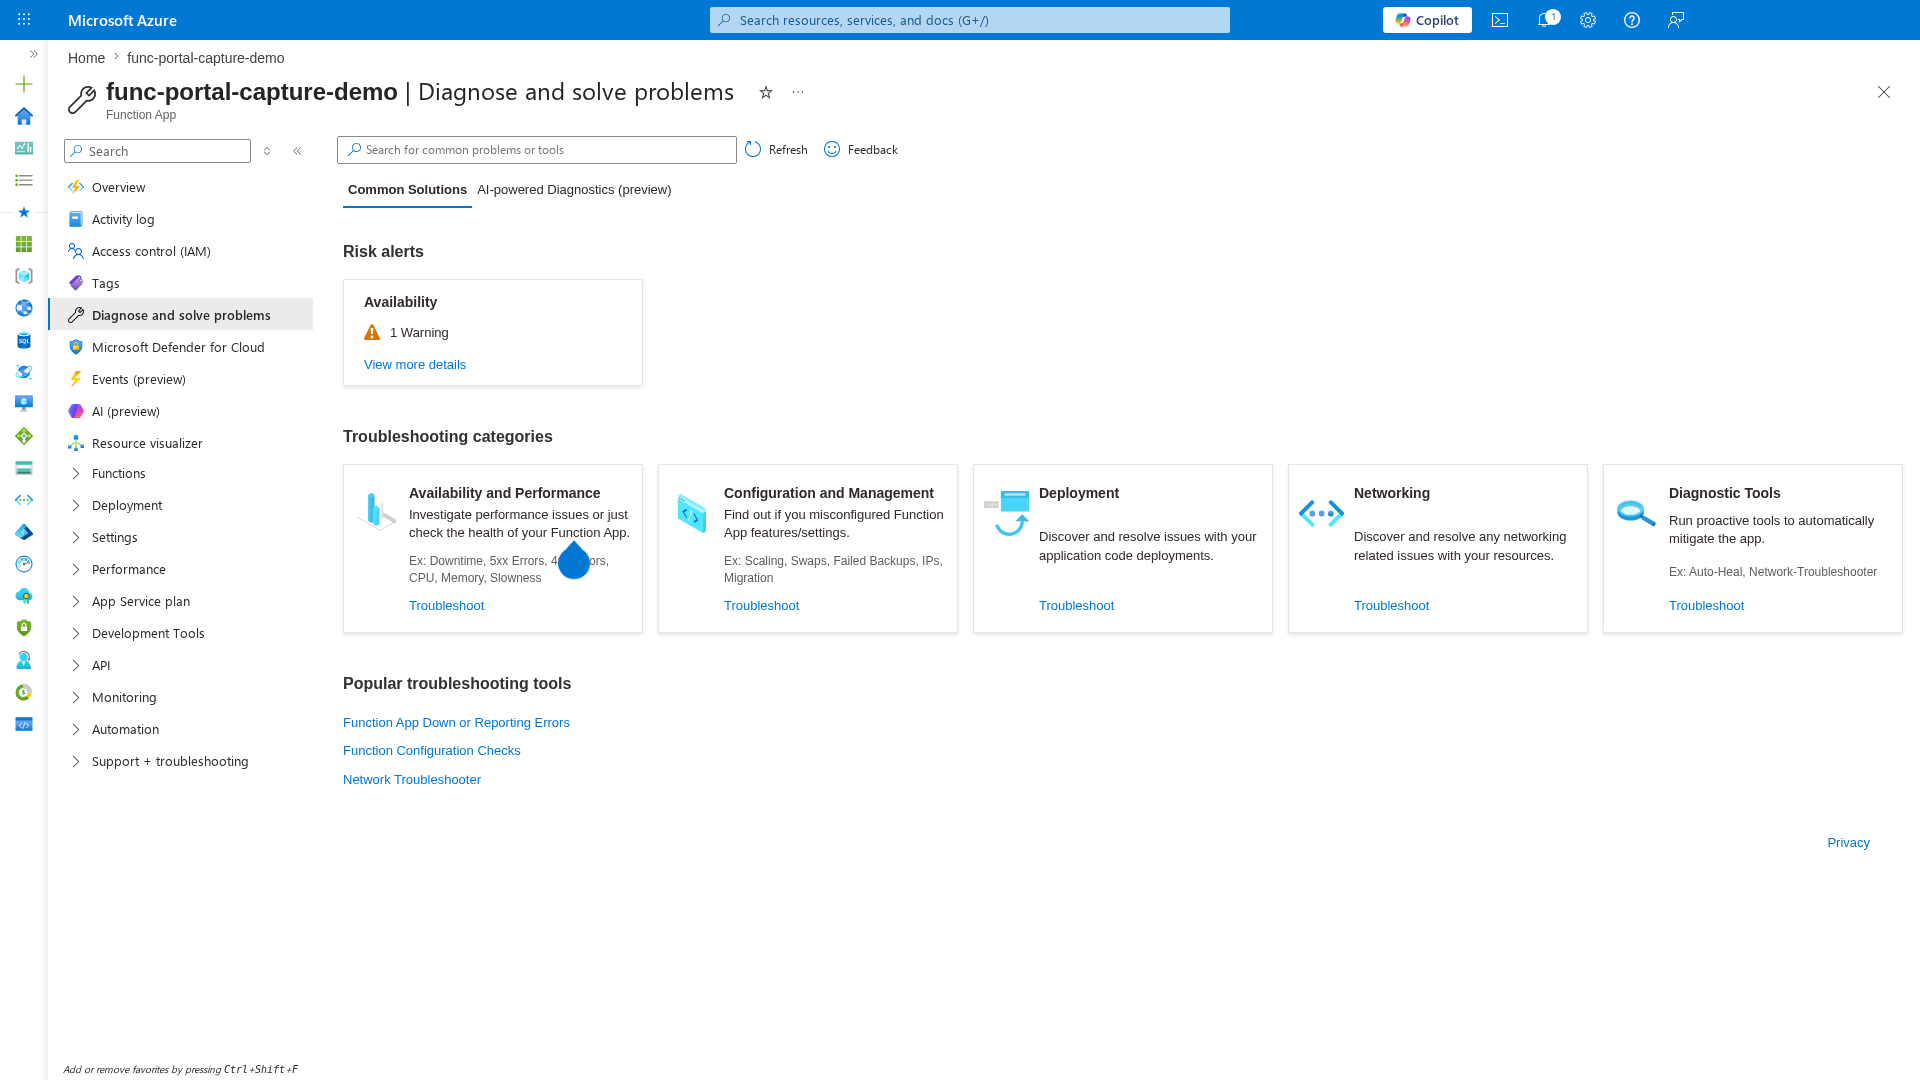
[Inferred] This blade is the Portal equivalent of the hypothesis-driven playbooks in this guide. Use it as a starting point when you do not yet know the failure category.
Verification
Validate that monitoring is working end-to-end after changes.
- Trigger at least one function invocation.
- Confirm metrics appear in 5-minute bins.
- Confirm logs and traces are queryable.
- Confirm workbook visuals show data.
- Confirm alert rules evaluate without data-source errors.
Metric verification command:
az monitor metrics list \
    --resource "$APP_ID" \
    --metric "Function Execution Count" \
    --interval PT5M \
    --aggregation Total \
    --start-time 2026-04-05T00:00:00Z \
    --end-time 2026-04-05T00:30:00Z \
    --query "value[0].timeseries[0].data[?total > \`0\`].[timeStamp,total]" \
    --output table
| Command/Parameter | Purpose |
|---|---|
az monitor metrics list | Queries the specified metric |
--metric "Function Execution Count" | Tracks how many times functions were invoked |
--query | JMESPath filter to only show intervals where total executions are greater than zero |
--output table | Formats results as a table |
Log verification command:
requests
| where timestamp > ago(15m)
| summarize total_requests=count(), failed_requests=countif(success == false)
Expected result: total_requests is greater than 0, metric timestamps align with test traffic, and dependency calls appear in dependencies for external calls.
Rollback / Troubleshooting
Missing telemetry in Application Insights
- Metrics appear but
requeststable is empty. -
Live Metrics stream has no flow.
-
Verify
APPLICATIONINSIGHTS_CONNECTION_STRINGexists. - Verify endpoint/region value is correct.
- Restart Function App after config changes.
- Validate egress/network rules for telemetry ingestion.
az functionapp config appsettings list \
    --resource-group "$RG" \
    --name "$APP_NAME" \
    --query "[?name=='APPLICATIONINSIGHTS_CONNECTION_STRING'].value" \
    --output tsv
| Command/Parameter | Purpose |
|---|---|
az functionapp config appsettings list | Lists application settings |
--query | Extracts the value of the Application Insights connection string |
--output tsv | Returns the raw string value |
Sampling too aggressive
- Log request counts are much lower than platform metrics.
-
Exception evidence is sparse during incidents.
-
Inspect
host.jsonsampling settings. - Exclude
Request;Exceptionfrom sampling. - Increase
maxTelemetryItemsPerSecondtemporarily for investigations.
Rollback:
- Revert to last known-good sampling settings.
- Redeploy and re-run verification queries.
Common blind spots
- Monitoring only HTTP success and ignoring non-HTTP triggers.
- Missing downstream dependency metrics.
- Over-sampling that removes needed forensic signals.
- No version marker in logs, making release impact hard to isolate.