Quick Diagnosis Cards
One-page reference cards for rapid incident triage. Each card maps: Symptom → First Query → Platform Segment → Playbook.
Use these when you have 60 seconds to identify the failure category.
Card 1: App Returns 503 After Deployment
graph TD
    A[503 after deploy] --> B[First Query]
    B --> C[Platform Segment]
C --> D[Playbook]| Step | Action |
|---|---|
| Symptom | All requests return 503 immediately after deployment or restart |
| First Query | AppServiceConsoleLogs \| where TimeGenerated > ago(15m) \| where ResultDescription has_any ("failed", "error", "exception", "listening") \| take 50 |
| What to Look For | Missing startup logs = startup command issue. Listening at 127.0.0.1 = wrong bind. Traceback = app crash. |
| Platform Segment | Startup / Availability |
| Playbook | Deployment Succeeded but Startup Failed |
Quick CLI Check:
Card 2: Intermittent 5xx Under Load
| Step | Action |
|---|---|
| Symptom | 5xx errors appear during traffic spikes, recover when load drops |
| First Query | AppServiceHTTPLogs \| where TimeGenerated > ago(1h) \| summarize total=count(), err5xx=countif(ScStatus >= 500) by bin(TimeGenerated, 5m) \| order by TimeGenerated asc |
| What to Look For | 5xx spikes correlating with request volume. High TimeTaken on failed requests. |
| Platform Segment | Performance |
| Playbook | Intermittent 5xx Under Load |
Quick CLI Check:
az monitor metrics list --resource <app-resource-id> --metric "Http5xx,Requests,CpuPercentage" --interval PT1M
Card 3: Outbound Connection Timeouts
| Step | Action |
|---|---|
| Symptom | Requests to external APIs/databases time out intermittently |
| First Query | AppServiceConsoleLogs \| where TimeGenerated > ago(1h) \| where ResultDescription has_any ("connect timed out", "ReadTimeout", "ConnectTimeout", "ECONNRESET") \| summarize count() by bin(TimeGenerated, 5m) |
| What to Look For | Connection errors increasing over time. Correlation with high outbound request volume. |
| Platform Segment | Outbound / Network |
| Playbook | SNAT or Application Issue |
Quick CLI Check (Linux):
# Check for connection patterns in logs
az webapp log tail --resource-group <resource-group> --name <app-name> | grep -i "timeout\|reset\|refused"
Card 4: DNS Resolution Failures (VNet)
| Step | Action |
|---|---|
| Symptom | App cannot resolve private endpoint FQDNs or custom DNS names |
| First Query | AppServiceConsoleLogs \| where TimeGenerated > ago(1h) \| where ResultDescription has_any ("Name or service not known", "getaddrinfo", "DNS", "NXDOMAIN") \| take 50 |
| What to Look For | Resolution failures for *.privatelink.* domains. Public IP returned instead of private. |
| Platform Segment | Outbound / Network |
| Playbook | DNS Resolution VNet-Integrated |
Quick SSH Check (Linux):
# SSH into container and test resolution
az webapp ssh --resource-group <resource-group> --name <app-name>
# Then run: nslookup <private-endpoint-fqdn>
Card 5: Slow First Request (Cold Start)
| Step | Action |
|---|---|
| Symptom | First request after deploy or idle period takes 10-60+ seconds |
| First Query | AppServiceHTTPLogs \| where TimeGenerated > ago(1h) \| where TimeTaken > 10000 \| project TimeGenerated, CsUriStem, TimeTaken, ScStatus \| order by TimeTaken desc |
| What to Look For | High TimeTaken on first requests only. Subsequent requests normal. |
| Platform Segment | Performance |
| Playbook | Slow Start / Cold Start |
Quick CLI Check (Linux):
# Stream logs to see startup sequence
az webapp log tail --resource-group <resource-group> --name <app-name>
Card 6: Memory Pressure / Worker Restarts
| Step | Action |
|---|---|
| Symptom | App becomes slow, then restarts. Pattern repeats. |
| First Query | AppServicePlatformLogs \| where TimeGenerated > ago(6h) \| where ResultDescription has_any ("OOM", "killed", "memory", "SIGKILL", "recycle") \| project TimeGenerated, ResultDescription |
| What to Look For | OOM kill messages. Restart timing correlating with memory growth. |
| Platform Segment | Performance |
| Playbook | Memory Pressure and Worker Degradation |
Quick CLI Check:
Card 7: Slot Swap Broke the App
| Step | Action |
|---|---|
| Symptom | App worked in staging slot, fails after swap to production |
| First Query | AppServicePlatformLogs \| where TimeGenerated > ago(6h) \| where ResultDescription has_any ("swap", "slot", "warm-up") \| project TimeGenerated, ResultDescription |
| What to Look For | Config values that should have stayed in production slot. Connection strings pointing to wrong environment. |
| Platform Segment | Startup / Availability |
| Playbook | Slot Swap Config Drift |
Quick CLI Check:
# Compare app settings between slots
az webapp config appsettings list --resource-group <resource-group> --name <app-name> --slot staging
az webapp config appsettings list --resource-group <resource-group> --name <app-name>
Card 8: Disk Full / No Space Left
| Step | Action |
|---|---|
| Symptom | Errors include "No space left on device" or ENOSPC |
| First Query | AppServiceConsoleLogs \| where TimeGenerated > ago(24h) \| where ResultDescription has_any ("No space left", "ENOSPC", "disk full") \| take 50 |
| What to Look For | Temp file accumulation. Log rotation not working. Large uploads filling /tmp. |
| Platform Segment | Performance |
| Playbook | No Space Left on Device |
Quick SSH Check (Linux):
# SSH into container
az webapp ssh --resource-group <resource-group> --name <app-name>
# Then run:
df -h
du -sh /tmp/* | sort -h | tail -20
Universal First 3 Queries
When you don't know where to start, run these three queries to establish baseline:
Portal view: Log Analytics editor where the three baseline queries run
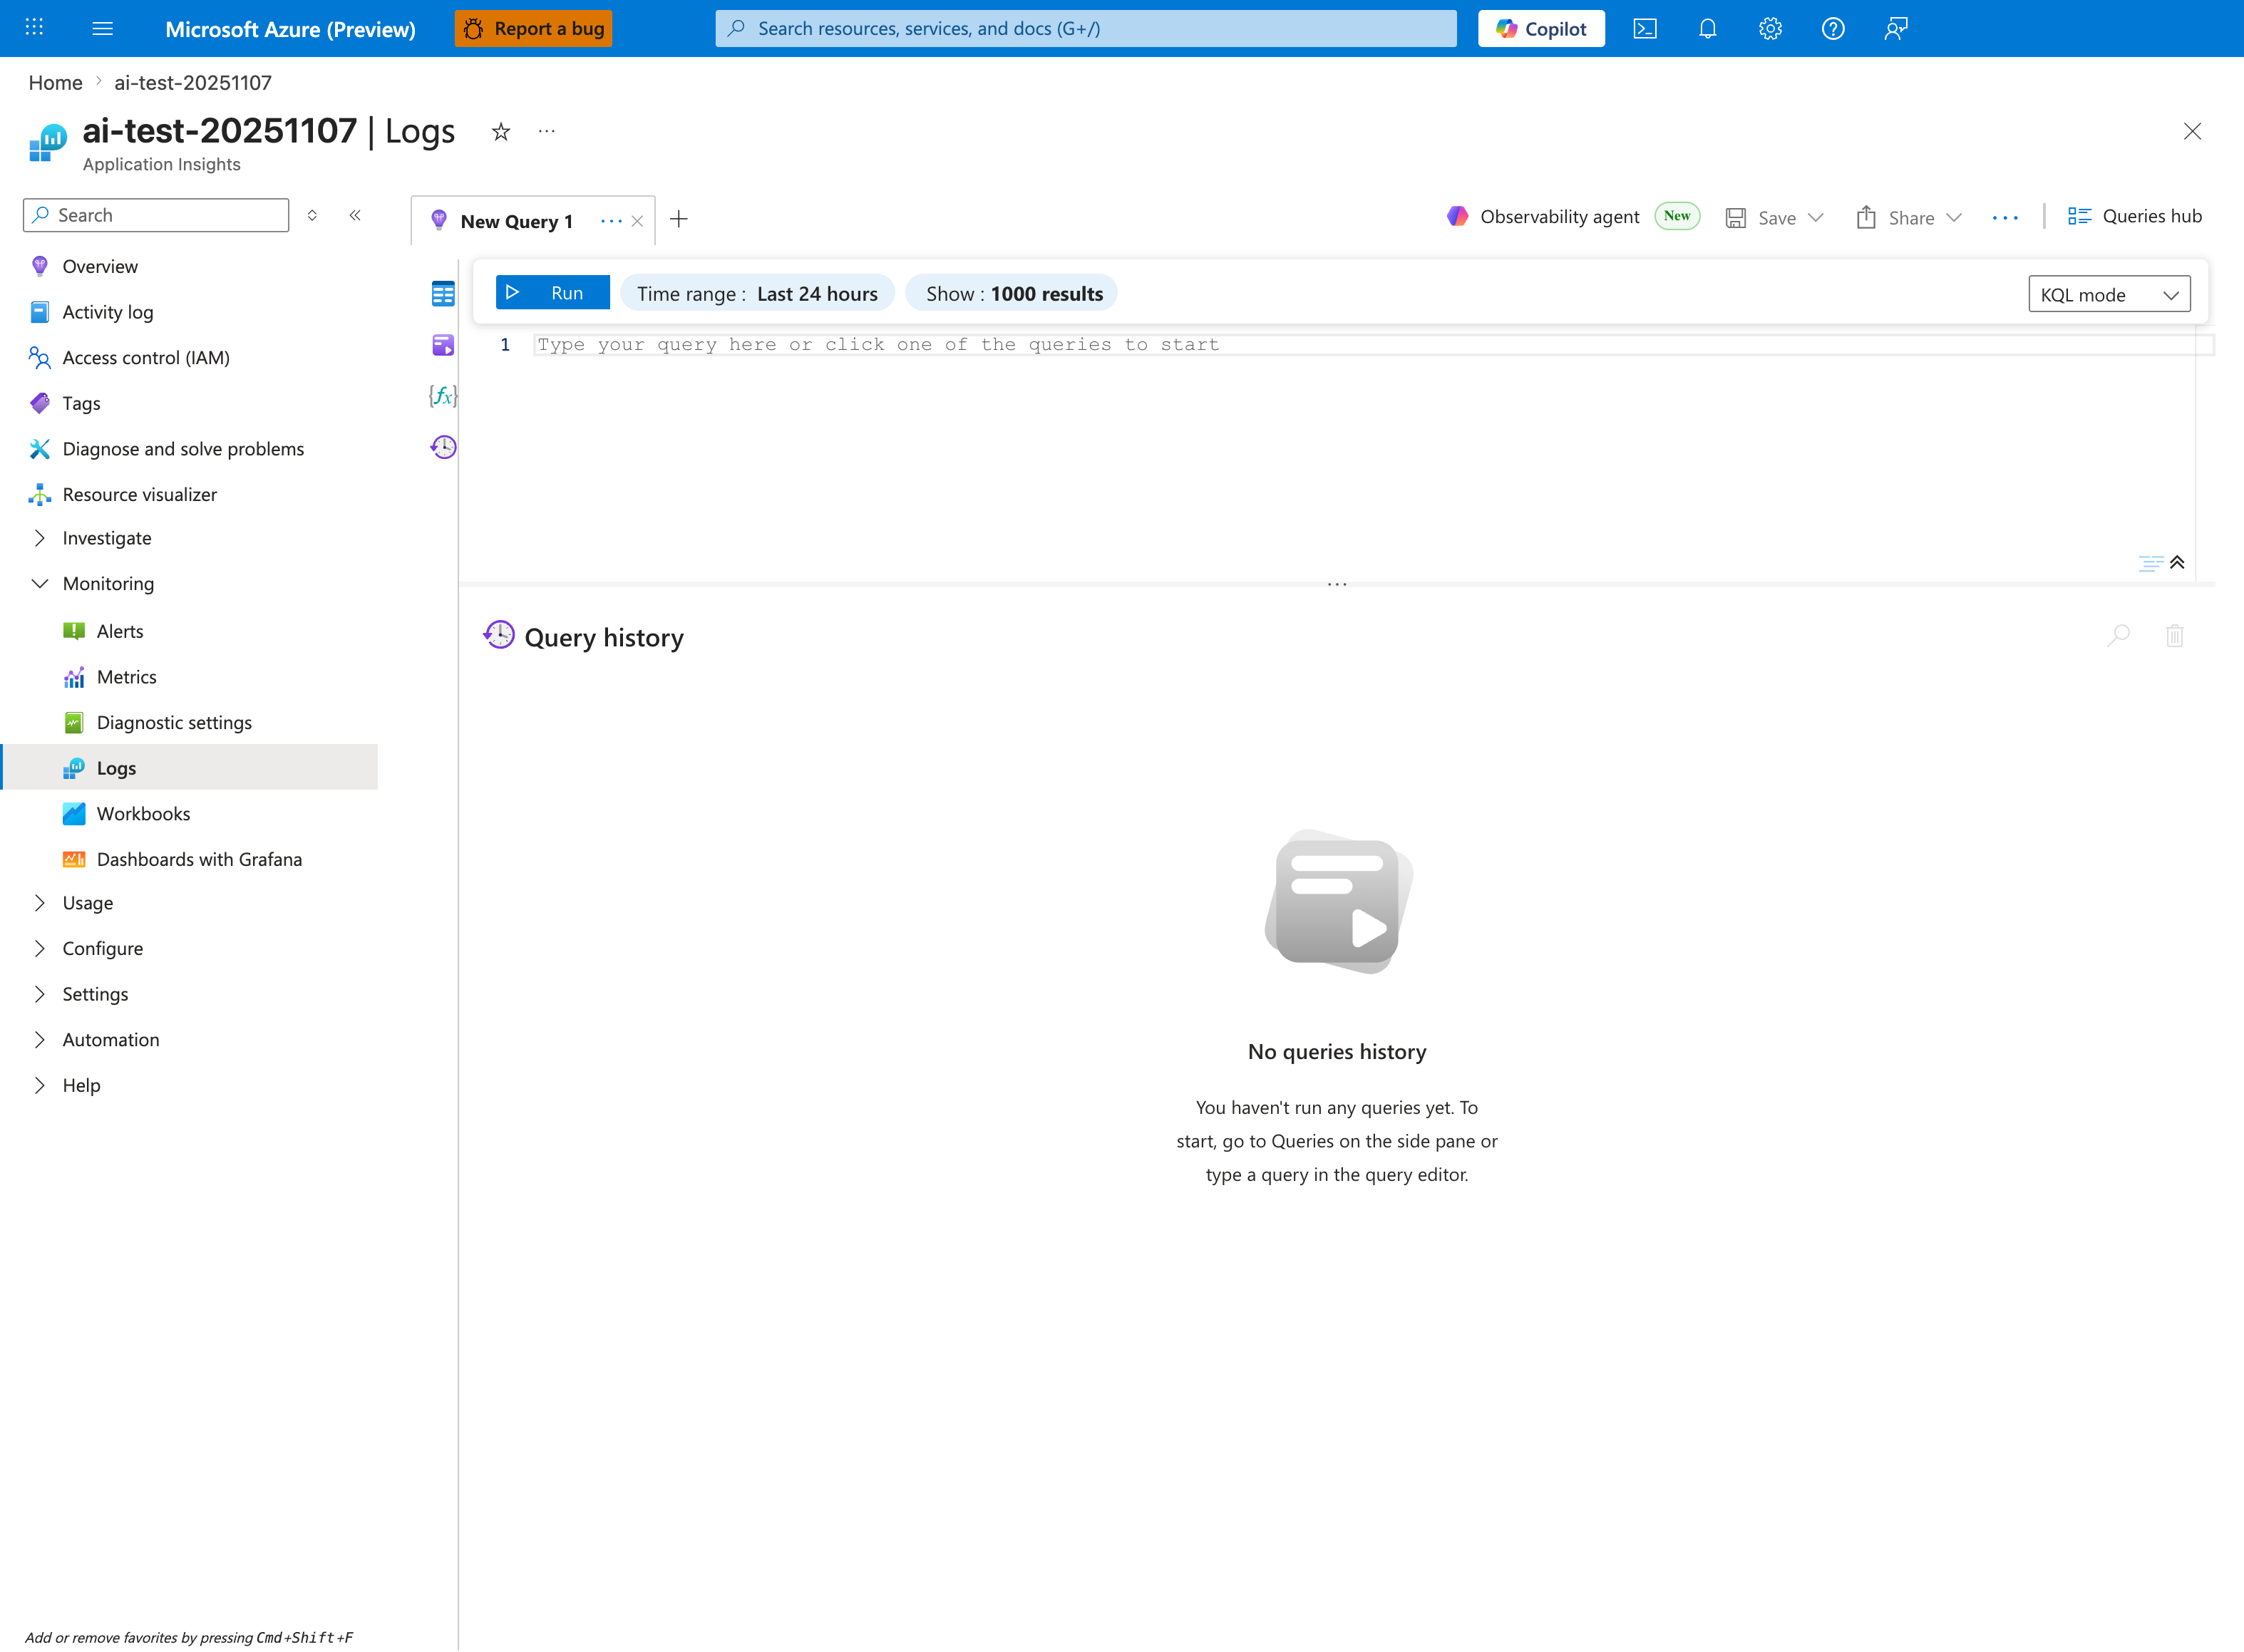
All three baseline queries below execute in this Application Insights Logs editor. Before pasting each query, adjust the blade-level Time range to match the query's ago(...) window — Query 1 uses 2 hours, Query 2 uses 24 hours, and Query 3 uses 6 hours. The Show: 1000 results cap matters when investigating high-volume incidents; for noisy queries you may need to increase it or refine the filter. Use the KQL mode dropdown — all queries below assume raw Kusto syntax. As you run each query, the Query history panel will populate; export the queries that produced actionable evidence into the incident ticket as your reproducibility artifact.
Query 1: HTTP Error Trend
AppServiceHTTPLogs
| where TimeGenerated > ago(2h)
| summarize total=count(), err5xx=countif(ScStatus >= 500), p95=percentile(TimeTaken, 95) by bin(TimeGenerated, 5m)
| order by TimeGenerated asc
Query 2: Platform Events
AppServicePlatformLogs
| where TimeGenerated > ago(24h)
| where ResultDescription has_any ("restart", "recycle", "health", "swap", "deploy", "container", "OOM", "killed")
| project TimeGenerated, OperationName, ResultDescription
| order by TimeGenerated desc
Query 3: Console Error Signatures
AppServiceConsoleLogs
| where TimeGenerated > ago(6h)
| where ResultDescription has_any ("timeout", "failed", "error", "exception", "could not", "DNS", "connect")
| project TimeGenerated, ResultDescription
| order by TimeGenerated desc
| take 100
Decision Matrix
| Observation | Most Likely Card | Confidence |
|---|---|---|
| 503 + no console output | Card 1 (Startup) | High |
| 5xx spikes with traffic | Card 2 (Load) | High |
| Outbound timeout errors | Card 3 (SNAT) | Medium-High |
| DNS resolution errors | Card 4 (VNet DNS) | High |
| First request slow, rest fast | Card 5 (Cold Start) | High |
| Gradual slowdown → restart | Card 6 (Memory) | High |
| Broken after slot swap | Card 7 (Config Drift) | High |
| ENOSPC errors | Card 8 (Disk) | High |