Warm-up vs Health Check (Azure App Service Linux)
1. Summary
Symptom
On Azure App Service Linux, the app either never becomes ready after restart or becomes ready and then instances get removed from rotation. Teams see HTTP probe failures and treat all failures as one problem.
Why this scenario is confusing
Warm-up and Health Check both use HTTP but serve different phases: - Startup warm-up (platform startup pings) validates initial container readiness. - Health Check (feature configuration) evaluates already-running instances. Wrong mental model leads to wrong mitigations (for example tuning Health Check when startup timeout is the actual issue).
Troubleshooting decision flow
graph TD
    A[Symptom: Probe failures around startup and runtime] --> B{When does failure occur?}
    B --> C[Before first ready state]
    B --> D[After startup while running]
    C --> E{Startup signal}
    E --> F[Long init before first response]
    E --> G[Port/bind mismatch during startup]
    D --> I{Health path behavior}
    I --> J[Health endpoint heavy/intermittent]
    I --> K[Warm-up vs health path/status mismatch]
    F --> H1[H1: Startup warm-up timeout]
    J --> H2[H2: Health Check endpoint is heavy]
    K --> H3[H3: Path mismatch or logic drift]
    G --> H4[H4: Port or bind mismatch]
Investigation Notes
- Startup warm-up answers: "Can this new instance serve HTTP yet?"
- Health Check answers: "Should this already-running instance stay in load balancing?"
- If startup fails, tune startup path and timeout-related settings.
- If runtime health fails, tune endpoint behavior and dependency strategy.
- During scale-out, both mechanisms can appear close in time; use log timeline correlation.
WEBSITE_WARMUP_PATHlets you specify a custom path for the startup warm-up probe instead of/.WEBSITE_WARMUP_STATUSESdefines which HTTP status codes count as a successful warm-up (e.g.,200,202). These are distinct from the Health Check path and apply only during initial startup validation.
11. Related Queries
../../kql/console/startup-errors.md../../kql/console/container-binding-errors.md../../kql/restarts/repeated-startup-attempts.md../../kql/http/latency-trend-by-status-code.md
12. Related Checklists
13. Related Labs
Limitations
- Linux/OSS scope only; Windows-specific behavior is excluded.
- Queries assume App Service logs are routed to Log Analytics.
- Table/column names may vary slightly by workspace configuration.
Quick Conclusion
Do not treat warm-up and Health Check as one signal. First isolate startup readiness failure vs runtime health eviction, then apply targeted fixes: startup timing/port/bind for warm-up issues, and lightweight deterministic endpoint design for Health Check issues.
2. Common Misreadings
- "Health Check failed, so startup failed" (startup can fail with Health Check disabled).
- "Raising Health Check threshold will fix startup timeout" (it does not change startup probe behavior).
- "
/healthis fast locally, so platform warm-up is fine" (warm-up timing/path behavior can still fail). - "Any HTTP 5xx during deploy means bad code" (could be probe path design or startup timing).
Common Misdiagnoses
- "Health Check path is green, so warm-up cannot fail." (warm-up has independent policy and timing)
- "Any probe issue should be solved by raising Health Check failures threshold." (does not address startup cancellation)
- "Gunicorn boot logs in
Errorlevel prove startup failure." (message body shows INFO bootstrap) - "If
/configreturns 200 once, readiness contract is complete." (swap/startup acceptance may still fail) - "Only code changes cause these incidents." (setting drift between warm-up and health paths is common)
3. Competing Hypotheses
- H1: Startup warm-up timeout caused by slow initialization before first HTTP response.
- H2: Health Check endpoint is heavy and intermittently fails after startup.
- H3: Path mismatch or logic drift between warm-up expectations and configured Health Check path.
- H4: Port or bind mismatch (process alive but unreachable to startup pings).
4. What to Check First
Metrics
- Restart count and instance churn during deployment.
- 5xx and latency spikes around cold starts and scale-out.
- Sudden instance drops after initially becoming ready.
Logs
AppServicePlatformLogsfor startup lifecycle and ping outcomes.AppServiceConsoleLogsfor bind/listen timestamps and startup errors.AppServiceHTTPLogsfor health-path status/latency patterns.
Platform Signals
WEBSITES_CONTAINER_START_TIME_LIMIT,WEBSITES_PORT,PORT.- Health Check enabled state and configured path.
- Startup command, image tag, and recent deployment change window.
WEBSITE_WARMUP_PATHandWEBSITE_WARMUP_STATUSESfor custom warm-up probe behavior.
Portal view: Web App Down detector for warmup vs. health-check triage
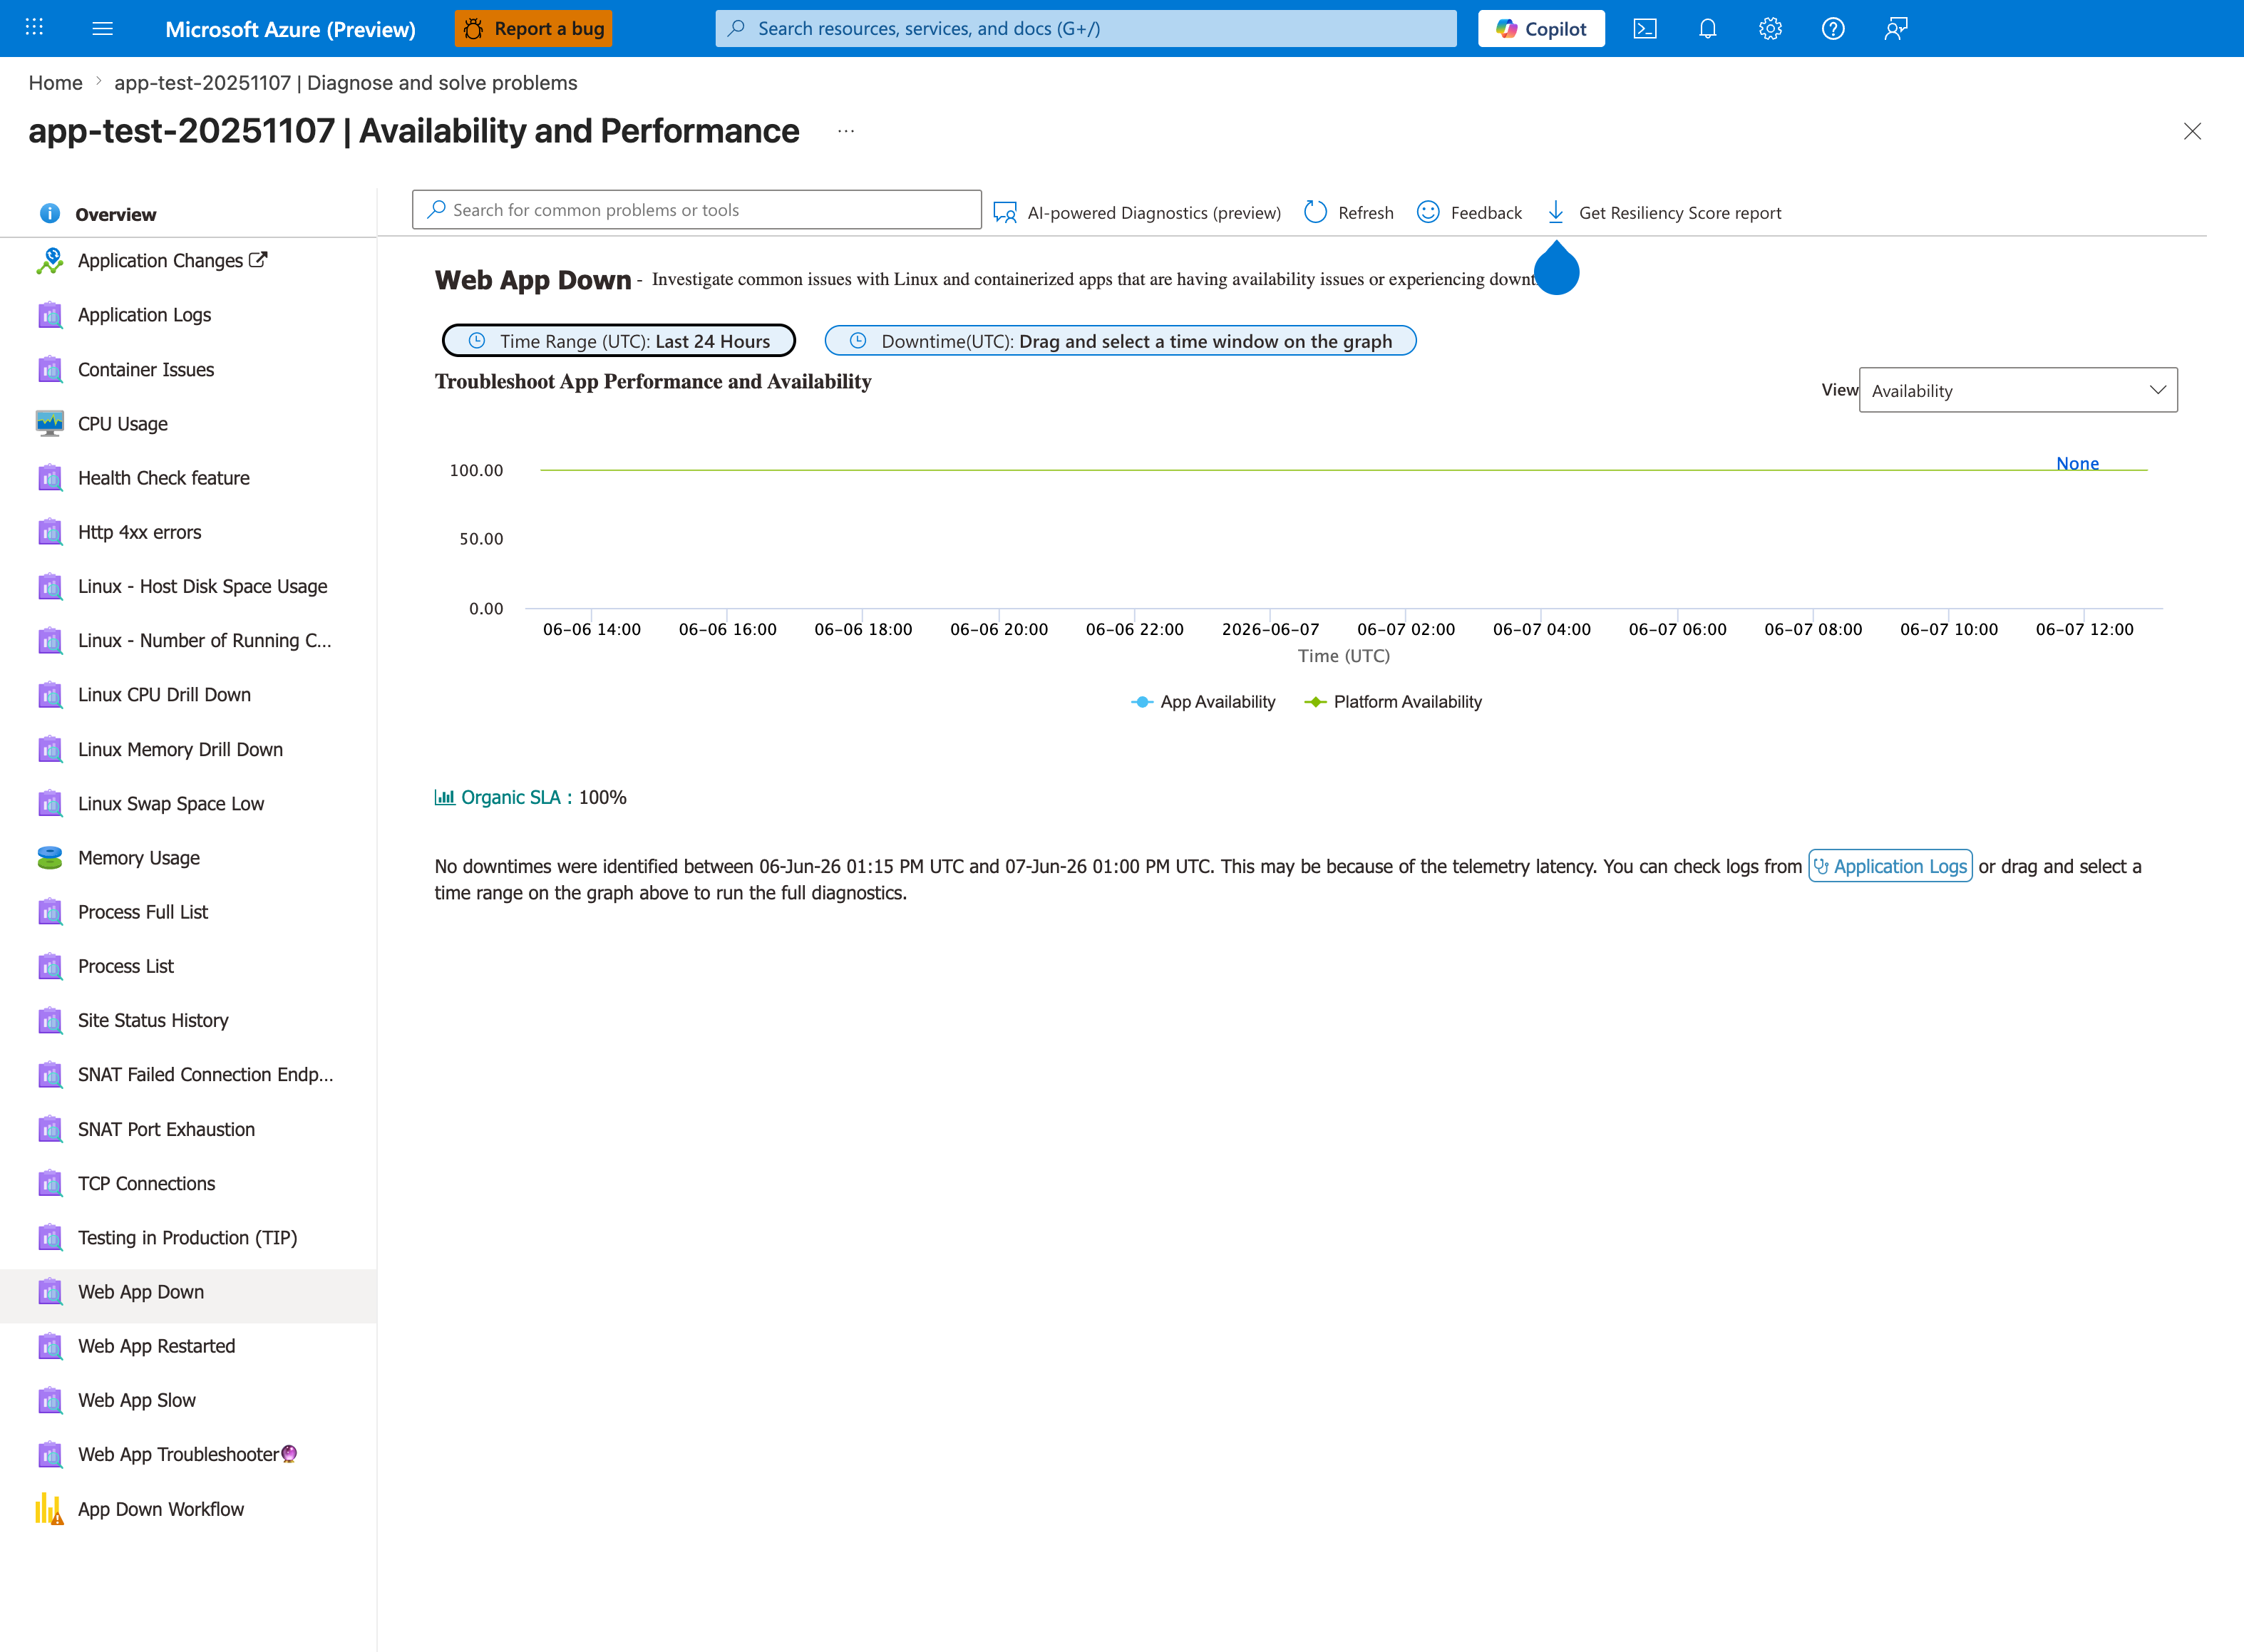
The Web App Down detector under Availability and Performance is the orientation surface for this playbook's first triage step. In this baseline capture both KPI tiles read 100% (App Availability blue, Platform Availability green) and the green banner reports "No downtimes were identified for this Web App in the last 24 hours". The detector's separation of App Availability from Platform Availability into two distinct KPI tiles is the property the playbook leverages when distinguishing worker-side warm-up/probe regressions from infrastructure-side failures. The left-rail detector navigation lists adjacent detectors (Web App Restarted, Container Issues) that the playbook's Section 5 evidence list routes to next. The Linux drill-down labels reflect this capture's source app; the detector itself is OS-agnostic and is the correct first stop on Windows apps as well.
5. Evidence to Collect
Required Evidence
- Platform log slice covering deployment to failure/success transition.
- Console log slice showing app boot and first listen event.
- Current app settings for startup timeout and port values.
- Current Health Check path configuration.
- HTTP logs for
/,/health,/ready, or equivalent path.
Useful Context
- Recent changes to health handler logic or middleware/auth rules.
- Dependency checks executed by health handler (database/cache/external APIs).
- Whether failures happen on cold start only or also during steady state.
- Any migration/model-loading work executed in startup or health route.
Sample Log Patterns
AppServiceHTTPLogs (slot-swap lab)
[AppServiceHTTPLogs]
2026-04-04T11:23:03Z  GET  /diag/env    200  9
2026-04-04T11:23:03Z  GET  /diag/stats  200  31
2026-04-04T11:21:57Z  GET  /config      200  63
AppServiceConsoleLogs (slot-swap lab)
[AppServiceConsoleLogs]
2026-04-04T11:14:20Z  Error  [2026-04-04 11:14:20 +0000] [1894] [INFO] Starting gunicorn 25.3.0
2026-04-04T11:14:20Z  Error  [2026-04-04 11:14:20 +0000] [1894] [INFO] Listening at: http://0.0.0.0:8000 (1894)
2026-04-04T11:14:20Z  Error  [2026-04-04 11:14:20 +0000] [1894] [INFO] Using worker: sync
2026-04-04T11:14:20Z  Error  [2026-04-04 11:14:20 +0000] [1895] [INFO] Booting worker with pid: 1895
2026-04-04T11:14:20Z  Error  [2026-04-04 11:14:20 +0000] [1896] [INFO] Booting worker with pid: 1896
2026-04-04T11:14:21Z  Error  [2026-04-04 11:14:21 +0000] [1894] [INFO] Control socket listening at /root/.gunicorn/gunicorn.ctl
AppServicePlatformLogs (slot-swap lab)
[AppServicePlatformLogs]
2026-04-04T11:14:44Z  Informational  State: Stopping, Action: StoppingSiteContainers, LastError: ContainerTimeout, LastErrorTimestamp: 04/04/2026 10:53:28
2026-04-04T11:14:44Z  Informational  Stopping container: fc8f0627a0c0_<app-name>.
2026-04-04T11:14:50Z  Informational  Container is terminated. Total time elapsed: 6367 ms.
2026-04-04T11:14:50Z  Informational  Site: <app-name> stopped.
How to Read This
In this lab, app startup evidence exists and diagnostic routes return 200, yet platform still stops the site with ContainerTimeout. This is the signature of startup warm-up contract failure, not a generic runtime Health Check eviction.
KQL Queries with Example Output
Query 1: Distinguish startup readiness from route responsiveness
AppServiceHTTPLogs
| where TimeGenerated between (datetime(2026-04-04 11:21:50) .. datetime(2026-04-04 11:23:10))
| where CsUriStem in ("/diag/env", "/diag/stats", "/config")
| project TimeGenerated, CsMethod, CsUriStem, ScStatus, TimeTaken
| order by TimeGenerated desc
Example Output:
| TimeGenerated | CsMethod | CsUriStem | ScStatus | TimeTaken |
|---|---|---|---|---|
| 2026-04-04 11:23:03 | GET | /diag/env | 200 | 9 |
| 2026-04-04 11:23:03 | GET | /diag/stats | 200 | 31 |
| 2026-04-04 11:21:57 | GET | /config | 200 | 63 |
How to Read This
Healthy point-in-time route responses do not prove startup warm-up succeeded for swap/start lifecycle. Use this query with platform lifecycle logs before concluding Health Check is at fault.
Query 2: Confirm listener and worker startup happened
AppServiceConsoleLogs
| where TimeGenerated between (datetime(2026-04-04 11:14:18) .. datetime(2026-04-04 11:14:25))
| where ResultDescription has_any ("Starting gunicorn", "Listening at", "Using worker", "Booting worker")
| project TimeGenerated, Level, ResultDescription
| order by TimeGenerated asc
Example Output:
| TimeGenerated | Level | ResultDescription |
|---|---|---|
| 2026-04-04 11:14:20 | Error | [2026-04-04 11:14:20 +0000] [1894] [INFO] Starting gunicorn 25.3.0 |
| 2026-04-04 11:14:20 | Error | [2026-04-04 11:14:20 +0000] [1894] [INFO] Listening at: http://0.0.0.0:8000 (1894) |
| 2026-04-04 11:14:20 | Error | [2026-04-04 11:14:20 +0000] [1894] [INFO] Using worker: sync |
| 2026-04-04 11:14:20 | Error | [2026-04-04 11:14:20 +0000] [1895] [INFO] Booting worker with pid: 1895 |
| 2026-04-04 11:14:20 | Error | [2026-04-04 11:14:20 +0000] [1896] [INFO] Booting worker with pid: 1896 |
How to Read This
This confirms process boot and bind. If failures still occur, prioritize policy/path mismatch (H3) or warm-up timing (H1) before tuning Health Check thresholds.
Query 3: Identify startup lifecycle cancellation events
AppServicePlatformLogs
| where TimeGenerated between (datetime(2026-04-04 11:14:40) .. datetime(2026-04-04 11:14:55))
| where Message has_any ("StoppingSiteContainers", "ContainerTimeout", "Container is terminated", "Site:")
| project TimeGenerated, Level, Message
| order by TimeGenerated asc
Example Output:
| TimeGenerated | Level | Message |
|---|---|---|
| 2026-04-04 11:14:44 | Informational | State: Stopping, Action: StoppingSiteContainers, LastError: ContainerTimeout, LastErrorTimestamp: 04/04/2026 10:53:28 |
| 2026-04-04 11:14:44 | Informational | Stopping container: fc8f0627a0c0_ |
| 2026-04-04 11:14:50 | Informational | Container is terminated. Total time elapsed: 6367 ms. |
| 2026-04-04 11:14:50 | Informational | Site: |
How to Read This
This table is the strongest discriminator: startup lifecycle cancellation is a warm-up problem. Health Check problems usually appear after instance is already in rotation.
CLI Investigation Commands
# Validate warm-up and health-related settings side by side
az webapp config appsettings list --resource-group <resource-group> --name <app-name> --slot <staging-slot> --query "[?name=='WEBSITE_WARMUP_PATH' || name=='WEBSITE_WARMUP_STATUSES' || name=='WEBSITE_SWAP_WARMUP_PING_PATH' || name=='WEBSITE_SWAP_WARMUP_PING_STATUSES' || name=='WEBSITES_CONTAINER_START_TIME_LIMIT'].{name:name,value:value}" --output table

# Check configured Health Check path on staging slot
az webapp config show --resource-group <resource-group> --name <app-name> --slot <staging-slot> --query "{healthCheckPath:healthCheckPath,linuxFxVersion:linuxFxVersion,appCommandLine:appCommandLine}" --output table

# Set explicit warm-up path/status and retest slot behavior
az webapp config appsettings set --resource-group <resource-group> --name <app-name> --slot <staging-slot> --settings WEBSITE_SWAP_WARMUP_PING_PATH=/ready WEBSITE_SWAP_WARMUP_PING_STATUSES=200,202
az webapp deployment slot swap --resource-group <resource-group> --name <app-name> --slot <staging-slot> --target-slot production
Example Output:
Name                               Value
---------------------------------  ----------------
WEBSITE_WARMUP_PATH                /
WEBSITE_WARMUP_STATUSES            200,202
WEBSITE_SWAP_WARMUP_PING_PATH      /ready
WEBSITE_SWAP_WARMUP_PING_STATUSES  200,202
WEBSITES_CONTAINER_START_TIME_LIMIT 230

HealthCheckPath    LinuxFxVersion  AppCommandLine
-----------------  --------------  -------------------------------------------
/health            PYTHON|3.11     gunicorn --bind 0.0.0.0:8000 src.app:app

{
  "slotSwapStatus": "initiated",
  "message": "Swap started; monitor warm-up acceptance in platform logs"
}
How to Read This
Keep warm-up and Health Check settings intentionally separate. If warm-up settings and lifecycle events are failing, changing Health Check threshold alone is unlikely to fix startup incidents.
6. Validation and Disproof by Hypothesis
H1: Startup warm-up timeout
Support signals - Platform shows startup ping timeout before app is marked ready. - Console shows long init before server binds.
Weakening signals - Startup consistently succeeds quickly; failures occur later.
KQL
let startTime = ago(6h);
AppServicePlatformLogs
| where TimeGenerated >= startTime
| where ResultDescription has_any ("startup", "warmup", "didn't respond", "failed to start")
| project TimeGenerated, ContainerId, OperationName, ResultDescription
| order by TimeGenerated desc
CLI (long flags)
az webapp config appsettings list --resource-group <resource-group> --name <app-name>
az webapp log tail --resource-group <resource-group> --name <app-name>
az webapp config appsettings set --resource-group <resource-group> --name <app-name> --settings WEBSITES_CONTAINER_START_TIME_LIMIT=600
H2: Health Check endpoint is heavy
Support signals - Startup succeeds but running instances later fail health checks. - Health path has high latency or intermittent 5xx.
Weakening signals - Health path is constant-time and stable across instances.
KQL
let startTime = ago(6h);
AppServiceHTTPLogs
| where TimeGenerated >= startTime
| where CsUriStem in ("/health", "/healthz", "/ready")
| summarize requests=count(), failures=countif(ScStatus >= 500), p95=percentile(TimeTaken, 95) by CsUriStem, bin(TimeGenerated, 5m)
| order by TimeGenerated desc
CLI (long flags)
az monitor log-analytics query --workspace <workspace-id> --analytics-query "AppServiceHTTPLogs | where CsUriStem == '/health' | summarize count() by ScStatus"
az webapp config set --resource-group <resource-group> --name <app-name> --generic-configurations "{\"healthCheckPath\":\"/health/light\"}"
az webapp restart --resource-group <resource-group> --name <app-name>
H3: Path mismatch between warm-up behavior and Health Check
Support signals - / succeeds but configured health path fails under same time window. - Different middleware/auth/dependency behavior on health route.
Weakening signals - Same lightweight handler behavior for readiness-related routes.
KQL
let startTime = ago(6h);
AppServiceHTTPLogs
| where TimeGenerated >= startTime
| where CsUriStem in ("/", "/health", "/healthz", "/ready")
| summarize total=count(), failures=countif(ScStatus >= 500), p95=percentile(TimeTaken, 95) by CsUriStem, bin(TimeGenerated, 10m)
| order by TimeGenerated desc
CLI (long flags)
az webapp show --resource-group <resource-group> --name <app-name>
az webapp config set --resource-group <resource-group> --name <app-name> --generic-configurations "{\"healthCheckPath\":\"/health\"}"
az webapp restart --resource-group <resource-group> --name <app-name>
H4: Port or bind mismatch during startup
Support signals - Console shows bind to 127.0.0.1 or non-expected port. - Startup ping failure appears while process is running.
Weakening signals - Explicit bind 0.0.0.0 and stable startup success.
KQL
let startTime = ago(6h);
AppServiceConsoleLogs
| where TimeGenerated >= startTime
| where ResultDescription has_any ("0.0.0.0", "127.0.0.1", "Listening on", "Now listening")
| project TimeGenerated, ContainerId, ResultDescription
| order by TimeGenerated desc
CLI (long flags)
az webapp config appsettings list --resource-group <resource-group> --name <app-name>
az webapp config appsettings set --resource-group <resource-group> --name <app-name> --settings WEBSITES_PORT=8000 PORT=8000
az webapp restart --resource-group <resource-group> --name <app-name>
Normal vs Abnormal Comparison
| Signal | Normal Warm-up + Health Behavior | Warm-up vs Health Confusion Case |
|---|---|---|
| Startup lifecycle | Instance reaches ready state and remains running | Platform cancels startup with ContainerTimeout |
| Route behavior | /ready and /health both stable under startup budgets | Some routes show 200, but startup lifecycle still fails |
| Console evidence | Listener and workers start, no immediate stop sequence | Listener appears, followed by forced platform stop |
| Mitigation that works | Tune endpoint semantics separately and keep both lightweight | Health threshold tuning alone does not resolve startup failure |
| Interpretation | Two-phase model is respected | Startup and runtime checks are conflated |
7. Likely Root Cause Patterns
- Pattern A: Health endpoint performs deep dependency checks and times out.
- Pattern B: App boot path is too heavy; first HTTP response misses startup window.
- Pattern C: Health path drifted from lightweight readiness to business-logic path.
- Pattern D: Runtime bind/port differs from local development assumptions.
8. Immediate Mitigations
- Use a lightweight Health Check path that avoids expensive downstream calls. Risk: reduced depth of dependency visibility.
- Temporarily increase
WEBSITES_CONTAINER_START_TIME_LIMITwhile collecting evidence. Risk: slower failure detection. - Move migrations/model load out of request startup path and out of health handler. Risk: requires pipeline/process updates.
- Enforce
0.0.0.0binding and consistentPORT/WEBSITES_PORT. Risk: low, generally safe. - Add tight timeouts/circuit behavior for dependency checks in health route. Risk: potential false unhealthy signals if thresholds are too strict.
9. Prevention
- Document a two-phase availability model: startup readiness vs runtime health.
- Implement separate
/liveand/readyendpoints with explicit semantics. - Keep health logic deterministic, fast, and observable.
- Standardize Linux/OSS startup commands (production server, not dev server).
- Add CI checks for startup budget and health latency budget regressions.