Slot Swap Failed During Warm-up (Azure App Service Linux)
1. Summary
Symptom
An Azure App Service Linux slot swap fails, rolls back, or takes much longer than expected because warm-up validation does not complete for the source (staging) slot. Common user-facing outcomes include swap timeout messages, repeated swap retries, and intermittent availability during deployment windows.
Why this scenario is confusing
Swap warm-up is not the same mechanism as regular runtime traffic checks. An app can respond when you browse the staging URL manually and still fail platform-controlled warm-up due to timing, path rules, status filtering, or slot-specific configuration drift.
Troubleshooting decision flow
graph TD
    A[Symptom: Slot swap fails during warm-up] --> B{Check swap timeline first}
    B --> C[First acceptable response arrives too late]
    B --> D[Response arrives, but warm-up still rejected]
    C --> H1[H1: Startup exceeds warm-up budget]
    D --> E{Why warm-up rejected?}
    E --> F[Warm-up path/status policy too strict]
    E --> G[Staging slot config differs from production]
    E --> I[Health endpoint heavy during cold start]
    F --> H2[H2: Warm-up path/status misconfigured]
    G --> H3[H3: Slot-specific configuration drift]
    I --> H4[H4: Health Check conflicts with swap timing]
Investigation Notes
- Treat swap warm-up as a time-bounded state transition, not a generic availability check.
- Focus timeline correlation first: swap trigger, container start, first listen, first acceptable warm-up response.
- If staging URL is manually healthy but swap still fails, inspect path/status policy and slot setting parity immediately.
- Keep Linux/OSS context explicit: this playbook does not cover Windows workers.
- For Python/Flask/FastAPI/Gunicorn workloads, verify server command binds to
0.0.0.0and uses environment-driven port.
11. Related Queries
../../kql/console/startup-errors.md../../kql/restarts/repeated-startup-attempts.md../../kql/http/latency-trend-by-status-code.md../../kql/correlation/restarts-vs-latency.md
12. Related Checklists
13. Related Labs
Limitations
- Linux/OSS App Service scope only; Windows/IIS slot behavior is intentionally excluded.
- KQL table availability depends on diagnostics routing to Log Analytics.
- Query fields can vary slightly by workspace schema version.
- This playbook emphasizes startup and swap control-plane behavior, not full application performance profiling.
Quick Conclusion
When slot swap fails during warm-up, assume a validation contract mismatch first: timing, path/status policy, or slot-specific configuration drift. Correlate platform, console, and HTTP logs in one timeline, then apply targeted mitigations (lightweight warm-up endpoint, startup optimization, and slot parity controls) to make swaps repeatable and safe.
2. Common Misreadings
- "Staging works in browser, so warm-up must be healthy." (manual checks often differ from platform probe behavior)
- "This is just a health check issue." (swap warm-up and Health Check are related but independently configurable)
- "Swap failure means production code is bad." (frequently caused by slot-specific settings or startup timing)
- "Increasing instance count will fix it." (can worsen startup pressure if initialization is heavy)
- "If no crash appears, platform issue is random." (many failures are deterministic once timing and probe path are correlated)
Common Misdiagnoses
- "If
/diag/envis 200, swap logic must pass." (swap acceptance uses its own timing/path/status contract) - "Console level
Errormeans bootstrap crashed." (Gunicorn INFO lines are often mapped into this field) - "Container timeout always means application deadlock." (it can also indicate warm-up policy mismatch)
- "Only production slot settings matter." (staging slot drift is a common trigger for swap failures)
- "Increasing instance count alone fixes warm-up." (can increase cold-start pressure when initialization is heavy)
3. Competing Hypotheses
- H1: Staging slot container startup exceeds warm-up window before first acceptable HTTP response.
- H2: Warm-up path/status policy is too strict (
WEBSITE_SWAP_WARMUP_PING_PATH,WEBSITE_SWAP_WARMUP_PING_STATUSES) for current startup behavior. - H3: Slot-specific app settings or connection settings drifted, so staging initialization differs from production expectations.
- H4: Health Check endpoint behavior on staging conflicts with swap timing (heavy dependency checks, transient 5xx, auth/middleware mismatch).
4. What to Check First
Metrics
- Restart count and instance churn during swap attempts.
- HTTP 5xx and latency spikes aligned to swap start timestamp.
- CPU and memory pressure during staging startup (cold start amplification).
- Duration from swap trigger to rollback/failure event.
Logs
AppServicePlatformLogsfor swap lifecycle and warm-up messages.AppServiceConsoleLogsfor startup timeline, binding logs, and dependency failures.AppServiceHTTPLogsfor warm-up path response code and latency distribution.
Platform Signals
- Effective values of
WEBSITE_SWAP_WARMUP_PING_PATHandWEBSITE_SWAP_WARMUP_PING_STATUSES. - Startup budget (
WEBSITES_CONTAINER_START_TIME_LIMIT) and port settings (WEBSITES_PORT,PORT). - Health Check path configuration and authentication requirements.
- Slot setting flags for sensitive config (database, cache, feature toggles, secrets).
Portal view: Activity log for slot-swap operation audit
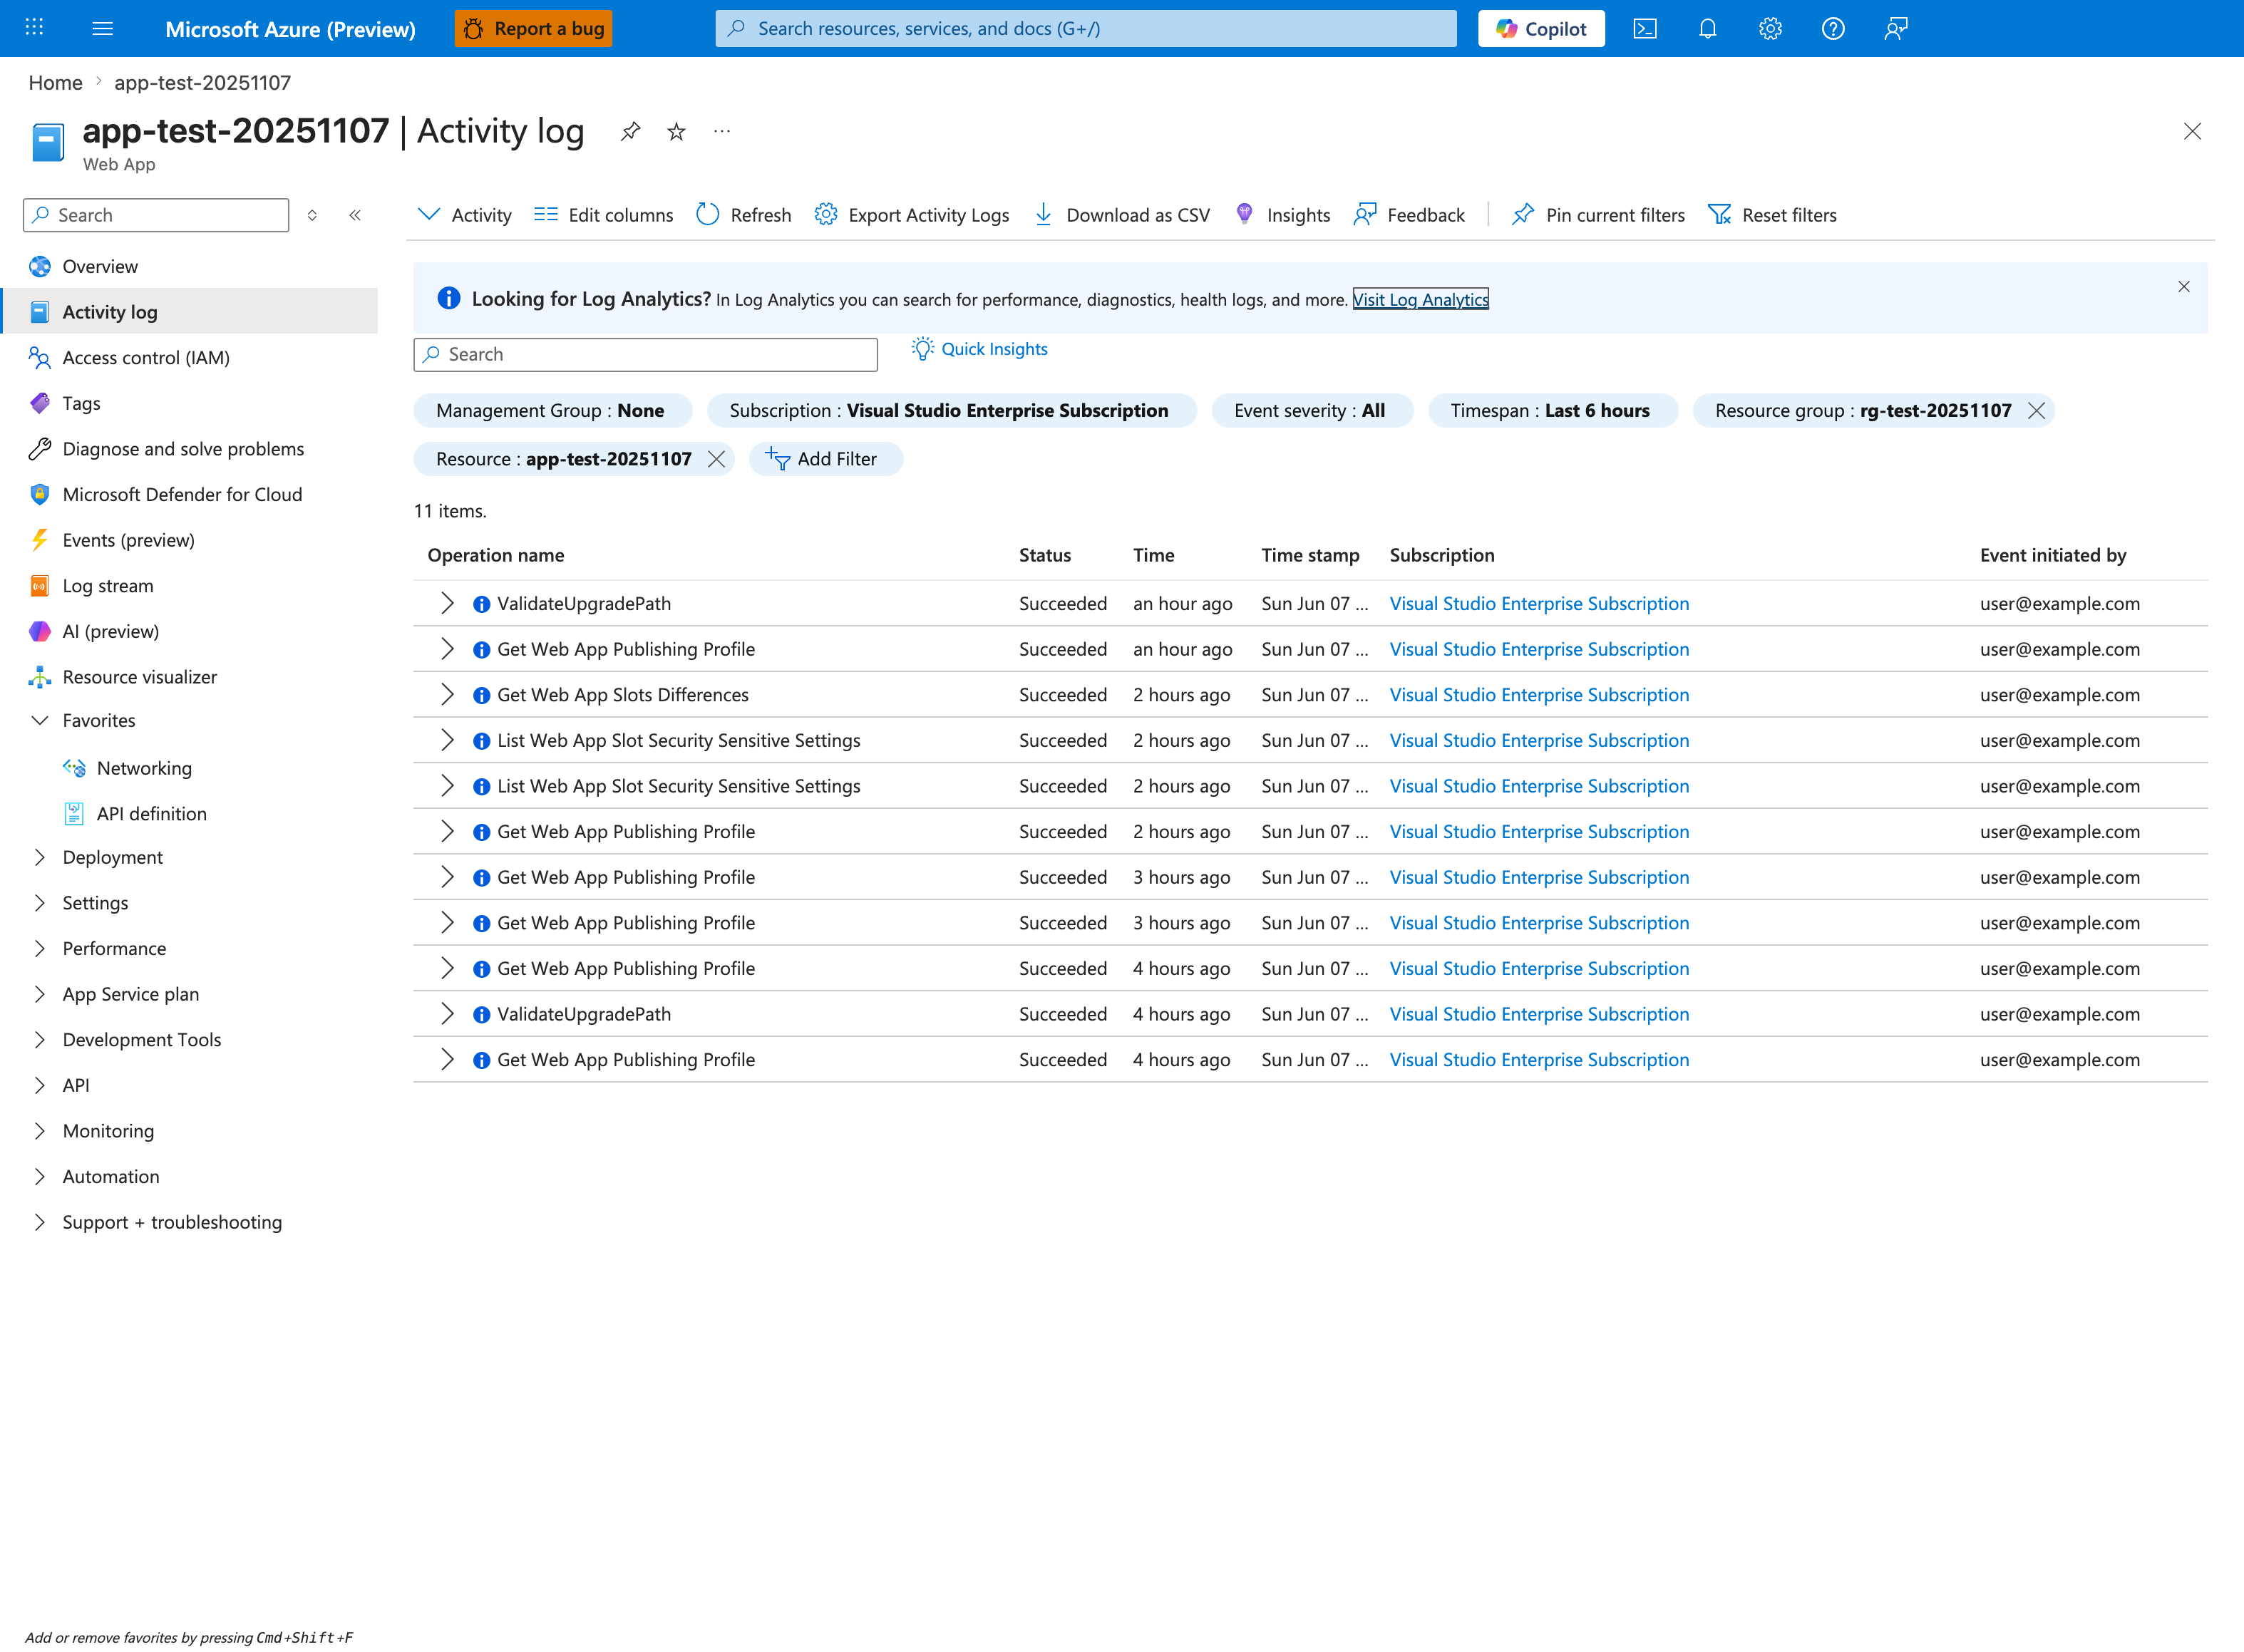
The Activity log blade is the control-plane audit surface this playbook uses to anchor a swap-window timeline. The visible filter chips (Resource: app-test-20251107, Timespan: Last 6 hours) demonstrate the standard scope-and-window pattern you apply when investigating a swap that failed during warm-up. Among the 11 visible rows are slot-adjacent operations (Get Web App Slots Differences, List Web App Slot Security Sensitive Settings) that confirm the blade's filter correctly captures slot-touching control-plane activity for this resource. The Status, Time stamp, and Event initiated by columns populated for every row define the schema you correlate against the warm-up failure window; the toolbar Download as CSV action exports the filtered set for ticket attachment, and the visible Sun Jun 07 timestamps illustrate the per-row resolution the blade provides.
5. Evidence to Collect
Required Evidence
- Exact swap attempt window (start time, failure time, retry count).
- Platform log excerpt showing warm-up acceptance or failure reason.
- Console logs from staging slot from container start until swap timeout/rollback.
- Current app settings and connection strings from both slots, including slot-setting markers.
- HTTP log sample for warm-up path and health path around swap window.
Useful Context
- Recent changes to startup code, migrations, model loading, or dependency bootstrap logic.
- Recent slot setting changes (new secret names, endpoint URLs, identity configuration).
- Any middleware/auth changes affecting warm-up or health endpoints.
- Whether failure appears only on first swap after deployment, or on every swap.
- Whether this is custom container Linux or built-in Linux runtime with startup command overrides.
Sample Log Patterns
AppServiceHTTPLogs (slot-swap lab)
[AppServiceHTTPLogs]
2026-04-04T11:23:03Z  GET  /diag/env    200  9
2026-04-04T11:23:03Z  GET  /diag/stats  200  31
2026-04-04T11:21:57Z  GET  /config      200  63
AppServiceConsoleLogs (slot-swap lab)
[AppServiceConsoleLogs]
2026-04-04T11:14:20Z  Error  [2026-04-04 11:14:20 +0000] [1894] [INFO] Starting gunicorn 25.3.0
2026-04-04T11:14:20Z  Error  [2026-04-04 11:14:20 +0000] [1894] [INFO] Listening at: http://0.0.0.0:8000 (1894)
2026-04-04T11:14:20Z  Error  [2026-04-04 11:14:20 +0000] [1894] [INFO] Using worker: sync
2026-04-04T11:14:20Z  Error  [2026-04-04 11:14:20 +0000] [1895] [INFO] Booting worker with pid: 1895
2026-04-04T11:14:20Z  Error  [2026-04-04 11:14:20 +0000] [1896] [INFO] Booting worker with pid: 1896
2026-04-04T11:14:21Z  Error  [2026-04-04 11:14:21 +0000] [1894] [INFO] Control socket listening at /root/.gunicorn/gunicorn.ctl
AppServicePlatformLogs (slot-swap lab)
[AppServicePlatformLogs]
2026-04-04T11:14:44Z  Informational  State: Stopping, Action: StoppingSiteContainers, LastError: ContainerTimeout, LastErrorTimestamp: 04/04/2026 10:53:28
2026-04-04T11:14:44Z  Informational  Stopping container: fc8f0627a0c0_<app-name>.
2026-04-04T11:14:50Z  Informational  Container is terminated. Total time elapsed: 6367 ms.
2026-04-04T11:14:50Z  Informational  Site: <app-name> stopped.
How to Read This
This pattern shows the app can produce successful diagnostic responses (200) while swap still fails because control-plane warm-up acceptance timed out. In other words: runtime endpoint checks and swap lifecycle checks are related, but not identical.
KQL Queries with Example Output
Query 1: Warm-up window HTTP behavior
AppServiceHTTPLogs
| where TimeGenerated between (datetime(2026-04-04 11:21:50) .. datetime(2026-04-04 11:23:10))
| where CsUriStem in ("/diag/env", "/diag/stats", "/config")
| project TimeGenerated, CsMethod, CsUriStem, ScStatus, TimeTaken
| order by TimeGenerated desc
Example Output:
| TimeGenerated | CsMethod | CsUriStem | ScStatus | TimeTaken |
|---|---|---|---|---|
| 2026-04-04 11:23:03 | GET | /diag/env | 200 | 9 |
| 2026-04-04 11:23:03 | GET | /diag/stats | 200 | 31 |
| 2026-04-04 11:21:57 | GET | /config | 200 | 63 |
How to Read This
These 200 responses disprove a total app outage. If swap still fails, prioritize H2/H3/H4 (warm-up policy mismatch, slot config drift, or health/warm-up logic conflict) over pure startup crash hypotheses.
Query 2: Startup process evidence from console logs
AppServiceConsoleLogs
| where TimeGenerated between (datetime(2026-04-04 11:14:18) .. datetime(2026-04-04 11:14:25))
| where ResultDescription has_any ("Starting gunicorn", "Listening at", "Booting worker", "Control socket listening")
| project TimeGenerated, Level, ResultDescription
| order by TimeGenerated asc
Example Output:
| TimeGenerated | Level | ResultDescription |
|---|---|---|
| 2026-04-04 11:14:20 | Error | [2026-04-04 11:14:20 +0000] [1894] [INFO] Starting gunicorn 25.3.0 |
| 2026-04-04 11:14:20 | Error | [2026-04-04 11:14:20 +0000] [1894] [INFO] Listening at: http://0.0.0.0:8000 (1894) |
| 2026-04-04 11:14:20 | Error | [2026-04-04 11:14:20 +0000] [1895] [INFO] Booting worker with pid: 1895 |
| 2026-04-04 11:14:20 | Error | [2026-04-04 11:14:20 +0000] [1896] [INFO] Booting worker with pid: 1896 |
| 2026-04-04 11:14:21 | Error | [2026-04-04 11:14:21 +0000] [1894] [INFO] Control socket listening at /root/.gunicorn/gunicorn.ctl |
How to Read This
Even though level is shown as Error, message body is Gunicorn INFO bootstrap output. Treat this as positive startup evidence and correlate with platform swap events before concluding app-level failure.
Query 3: Platform stop/timeout signature around failed swap
AppServicePlatformLogs
| where TimeGenerated between (datetime(2026-04-04 11:14:40) .. datetime(2026-04-04 11:14:55))
| where Message has_any ("StoppingSiteContainers", "ContainerTimeout", "Stopping container", "Container is terminated", "Site:")
| project TimeGenerated, Level, Message
| order by TimeGenerated asc
Example Output:
| TimeGenerated | Level | Message |
|---|---|---|
| 2026-04-04 11:14:44 | Informational | State: Stopping, Action: StoppingSiteContainers, LastError: ContainerTimeout, LastErrorTimestamp: 04/04/2026 10:53:28 |
| 2026-04-04 11:14:44 | Informational | Stopping container: fc8f0627a0c0_ |
| 2026-04-04 11:14:50 | Informational | Container is terminated. Total time elapsed: 6367 ms. |
| 2026-04-04 11:14:50 | Informational | Site: |
How to Read This
This is control-plane lifecycle evidence. It confirms swap/warm-up process termination, which can happen even when app process booted and produced normal HTTP responses during adjacent windows.
CLI Investigation Commands
# Check warm-up and startup-related app settings on staging slot
az webapp config appsettings list --resource-group <resource-group> --name <app-name> --slot <staging-slot> --query "[?name=='WEBSITE_SWAP_WARMUP_PING_PATH' || name=='WEBSITE_SWAP_WARMUP_PING_STATUSES' || name=='WEBSITES_CONTAINER_START_TIME_LIMIT' || name=='WEBSITES_PORT'].{name:name,value:value}" --output table

# Compare production and staging startup-critical settings
az webapp config appsettings list --resource-group <resource-group> --name <app-name> --slot production --query "[?name=='WEBSITES_PORT' || name=='PORT' || name=='DATABASE_URL' || name=='FEATURE_FLAGS'].{name:name,slot:'production',value:value}" --output table
az webapp config appsettings list --resource-group <resource-group> --name <app-name> --slot <staging-slot> --query "[?name=='WEBSITES_PORT' || name=='PORT' || name=='DATABASE_URL' || name=='FEATURE_FLAGS'].{name:name,slot:'<staging-slot>',value:value}" --output table

# Trigger and observe slot swap behavior
az webapp deployment slot swap --resource-group <resource-group> --name <app-name> --slot <staging-slot> --target-slot production
az webapp log tail --resource-group <resource-group> --name <app-name> --slot <staging-slot>
Example Output:
Name                                Value
----------------------------------  ---------------------
WEBSITE_SWAP_WARMUP_PING_PATH       /ready
WEBSITE_SWAP_WARMUP_PING_STATUSES   200,202
WEBSITES_CONTAINER_START_TIME_LIMIT 230
WEBSITES_PORT                       8000

Name           Slot           Value
-------------  -------------  ---------------------------
WEBSITES_PORT  production     8000
PORT           production     8000
DATABASE_URL   production     <masked>
FEATURE_FLAGS  production     stable

Name           Slot             Value
-------------  ---------------  ---------------------------
WEBSITES_PORT  <staging-slot>   8000
PORT           <staging-slot>   8000
DATABASE_URL   <staging-slot>   <masked>
FEATURE_FLAGS  <staging-slot>   preprod

Status
--------
Swap initiated. Monitor logs for warm-up acceptance or rollback.
How to Read This
If staging settings differ on startup-critical values, treat H3 as primary. If settings are aligned, focus on warm-up path/status acceptance and endpoint startup behavior during the exact swap window.
6. Validation and Disproof by Hypothesis
H1: Startup time exceeds warm-up budget
Support signals - Platform logs show warm-up timeout while console logs show delayed first listen. - Successful swaps correlate with smaller images or fewer cold-start dependencies.
Signals that weaken H1 - App binds quickly and returns acceptable status well before timeout.
KQL
let startTime = ago(12h);
AppServicePlatformLogs
| where TimeGenerated >= startTime
| where ResultDescription has_any ("swap", "warmup", "timeout", "failed")
| project TimeGenerated, ContainerId, OperationName, ResultDescription
| order by TimeGenerated desc
let startTime = ago(12h);
AppServiceConsoleLogs
| where TimeGenerated >= startTime
| where ResultDescription has_any ("Listening on", "Now listening", "Started", "Gunicorn")
| project TimeGenerated, ContainerId, ResultDescription
| order by TimeGenerated asc
CLI (long flags only)
az webapp config appsettings list --resource-group <resource-group> --name <app-name> --slot <staging-slot>
az webapp log tail --resource-group <resource-group> --name <app-name> --slot <staging-slot>
az webapp config appsettings set --resource-group <resource-group> --name <app-name> --slot <staging-slot> --settings WEBSITES_CONTAINER_START_TIME_LIMIT=600
H2: Warm-up path or accepted statuses are misconfigured
Support signals - Warm-up path returns redirects, 401/403, or 404 during startup. - Accepted statuses exclude actual temporary success codes used by app during warm-up.
Signals that weaken H2 - Warm-up path consistently returns allowed status quickly in logs.
KQL
let startTime = ago(12h);
AppServiceHTTPLogs
| where TimeGenerated >= startTime
| where CsUriStem in ("/", "/health", "/ready", "/warmup")
| summarize requests=count(), failures=countif(ScStatus >= 400), p95=percentile(TimeTaken, 95) by CsUriStem, ScStatus, bin(TimeGenerated, 5m)
| order by TimeGenerated desc
CLI (long flags only)
az webapp config appsettings list --resource-group <resource-group> --name <app-name> --slot <staging-slot>
az webapp config appsettings set --resource-group <resource-group> --name <app-name> --slot <staging-slot> --settings WEBSITE_SWAP_WARMUP_PING_PATH=/ready WEBSITE_SWAP_WARMUP_PING_STATUSES=200,202
az webapp deployment slot swap --resource-group <resource-group> --name <app-name> --slot <staging-slot> --target-slot production
H3: Slot-specific configuration drift breaks staging warm-up
Support signals - Staging slot uses different secret references, endpoints, or feature flags. - Startup exceptions reference missing credentials, DNS failures, or denied dependency access only on staging.
Signals that weaken H3 - Config diff confirms parity for all startup-critical settings.
KQL
let startTime = ago(12h);
AppServiceConsoleLogs
| where TimeGenerated >= startTime
| where ResultDescription has_any ("authentication", "permission", "forbidden", "timeout", "connection", "dns", "secret")
| project TimeGenerated, ContainerId, ResultDescription
| order by TimeGenerated desc
CLI (long flags only)
az webapp config appsettings list --resource-group <resource-group> --name <app-name> --slot production
az webapp config appsettings list --resource-group <resource-group> --name <app-name> --slot <staging-slot>
az webapp config connection-string list --resource-group <resource-group> --name <app-name> --slot <staging-slot>
H4: Health Check behavior conflicts with swap warm-up timing
Support signals - Health endpoint performs deep dependency checks and intermittently fails under cold start. - HTTP logs show high p95 on health route exactly during swap windows.
Signals that weaken H4 - Health endpoint is lightweight, deterministic, and stable during swap attempts.
KQL
let startTime = ago(12h);
AppServiceHTTPLogs
| where TimeGenerated >= startTime
| where CsUriStem in ("/health", "/healthz", "/ready")
| summarize total=count(), failures=countif(ScStatus >= 500), p95=percentile(TimeTaken, 95) by CsUriStem, bin(TimeGenerated, 5m)
| order by TimeGenerated desc
CLI (long flags only)
az webapp config show --resource-group <resource-group> --name <app-name> --slot <staging-slot>
az webapp config set --resource-group <resource-group> --name <app-name> --slot <staging-slot> --generic-configurations "{\"healthCheckPath\":\"/health/light\"}"
az webapp restart --resource-group <resource-group> --name <app-name> --slot <staging-slot>
Normal vs Abnormal Comparison
| Signal | Normal Slot Swap Warm-up | Failed During Warm-up |
|---|---|---|
| Warm-up endpoint response | First accepted status quickly (usually 200) | Responses exist, but policy/timing still causes swap abort |
| AppServiceConsoleLogs | Boot + listen lines with no forced stop right away | Boot lines present, then platform stop sequence appears |
| AppServicePlatformLogs | Swap completes and target slot remains running | StoppingSiteContainers, ContainerTimeout, site stop sequence |
| Slot config parity | Startup-critical values aligned between slots | Drift in slot-specific settings alters staging behavior |
| Operational outcome | Traffic moves to new slot | Swap rollback or repeated failed attempts |
7. Likely Root Cause Patterns
- Pattern A: Warm-up endpoint requires downstream dependency readiness and fails during transient startup windows.
- Pattern B: Slot-specific setting drift (marked as slot setting) causes staging to initialize with invalid or incomplete configuration.
- Pattern C: Startup path includes blocking initialization (migrations, cache prime, model load) that exceeds warm-up budget.
- Pattern D: Status filter for swap warm-up excludes app’s valid transitional response code.
8. Immediate Mitigations
- Set a dedicated lightweight warm-up path that avoids auth and deep dependency checks. Risk: reduced coverage of end-to-end readiness.
- Expand acceptable warm-up statuses only as needed (for example
200,202) and document rationale. Risk: may mask partial readiness if too permissive. - Temporarily increase
WEBSITES_CONTAINER_START_TIME_LIMITwhile startup optimization is implemented. Risk: slower detection of truly bad builds. - Align slot settings for startup-critical values before swap (secrets, endpoints, feature toggles). Risk: accidental config propagation if review is skipped.
- Move heavyweight initialization out of request path (pre-deploy tasks, background bootstrapping). Risk: operational complexity and sequencing requirements.
9. Prevention
- Standardize startup contracts: explicit bind host, explicit port, deterministic first response target.
- Define separate
/warmupand/healthsemantics; keep/warmupminimal and fast. - Add deployment guardrails that diff slot settings and block swap on critical drift.
- Add startup SLOs (time-to-first-200) and alert on regression before swap is attempted.
- Automate pre-swap validation in pipeline with the same path/status expectations used by platform swap logic.