Failed to Forward Request (Azure App Service Linux)
1. Summary
Symptom
Requests intermittently or consistently fail at runtime with platform messages like "Failed to forward request" in AppServicePlatformLogs, even though the container may appear started. This means the App Service Linux front-end/middleware path could not successfully proxy the request to the app process in the container.
Why confusing
This error is often misread as a generic networking outage, but it can come from multiple layers: incorrect bind address (127.0.0.1), wrong port alignment (WEBSITES_PORT vs actual listen port), protocol mismatch (HTTP/2/WebSocket expectations vs HTTP/1.1 proxy behavior), double-proxy conflicts in custom images (nginx/caddy + platform proxy), slow first-response behavior, or post-bind crashes. The app may look healthy at a glance while still failing in the forwarding path.
flowchart TD
    A[Client] --> B[App Service Front-end]
    B --> C[Middleware Reverse Proxy]
    C --> D[App Container]

    X1{{Failure: FE to middleware handoff issue}} -.-> B
    X2{{Failure: middleware cannot reach container IP:port}} -.-> C
    X3{{Failure: app bound to 127.0.0.1 or wrong port}} -.-> D
    X4{{Failure: app crash/timeout before first request handling}} -.-> D
Investigation Notes
- Key distinction:
- Container didn't respond to HTTP pings = startup availability failure before the app is considered ready.
- Failed to forward request = request-path runtime forwarding failure after traffic is being proxied.
- On App Service Linux, there is a platform reverse-proxy/middleware hop between internet front-end and your container.
- A successful process start does not guarantee successful request forwarding.
- When custom middleware exists in-container (nginx/caddy), you effectively create an additional proxy hop that must be validated.
- Use
ContainerIdin platform logs for lifecycle correlation with console traces.
Example KQL (adjust table names/filters to your workspace schema)
// Platform forwarding failures by container
AppServicePlatformLogs
| where TimeGenerated > ago(24h)
| where ResultDescription has "Failed to forward request"
| project TimeGenerated, OperationName, ContainerId, ResultDescription
| order by TimeGenerated desc
// Console errors near forwarding failure windows
AppServiceConsoleLogs
| where TimeGenerated > ago(24h)
| where ResultDescription has_any ("error", "exception", "traceback", "bind", "listen")
| project TimeGenerated, ResultDescription
| order by TimeGenerated desc
// HTTP status and latency correlation
AppServiceHTTPLogs
| where TimeGenerated > ago(24h)
| summarize Requests=count(), AvgTimeTaken=avg(TimeTaken) by bin(TimeGenerated, 5m), ScStatus
| order by TimeGenerated asc
Example CLI checks (long flags only)
# Show app settings related to forwarding path
az webapp config appsettings list --resource-group <resource-group> --name <app-name>

# Show container startup command and Linux config
az webapp config show --resource-group <resource-group> --name <app-name>

# Restart app after config correction
az webapp restart --resource-group <resource-group> --name <app-name>
11. Related Queries
12. Related Checklists
13. Related Labs
../lab-guides/failed-to-forward-request.md
Limitations
- This playbook covers Linux App Service request-forwarding path issues only (no Windows/IIS scenarios).
- It does not provide exhaustive framework-specific proxy configuration matrices.
- It assumes required logs are enabled and available in the workspace.
Quick Conclusion
Treat "Failed to forward request" as a runtime proxy-path symptom, not a single root cause. Correlate platform forwarding errors (OperationName, ContainerId, ResultDescription) with console startup/runtime traces and HTTP latency/status patterns to isolate bind, port, protocol, middleware, timeout, or crash faults quickly and accurately.
2. Common Misreadings
- "The app is down" (it may be running but unreachable on the expected bind address/port)
- "This is the same as startup ping failure" (runtime forwarding failures are not identical to startup probe failures)
- "WebSockets/HTTP2 are broken on App Service" (often an upstream/downstream protocol handling mismatch in the app or custom middleware)
- "Platform bug" (most cases are app/middleware binding, protocol, timeout, or crash behavior)
- "WEBSITES_PORT is set, so routing must be correct" (the process can still bind somewhere else)
3. Competing Hypotheses
- H1: Bind/address mismatch — app binds to
127.0.0.1instead of0.0.0.0, so platform proxy cannot reach it. - H2: Port mismatch —
WEBSITES_PORTpoints to one port, but the app actually listens on another. - H3: Protocol/path mismatch — app or user-managed middleware expects HTTP/2/WebSocket semantics that conflict with proxy expectations at that hop.
- H4: Double-proxy conflict — custom container includes nginx/caddy reverse-proxy rules that break routing behind App Service middleware.
- H5: Slow first response / timeout — startup or warm path delays response enough that proxy forwarding fails.
- H6: Crash after bind — process starts, may log a bind message, then crashes before serving requests.
4. What to Check First
Metrics
- HTTP status trend and latency spikes using
AppServiceHTTPLogs(ScStatus,TimeTaken) - Restart/recycle signals around failure windows
- Whether failures are steady-state or bursty during deployment/restart windows
Portal view: Web App Down detector (the App vs Platform availability split)
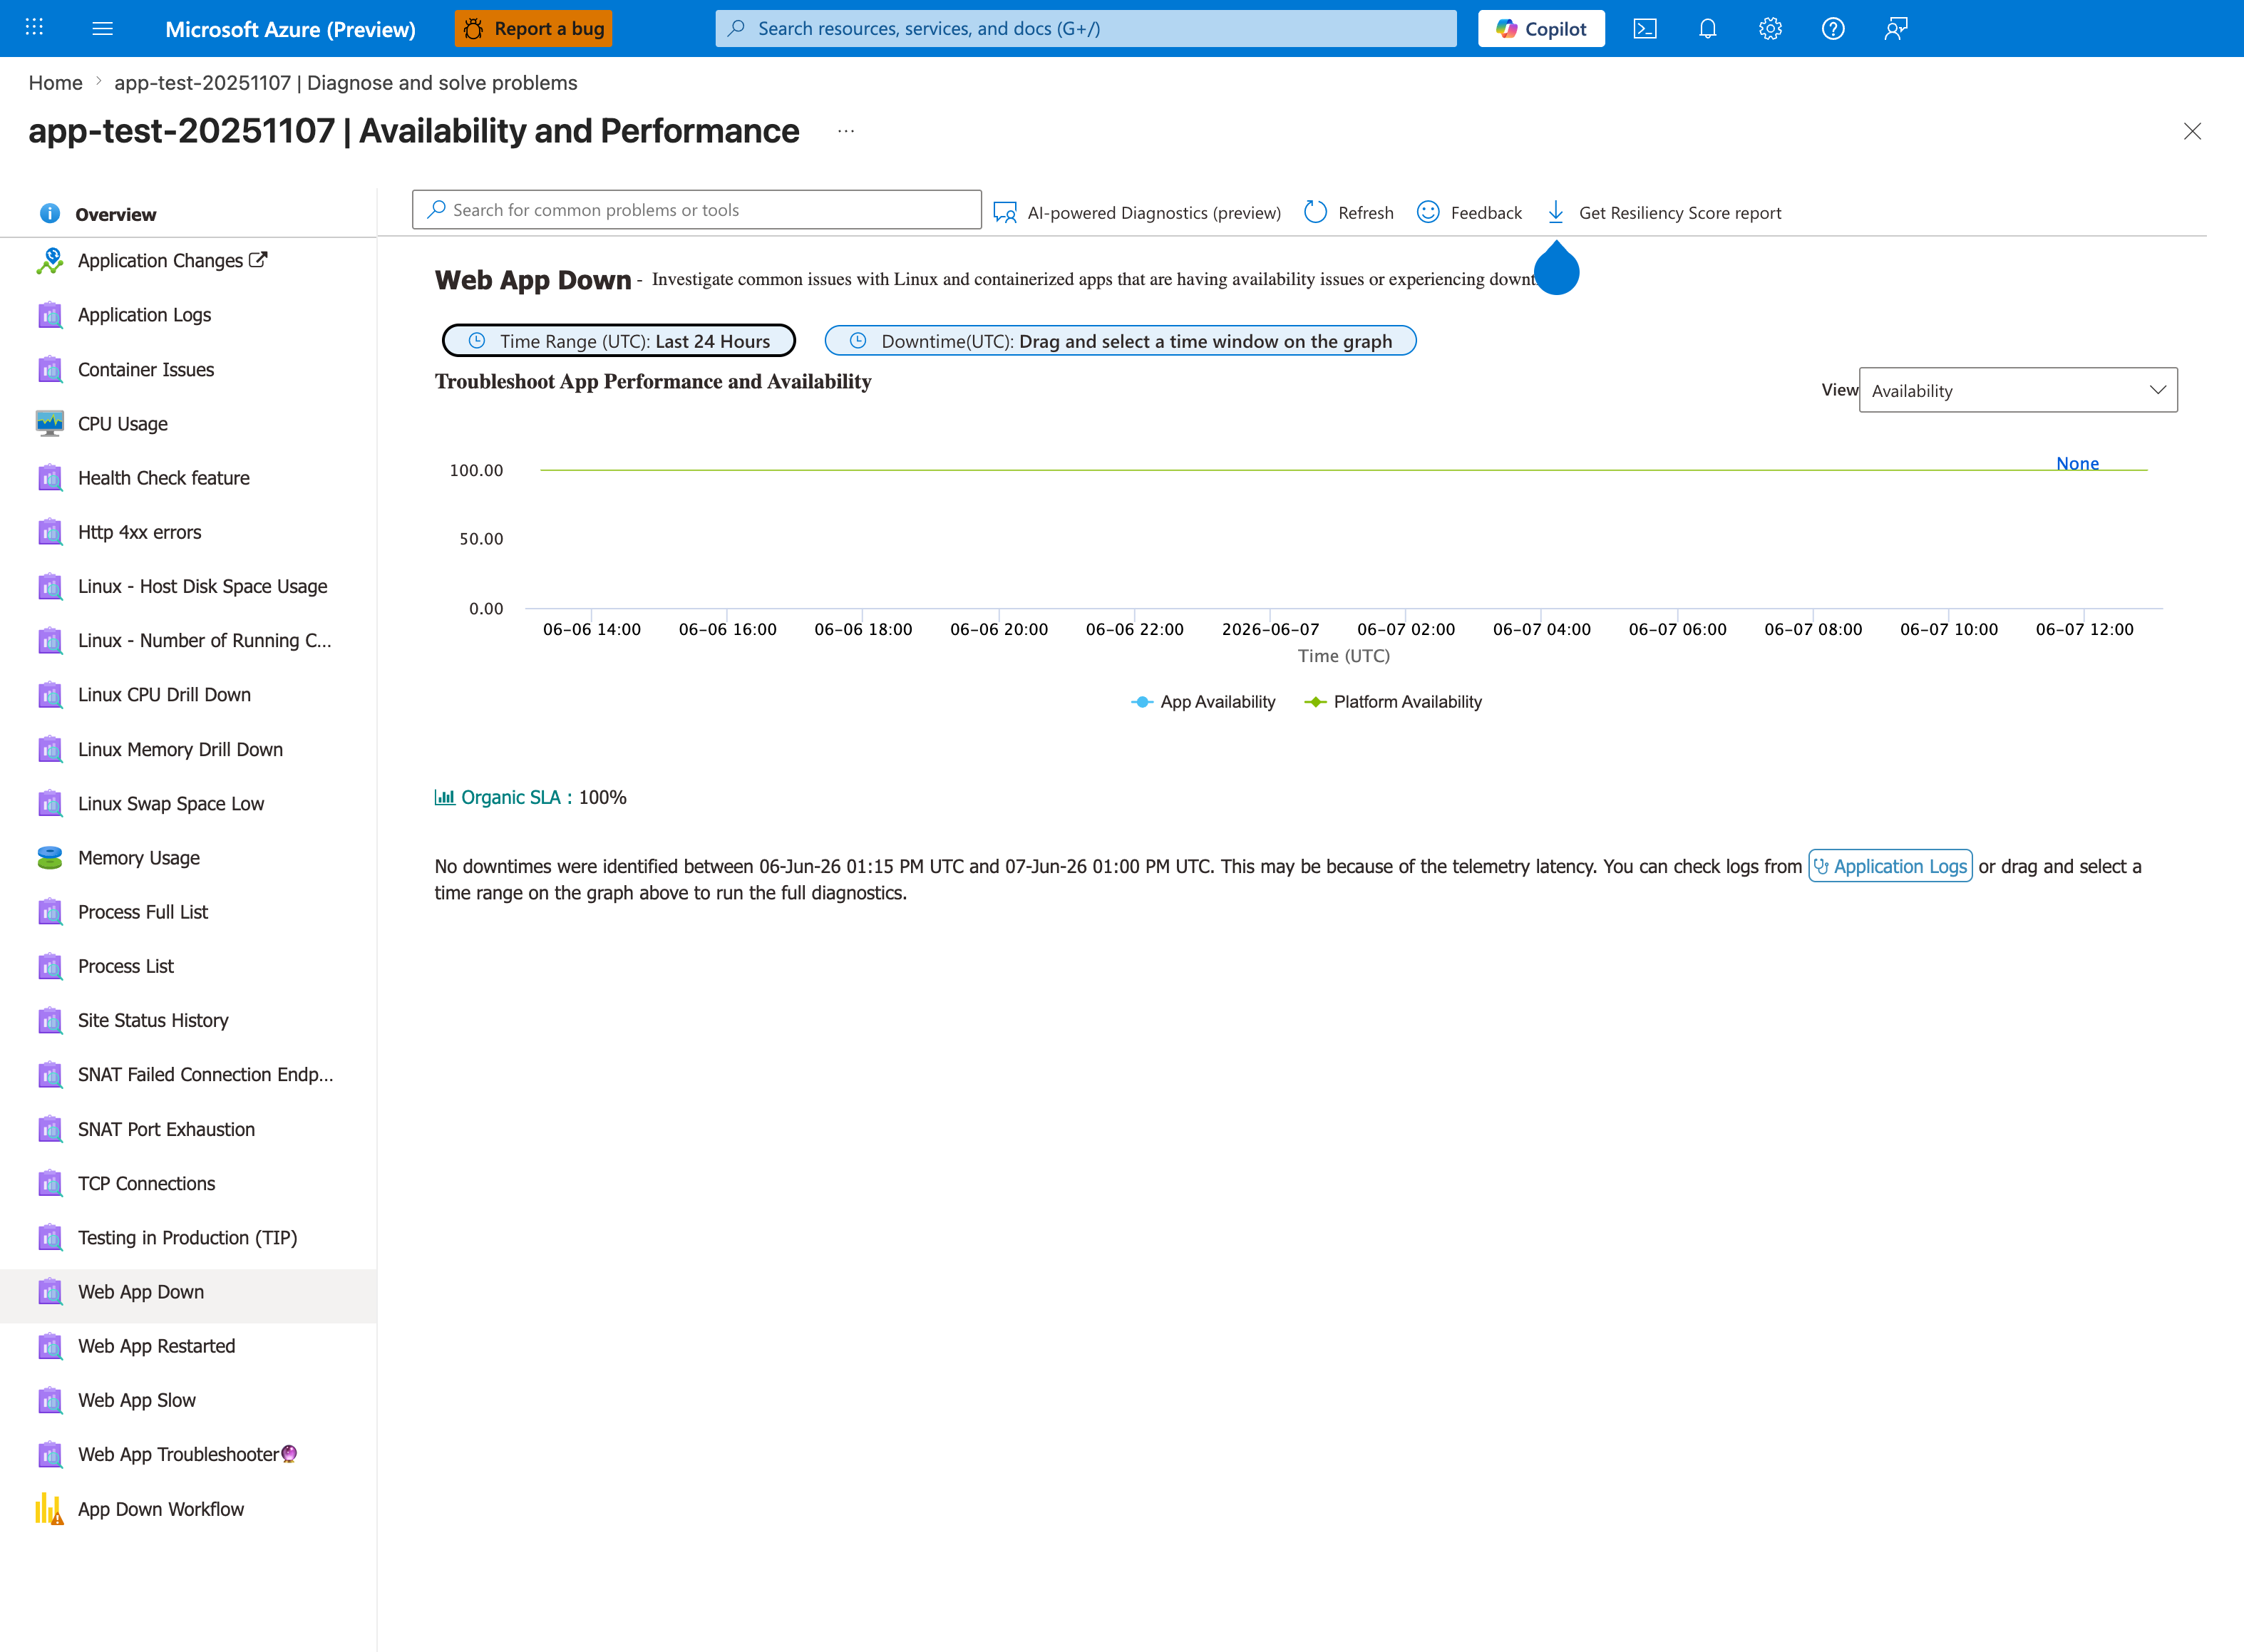
For "Failed to forward request" symptoms, run this detector first to disambiguate the failure layer. If App Availability is low but Platform Availability is high, the platform proxy is working but cannot reach your app process - exactly H1 (bind mismatch), H2 (port mismatch), or H6 (crash after bind) from Section 3. If both are low, you're not in this playbook's scope. Pair this with the Container Issues and Web App Restarted detectors in the left rail: Container Issues shows the explicit forwarding/proxy errors with ContainerId, and Web App Restarted reveals the post-bind crash loop pattern of H6. The 24-hour scope visible in the banner is the default - widen it via the detector's time picker if your incident is older.
Logs
AppServicePlatformLogs: look forOperationName,ContainerId,ResultDescriptionentries containing forward/proxy failuresAppServiceConsoleLogs: look for bind lines (0.0.0.0vs127.0.0.1), startup exceptions, protocol errors, middleware config errorsAppServiceHTTPLogs: correlate status code and latency around same timestamps
Platform Signals
- Confirm App Settings:
WEBSITES_PORT, startup command, and any middleware-related env vars - Confirm app server bind target uses
0.0.0.0and readsPORTcorrectly - Confirm whether custom image has nginx/caddy/traefik layer that proxies again before the app
- Compare with known startup-only signature in the "Container didn't respond to HTTP pings" playbook
5. Evidence to Collect
Required Evidence
AppServicePlatformLogsrows around incident time withOperationName,ContainerId,ResultDescriptionAppServiceConsoleLogsrows around incident time with startup/bind/proxy/crash traces (ResultDescription)AppServiceHTTPLogsrows showing request outcomes and latency (ScStatus,TimeTaken)- Current App Settings values:
WEBSITES_PORT, startup command - Container image metadata (tag/digest) and recent deployment timestamp
Useful Context
- Whether failures began after adding/changing nginx/caddy config in custom image
- Whether framework/runtime changed (Gunicorn/Uvicorn/Node reverse proxy config)
- Whether incident aligns with high cold-start or initialization work
- Any dependency/config import failures shortly after process startup
Sample Log Patterns
AppServicePlatformLogs (forwarding/startup-path failure indicators)
[AppServicePlatformLogs]
2026-04-04T11:26:10Z  Error          State: Stopping, Action: CancellingStartup, LastError: ContainerTimeout
2026-04-04T11:26:10Z  Error          Site container: <app-name> terminated during site startup.
2026-04-04T11:26:10Z  Informational  Container is terminated. Total time elapsed: 5773 ms.
2026-04-04T11:26:10Z  Informational  Site: <app-name> stopped.
AppServiceHTTPLogs (only SCM/API traffic, no app user traffic)
[AppServiceHTTPLogs]
2026-04-04T11:25:58Z  POST  /api/zipdeploy          202  183
2026-04-04T11:26:00Z  GET   /api/deployments/latest 200  41
2026-04-04T11:26:04Z  GET   /api/deployments/latest 200  37
AppServiceConsoleLogs (critical bind mistake to localhost)
[AppServiceConsoleLogs]
2026-04-04T11:25:50Z  Error  [2026-04-04 11:25:50 +0000] [1901] [INFO] Starting gunicorn 24.1.1
2026-04-04T11:25:50Z  Error  [2026-04-04 11:25:50 +0000] [1901] [INFO] Listening at: http://127.0.0.1:8000 (1901)
How to Read This
If the listener is 127.0.0.1, App Service middleware cannot forward external traffic into the container process. This is the highest-confidence signal for this playbook.
KQL Queries with Example Output
Query 1: Platform evidence for startup/forwarding path failure
// Platform events around failed forward/startup path
AppServicePlatformLogs
| where TimeGenerated between (datetime(2026-04-04 11:26:05) .. datetime(2026-04-04 11:26:12))
| where Message has_any ("CancellingStartup", "ContainerTimeout", "terminated during site startup", "Site:")
| project TimeGenerated, Level, Message
| order by TimeGenerated asc
Example Output:
| TimeGenerated | Level | Message |
|---|---|---|
| 2026-04-04 11:26:10 | Error | State: Stopping, Action: CancellingStartup, LastError: ContainerTimeout |
| 2026-04-04 11:26:10 | Error | Site container: |
| 2026-04-04 11:26:10 | Informational | Container is terminated. Total time elapsed: 5773 ms. |
| 2026-04-04 11:26:10 | Informational | Site: |
How to Read This
This sequence confirms the platform gave up waiting for a forwardable/ready endpoint and shut down startup.
Query 2: Detect absence of end-user app requests
// Request visibility check: SCM-only traffic indicates app not receiving user requests
AppServiceHTTPLogs
| where TimeGenerated between (datetime(2026-04-04 11:25:50) .. datetime(2026-04-04 11:26:20))
| project TimeGenerated, CsMethod, CsUriStem, ScStatus, TimeTaken
| order by TimeGenerated asc
Example Output:
| TimeGenerated | CsMethod | CsUriStem | ScStatus | TimeTaken |
|---|---|---|---|---|
| 2026-04-04 11:25:58 | POST | /api/zipdeploy | 202 | 183 |
| 2026-04-04 11:26:00 | GET | /api/deployments/latest | 200 | 41 |
| 2026-04-04 11:26:04 | GET | /api/deployments/latest | 200 | 37 |
How to Read This
Seeing only deployment/SCM endpoints (and no /, /api/* app routes) means requests are not reaching the app process path.
Query 3: Bind-address confirmation from console logs
// Confirm bind target from startup logs
AppServiceConsoleLogs
| where TimeGenerated between (datetime(2026-04-04 11:25:45) .. datetime(2026-04-04 11:26:05))
| where ResultDescription has_any ("Listening at", "127.0.0.1", "0.0.0.0")
| project TimeGenerated, Level, ResultDescription
| order by TimeGenerated asc
Example Output:
| TimeGenerated | Level | ResultDescription |
|---|---|---|
| 2026-04-04 11:25:50 | Error | [2026-04-04 11:25:50 +0000] [1901] [INFO] Listening at: http://127.0.0.1:8000 (1901) |
How to Read This
Any localhost bind during startup is abnormal for App Service Linux. Expected value is 0.0.0.0:<port>.
CLI Investigation Commands
# Verify app and host runtime state
az webapp show --resource-group <resource-group> --name <app-name> --query "{state:state,enabled:enabled,defaultHostName:defaultHostName}" --output table

# Verify startup command and runtime configuration
az webapp config show --resource-group <resource-group> --name <app-name> --query "{linuxFxVersion:linuxFxVersion,appCommandLine:appCommandLine,alwaysOn:alwaysOn}" --output table

# Verify forwarding-critical app settings
az webapp config appsettings list --resource-group <resource-group> --name <app-name> --query "[?name=='WEBSITES_PORT' || name=='WEBSITES_CONTAINER_START_TIME_LIMIT' || name=='WEBSITE_WARMUP_PATH'].{name:name,value:value}" --output table

# Confirm deployment succeeded while runtime failed
az webapp log deployment show --resource-group <resource-group> --name <app-name> --output table
Example Output:
State    Enabled    DefaultHostName
-------  ---------  -------------------------------------------
Running  True       <app-name>.azurewebsites.net

LinuxFxVersion    AppCommandLine                                  AlwaysOn
----------------  ----------------------------------------------  --------
PYTHON|3.11       gunicorn --bind 127.0.0.1:8000 src.app:app     True

Name                                   Value
-------------------------------------  ------
WEBSITES_PORT                          8000
WEBSITES_CONTAINER_START_TIME_LIMIT    230
WEBSITE_WARMUP_PATH                    /
How to Read This
In this output, the root problem is visible directly: startup command binds to 127.0.0.1. Correct to 0.0.0.0 and retest forwarding.
6. Validation and Disproof by Hypothesis
H1: Bind/address mismatch (127.0.0.1 vs 0.0.0.0)
Signals that support
- Console logs show listen host as
127.0.0.1:<port>orlocalhost:<port> - Runtime forward failures occur while process appears running
- Typical framework defaults are in use (Flask/Django dev server)
Signals that weaken
- Logs clearly show bind to
0.0.0.0:<port> - Requests succeed after container start and no forwarding errors recur
What to verify
- Inspect startup command and framework bind options.
- Ensure bind host is
0.0.0.0. - Restart and verify platform logs no longer show forwarding failures.
H2: Port mismatch (WEBSITES_PORT vs actual listen port)
Signals that support
WEBSITES_PORTis set (for example8080) but app logs show different listen port (for example8000)- Platform forwards to expected port while container listens elsewhere
Signals that weaken
- Logs and settings consistently show same port
- Requests on that port succeed with normal latency
What to verify
- Read current
WEBSITES_PORTfrom app settings. - Identify actual app listen port from console logs.
- Align config and code to one port target.
H3: Protocol/path mismatch (HTTP/2/WebSocket expectations)
Signals that support
- Errors appear only on upgraded connections or specific routes
- Console logs show protocol handshake or upgrade failures
- Middleware/app explicitly requires HTTP/2 behavior on internal hop
Signals that weaken
- Failures occur on plain HTTP endpoints as well
- No protocol or upgrade errors in logs
What to verify
- Test plain HTTP/1.1 endpoint behavior first.
- Validate framework reverse-proxy settings and upgrade handling.
- Confirm no forced protocol mode that breaks internal proxy path.
H4: Double-proxy conflict (custom nginx/caddy + platform proxy)
Signals that support
- Custom container has nginx/caddy in front of app process
- Proxy config rewrites or upstream targets point to wrong host/port
- Failures began after middleware config change
Signals that weaken
- Single-process server deployment without extra middleware layer
- No custom proxy config changes around incident
What to verify
- Review middleware config for upstream host/port and rewrite rules.
- Ensure internal upstream points to correct app listener (
0.0.0.0:<port>or expected local upstream). - Temporarily bypass user middleware (if possible) to isolate issue.
H5: Slow first response / timeout before forward succeeds
Signals that support
- High
TimeTakeninAppServiceHTTPLogsbefore failures - Console logs show long warm-up, dependency load, or blocking init
- Failures cluster after restart/deploy and reduce once warm
Signals that weaken
- Fast responses on healthy periods with no warm-up correlation
- Failure occurs immediately with crash trace
What to verify
- Compare restart/deploy timestamps with failure start.
- Check latency trend and timeouts in HTTP logs.
- Optimize startup path or adjust architecture to avoid blocking first response.
H6: Crash after bind, before handling first request
Signals that support
- Console shows bind/listen message followed by traceback/import/config error
- Platform logs show same
ContainerIdlifecycle ending quickly - Repeated container restarts with intermittent forward failures
Signals that weaken
- No crash traces and container uptime remains stable
- Errors persist without restart patterns
What to verify
- Correlate
ContainerIdin platform logs with console exceptions. - Fix import/runtime/config failures occurring after bind.
- Redeploy and verify stable request handling.
Normal vs Abnormal Comparison
| Signal | Normal Forwarding Path | Failed to Forward Request |
|---|---|---|
| App bind address | 0.0.0.0:<port> | 127.0.0.1:<port> or missing listener |
| HTTP logs | User routes present (/, /api/*) | SCM-only routes and no user-path requests |
| Platform logs | No forwarding errors, stable runtime | Startup cancellation, timeout, container termination |
| Latency profile | Route-dependent normal latency | Timeouts or missing request completion |
| Operational conclusion | Proxy can reach app process | Proxy path broken before app request handling |
Forwarding Failure Signal Matrix
| Signal | Healthy Runtime | Forwarding Failure Runtime |
|---|---|---|
| Startup command | --bind 0.0.0.0:<port> | --bind 127.0.0.1:<port> or missing bind |
| HTTP visibility | User routes + SCM routes | SCM routes only, no user routes |
| Platform lifecycle | Stable site/container state | CancellingStartup, timeout, early container termination |
| Primary fix path | Tune app logic/perf | Correct bind/port/proxy contract |
How to Read This
Use this matrix for first-pass triage: if user-path requests never appear and listener is localhost, skip deeper protocol analysis and fix bind/port first.
7. Likely Root Cause Patterns
- Pattern A: App binds to localhost (
127.0.0.1) due to framework default - Pattern B:
WEBSITES_PORTconfigured, but app binds to a different port - Pattern C: Custom nginx/caddy introduces misrouted upstream in double-proxy topology
- Pattern D: Runtime protocol assumptions (HTTP/2/WebSocket) mismatch effective internal proxy behavior
- Pattern E: App process crashes shortly after startup due to missing config/imports
- Pattern F: Slow initialization causes runtime forward timeouts around cold/restart windows
8. Immediate Mitigations
- Force app bind host to
0.0.0.0and restart (production-safe) - Align app listen port and
WEBSITES_PORTimmediately (production-safe) - Temporarily simplify path by removing or bypassing custom middleware layer for isolation (diagnostic; may alter behavior)
- Shift heavy initialization out of first request path (diagnostic/mitigation hybrid)
- Roll back to last known-good image tag if failures started after release (production-safe with rollback risk)
9. Prevention
- Standardize startup contract: app reads
PORT, binds0.0.0.0, and logs explicit listener target - Keep one clear proxy boundary; avoid unnecessary in-container reverse proxies unless required
- Add startup/runtime smoke tests in CI that validate first successful HTTP response in containerized runtime
- Harden protocol handling for WebSocket/upgrade paths through reverse proxies
- Add release guardrails: fail deployment if bind address/port or required config is invalid