Container Didn't Respond to HTTP Pings (Azure App Service Linux)
1. Summary
Symptom
The container starts but App Service reports "Container didn't respond to HTTP pings on port:
Why this scenario is confusing
Multiple unrelated issues produce the same error message. Port binding, startup time, health endpoint behavior, and base image issues can all manifest as "didn't respond to HTTP pings." The error message itself does not distinguish between these causes.
Troubleshooting decision flow
graph TD
    A[Symptom: Container didn't respond to HTTP pings] --> B{What to check first?}
    B --> C[Expected port != actual listen port]
    B --> D[Bound to 127.0.0.1/localhost]
    B --> E[Long init before first HTTP response]
    B --> F[Startup tracebacks or restart loop]
    C --> H1[H1: Port mismatch]
    D --> H2[H2: Binding to localhost]
    E --> H3[H3: Startup time exceeded]
    F --> H4[H4: Application crash during startup]
Limitations
- Windows-specific container behavior is out of scope
- This playbook covers custom containers and built-in Linux images; it does not cover App Service on Kubernetes
- Detailed framework-specific startup optimization is referenced but not exhaustively documented
Quick Conclusion
Treat this error as a startup reachability workflow, not a single failure mode. First align Linux port and bind behavior (PORT, WEBSITES_PORT, 0.0.0.0), then correlate platform timeout events with console startup logs to separate timeout from crash conditions. Linux startup behavior is more nuanced than a direct WEBSITES_PORT-equals-probe-target model. See Container HTTP Pings Lab for experimental evidence on Linux port behavior. Once the immediate issue is mitigated, harden startup commands and initialization behavior so every deployment responds to HTTP pings within the configured startup window.
2. Common Misreadings
- "The container crashed" (it may be running but listening on the wrong port)
- "The app is too slow to start" (it may be fast but binding to 127.0.0.1 instead of 0.0.0.0)
- "Health check is failing" (startup pings and configured health checks are different mechanisms)
- "The Dockerfile is wrong" (it may work locally but fail on App Service due to environment differences)
- "The platform is broken" (almost always an application or configuration issue)
3. Competing Hypotheses
- H1: Port or listener contract mismatch — the container listens on a different port or address than the Linux startup path actually reaches (
PORT,WEBSITES_PORT, bind address, or startup command drift) - H2: Binding to localhost — container binds to 127.0.0.1 instead of 0.0.0.0, so the platform health probe cannot reach it
- H3: Startup time exceeded — container takes longer than the startup time limit (WEBSITES_CONTAINER_START_TIME_LIMIT, default 230 seconds) to begin responding to HTTP
- H4: Application crash during startup — container process exits or enters an error loop before it can respond to any HTTP request
- H5: Missing or incorrect startup command — CMD/ENTRYPOINT issue where the web server never actually starts
4. What to Check First
Metrics
- Linux - Number of Running Containers detector (is the container actually running?)
- Restart count (is the platform killing and restarting the container repeatedly?)
Portal view: Web App Down detector (the first signal for HTTP ping failures)
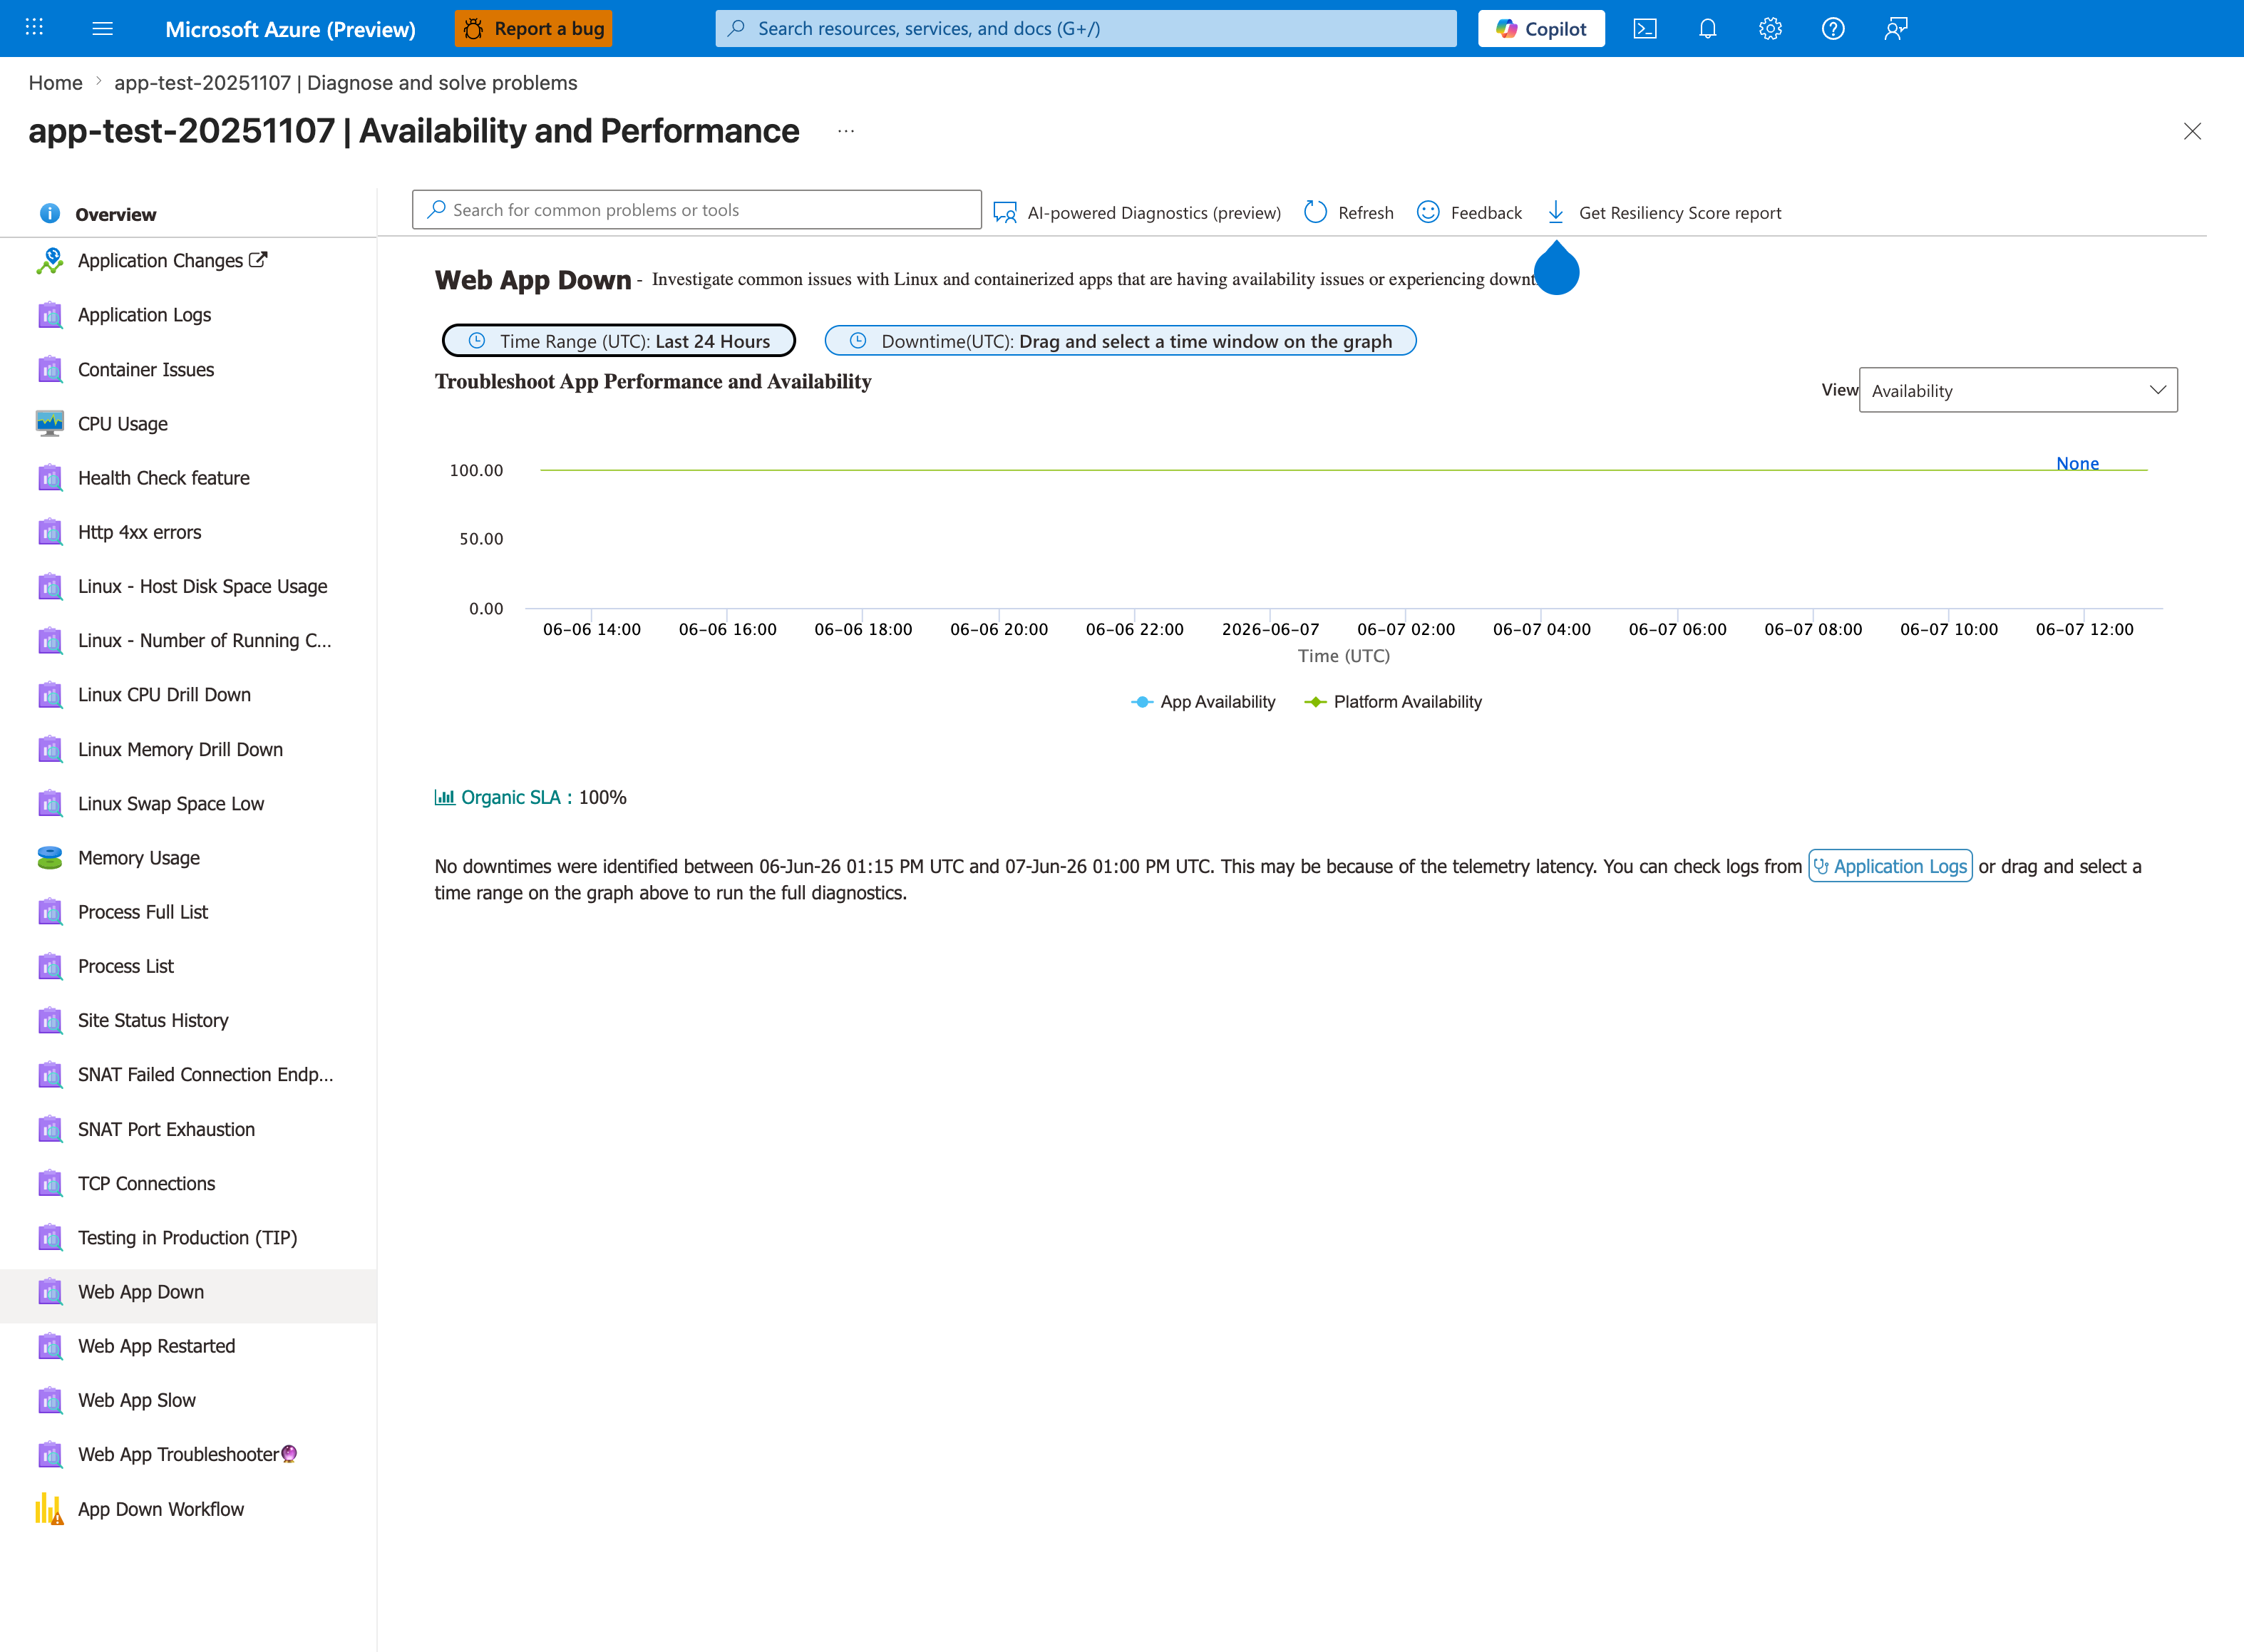
This is the detector to open first when the symptom is "Container didn't respond to HTTP pings". The two KPIs distinguish the failure surface: if App Availability is low but Platform Availability is 100%, the container itself is the problem - container is running but never reaches probe-readiness, which is exactly this playbook's scope. If Platform Availability is also low, the issue is upstream of the container and this playbook doesn't apply. The left-rail siblings - especially Container Issues and Web App Restarted - are the next detectors to open: Container Issues surfaces ping failure messages and exit codes directly, and Web App Restarted exposes the restart-loop pattern that H4 (application crash during startup) produces.
Logs
- AppServiceConsoleLogs: stdout/stderr from the container — look for listen port, binding address, startup errors, crash traces
- AppServicePlatformLogs: platform-level events — "Container started", "Container failed to start", "Stopping site because it failed to start"
Platform Signals
WEBSITES_PORTapp setting value (custom-container port configuration input).PORTenvironment variable (runtime-injected into the container and usually the value the app should bind to).- WEBSITES_CONTAINER_START_TIME_LIMIT value
- Startup command configuration in Azure Portal
- Docker log stream (Log stream blade in Portal)
Portal view: Log stream (live container stdout/stderr)
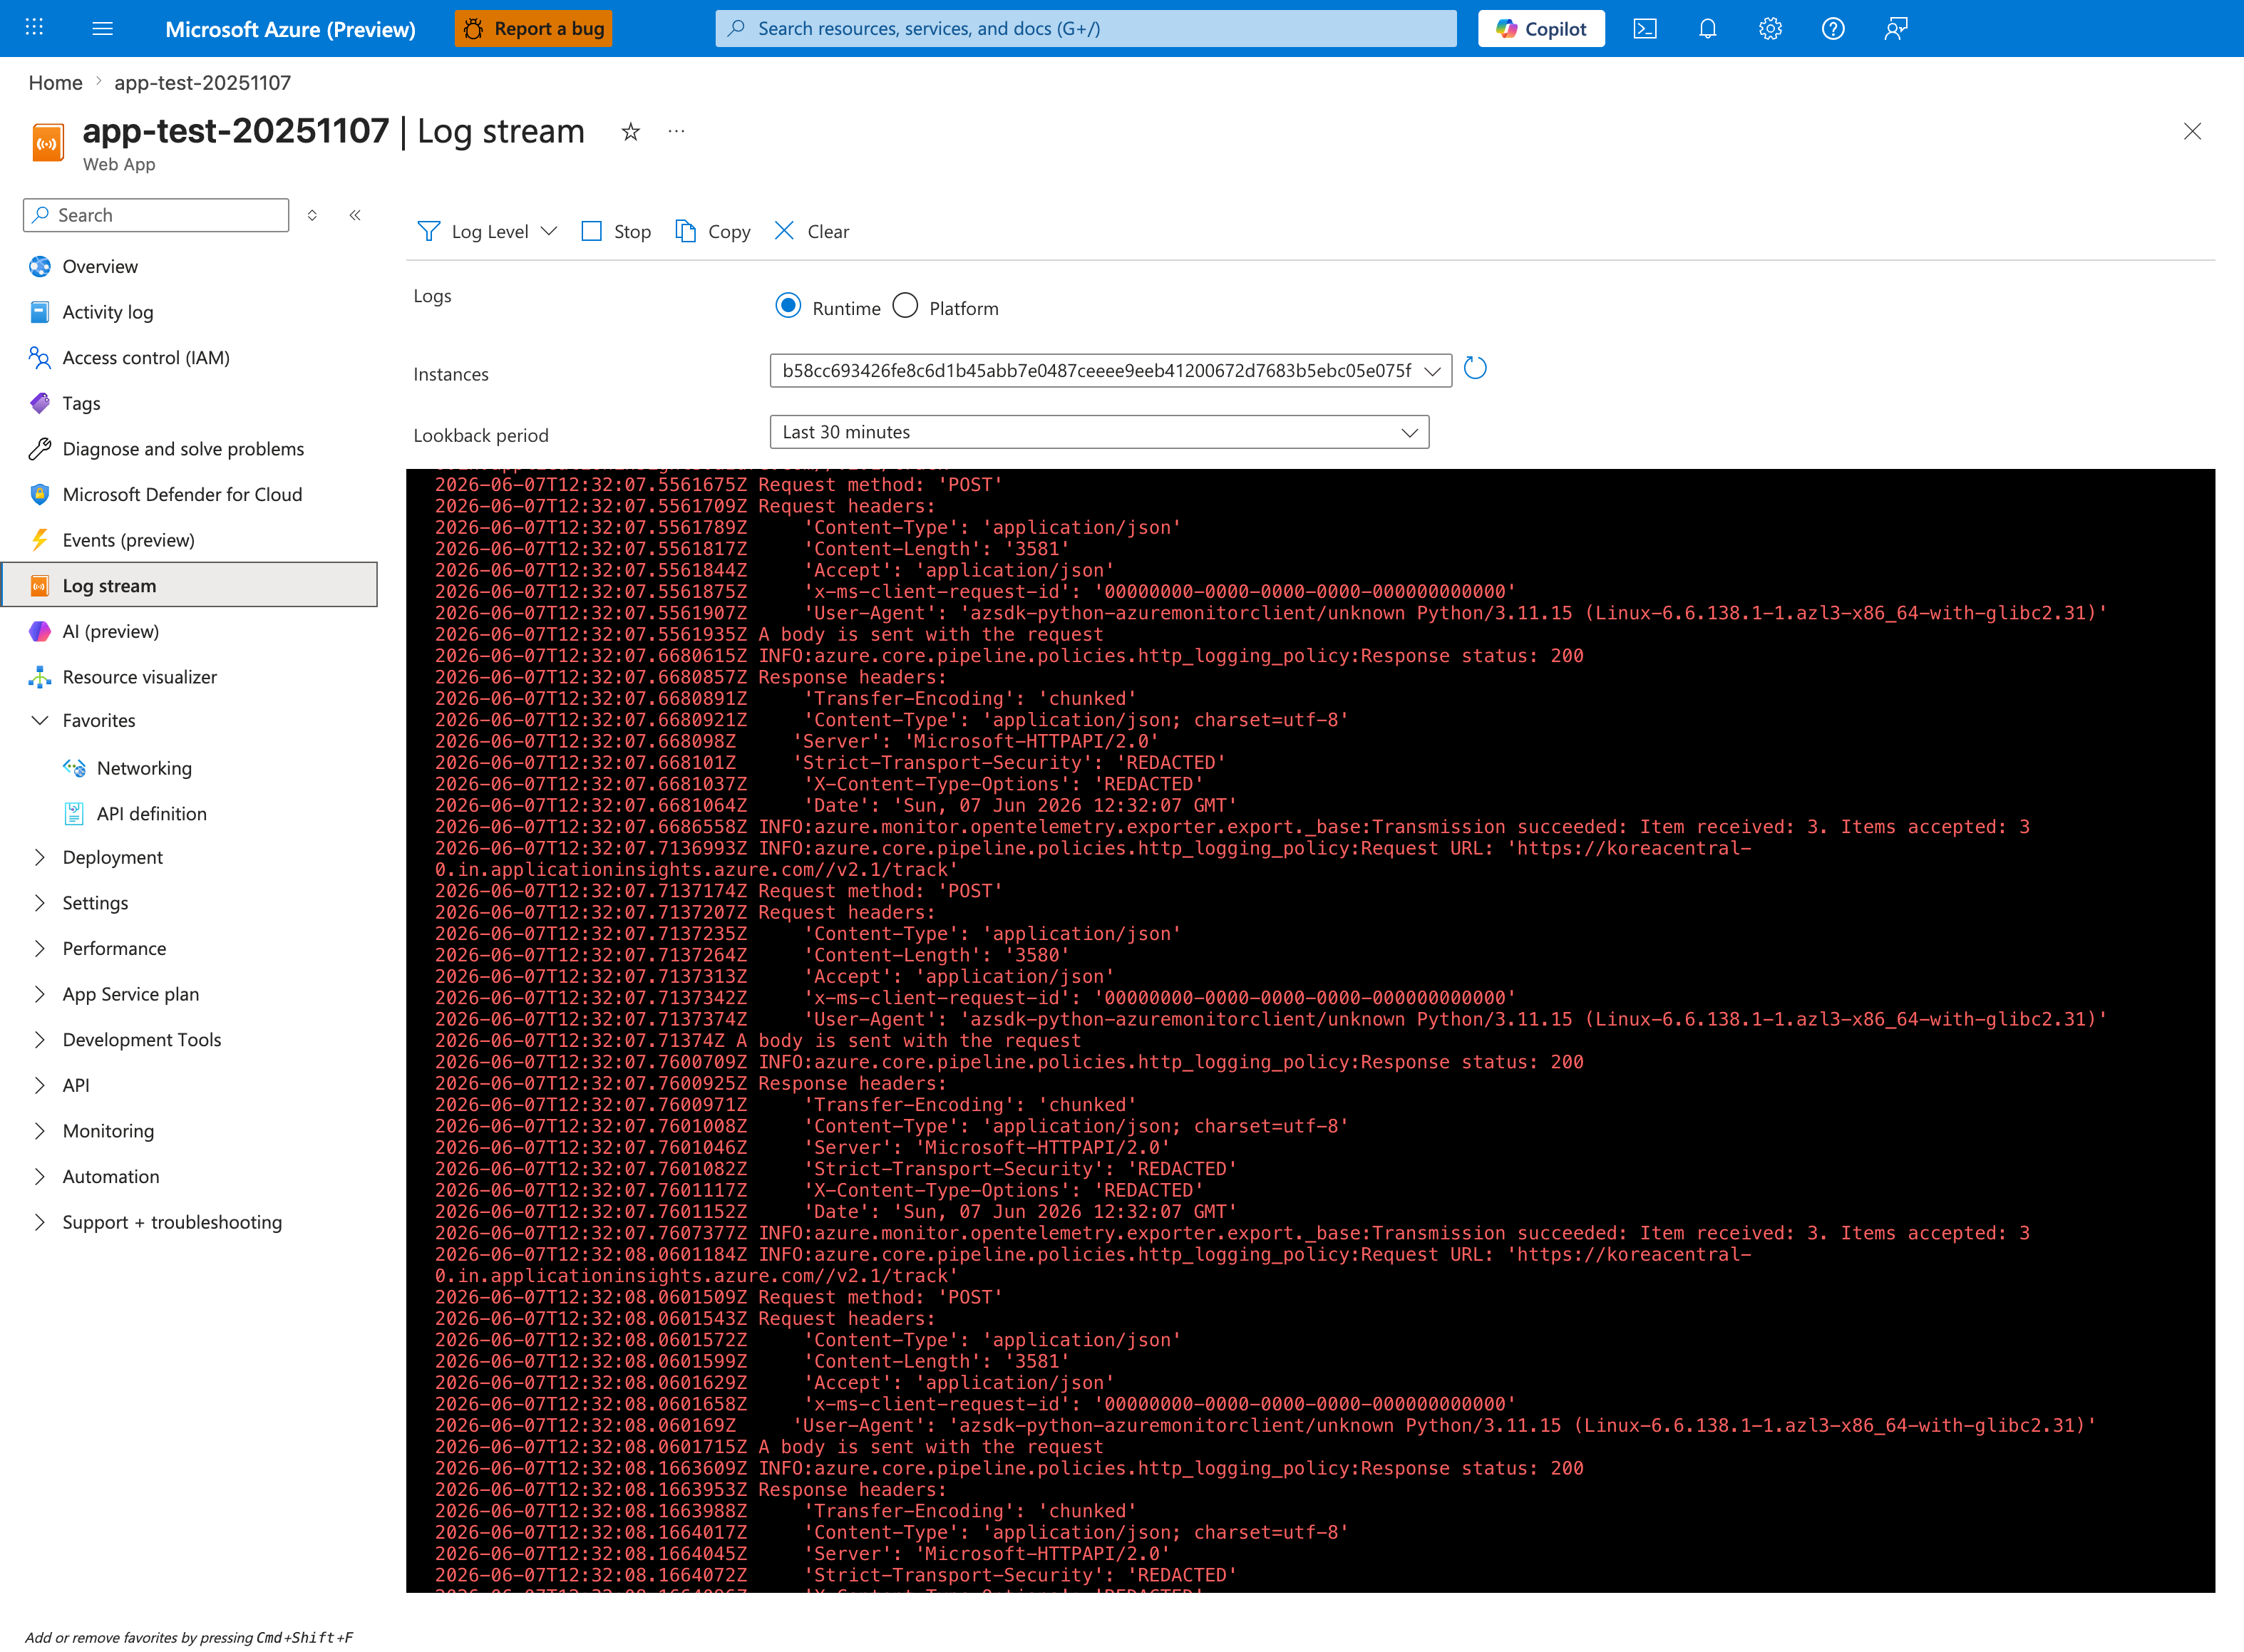
For HTTP ping failures, Log stream is the fastest way to see whether your application process even reaches a bind line. With the Runtime radio shown selected (the alternative is Platform), watch in real-time during a restart - you should see Gunicorn/Uvicorn/Node/Java startup banners followed by a Listening at: http://0.0.0.0:<port> line. If those lines never appear before the container terminates, you're in H4 (application crash) or H5 (missing startup command) territory. If they appear with 127.0.0.1, you're in H2 (localhost bind). If they appear but the port doesn't match WEBSITES_PORT, you're in H1 (port mismatch). The OpenTelemetry exporter lines visible here are normal background telemetry noise - filter past them to find the actual app startup output.
5. Evidence to Collect
Required Evidence
- Container console output during startup (AppServiceConsoleLogs)
- Platform events during startup (AppServicePlatformLogs)
- App settings:
WEBSITES_PORT,WEBSITES_CONTAINER_START_TIME_LIMIT(and confirm app code readsPORTfor listen target) - Dockerfile: EXPOSE directive, CMD/ENTRYPOINT
- Whether the app starts successfully locally with
docker run -p 8000:8000 <image>
Useful Context
- Recent image changes
- Recent app setting changes
- Custom startup command configuration
- Base image changes
- Multi-stage build configuration
CLI Investigation Commands
# Check overall app state
az webapp show --resource-group <resource-group> --name <app-name> --query "{state:state,enabled:enabled,defaultHostName:defaultHostName}" --output table

# Verify startup-critical settings
az webapp config appsettings list --resource-group <resource-group> --name <app-name> --query "[?name=='WEBSITES_PORT' || name=='WEBSITES_CONTAINER_START_TIME_LIMIT' || name=='WEBSITE_WARMUP_PATH' || name=='WEBSITE_WARMUP_STATUSES'].{name:name,value:value}" --output table

# Inspect startup command/runtime
az webapp config show --resource-group <resource-group> --name <app-name> --query "{linuxFxVersion:linuxFxVersion,appCommandLine:appCommandLine,http20Enabled:http20Enabled}" --output table

# Stream live logs while reproducing ping failures
az webapp log tail --resource-group <resource-group> --name <app-name>
Example Output:
State    Enabled    DefaultHostName
-------  ---------  -------------------------------------------
Running  True       <app-name>.azurewebsites.net

Name                                   Value
-------------------------------------  ------
WEBSITES_PORT                          8000
WEBSITES_CONTAINER_START_TIME_LIMIT    230
WEBSITE_WARMUP_PATH                    /diag/env
WEBSITE_WARMUP_STATUSES                200

LinuxFxVersion    AppCommandLine                               Http20Enabled
----------------  -------------------------------------------  -------------
PYTHON|3.11       gunicorn --bind 0.0.0.0:8000 src.app:app    True
How to Read This
If settings and bind are aligned but startup pings still fail intermittently, investigate startup duration variance, heavy initialization, and recycle timing rather than port/address first.
Sample Log Patterns
AppServiceConsoleLogs (container process did start)
[AppServiceConsoleLogs]
2026-04-04T11:14:04Z  Informational  WARNING: Could not find package directory /home/site/wwwroot/__oryx_packages__.
2026-04-04T11:14:08Z  Error          [2026-04-04 11:14:08 +0000] [1891] [INFO] Starting gunicorn 24.1.1
2026-04-04T11:14:08Z  Error          [2026-04-04 11:14:08 +0000] [1891] [INFO] Listening at: http://0.0.0.0:8000 (1891)
2026-04-04T11:14:08Z  Error          [2026-04-04 11:14:08 +0000] [1892] [INFO] Booting worker with pid: 1892
AppServiceHTTPLogs (app became reachable when healthy)
[AppServiceHTTPLogs]
2026-04-04T11:21:55Z  GET  /           200  20
2026-04-04T11:23:03Z  GET  /diag/env   200  6
2026-04-04T11:23:03Z  GET  /diag/stats 200  23
AppServicePlatformLogs (lifecycle stop sequence)
[AppServicePlatformLogs]
2026-04-04T11:14:31Z  Informational  State: Stopping, Action: StoppingSiteContainers
2026-04-04T11:14:36Z  Informational  Container is terminated. Total time elapsed: 5469 ms.
2026-04-04T11:14:36Z  Informational  Site: <app-name> stopped.
How to Read This
This pattern shows the process can start and respond (200 responses exist), so this incident class is usually intermittent startup reachability/configuration drift, not a permanent app boot failure.
KQL Queries with Example Output
Query 1: Confirm the app process bound to an externally reachable address
// Look for bind/listen signatures from the app process
AppServiceConsoleLogs
| where TimeGenerated between (datetime(2026-04-04 11:14:00) .. datetime(2026-04-04 11:14:10))
| where ResultDescription has_any ("Starting gunicorn", "Listening at", "Booting worker", "127.0.0.1", "0.0.0.0")
| project TimeGenerated, Level, ResultDescription
| order by TimeGenerated asc
Example Output:
| TimeGenerated | Level | ResultDescription |
|---|---|---|
| 2026-04-04 11:14:08 | Error | [2026-04-04 11:14:08 +0000] [1891] [INFO] Starting gunicorn 24.1.1 |
| 2026-04-04 11:14:08 | Error | [2026-04-04 11:14:08 +0000] [1891] [INFO] Listening at: http://0.0.0.0:8000 (1891) |
| 2026-04-04 11:14:08 | Error | [2026-04-04 11:14:08 +0000] [1892] [INFO] Booting worker with pid: 1892 |
How to Read This
0.0.0.0:8000 means bind-address itself is correct in this sample. If the same query shows 127.0.0.1, prioritize H2 immediately.
Query 2: Validate endpoint responses and latency once startup succeeds
// Validate post-start endpoint health and latency
AppServiceHTTPLogs
| where TimeGenerated between (datetime(2026-04-04 11:21:50) .. datetime(2026-04-04 11:23:10))
| project TimeGenerated, CsMethod, CsUriStem, ScStatus, TimeTaken
| order by TimeGenerated asc
Example Output:
| TimeGenerated | CsMethod | CsUriStem | ScStatus | TimeTaken |
|---|---|---|---|---|
| 2026-04-04 11:21:55 | GET | / | 200 | 20 |
| 2026-04-04 11:23:03 | GET | /diag/env | 200 | 6 |
| 2026-04-04 11:23:03 | GET | /diag/stats | 200 | 23 |
How to Read This
Low-latency 200 responses indicate successful readiness after startup. If incident windows show no rows or repeated 503, compare to startup timeout signatures from platform logs.
Query 3: Platform stop timeline around startup investigation
// Correlate stop actions and container termination timing
AppServicePlatformLogs
| where TimeGenerated between (datetime(2026-04-04 11:14:30) .. datetime(2026-04-04 11:14:40))
| where Message has_any ("StoppingSiteContainers", "Container is terminated", "Site:")
| project TimeGenerated, Level, Message
| order by TimeGenerated asc
Example Output:
| TimeGenerated | Level | Message |
|---|---|---|
| 2026-04-04 11:14:31 | Informational | State: Stopping, Action: StoppingSiteContainers |
| 2026-04-04 11:14:36 | Informational | Container is terminated. Total time elapsed: 5469 ms. |
| 2026-04-04 11:14:36 | Informational | Site: |
How to Read This
Use this timeline to separate operator/platform restarts from startup probe failures. A short terminate window usually indicates a controlled stop, not a long startup timeout.
Incident timeline template (copy into case notes)
| Timestamp (UTC) | Source | Signal | Interpretation |
|---|---|---|---|
| 2026-04-04 11:14:08 | AppServiceConsoleLogs | Listening at: http://0.0.0.0:8000 | Process reached listener state |
| 2026-04-04 11:14:31 | AppServicePlatformLogs | StoppingSiteContainers | Platform/operator initiated stop |
| 2026-04-04 11:14:36 | AppServicePlatformLogs | Container is terminated. Total time elapsed: 5469 ms. | Controlled stop completed |
| 2026-04-04 11:21:55 | AppServiceHTTPLogs | GET / 200 | App reachable post-restart |
| 2026-04-04 11:23:03 | AppServiceHTTPLogs | GET /diag/env 200 | Diagnostics endpoint healthy |
How to Read This
Build the timeline first, then classify by hypothesis. Misclassification usually happens when teams inspect only one data source (for example, just console logs without platform lifecycle context).
Fast Verification Query (Post-fix)
// Verify that startup window now returns successful responses
AppServiceHTTPLogs
| where TimeGenerated > ago(15m)
| where CsUriStem in ("/", "/diag/env", "/diag/stats")
| summarize Requests=count(), Errors=countif(ScStatus >= 500), P95=percentile(TimeTaken, 95) by CsUriStem
| order by CsUriStem asc
Example Output:
| CsUriStem | Requests | Errors | P95 |
|---|---|---|---|
| / | 42 | 0 | 38 |
| /diag/env | 42 | 0 | 16 |
| /diag/stats | 42 | 0 | 44 |
How to Read This
This confirms remediation only when Errors stays at zero during fresh restarts and P95 remains below your startup SLO.
6. Validation and Disproof by Hypothesis
H1: Port mismatch
Signals that support
- AppServiceConsoleLogs show a concrete listen line such as
Listening on 8000whileWEBSITES_PORT=8080. - Platform logs repeatedly show startup ping failure on one port while app logs indicate another port.
- App works locally only when mapped to a non-8080 container port (for example
-p 8080:8000).
Signals that weaken
- Console and app settings both consistently show the same port.
- Manual request to the expected in-container port succeeds during SSH investigation.
What to verify
- In App Service configuration, record
WEBSITES_PORTandPORT. - In AppServiceConsoleLogs, identify the actual listen port emitted by the server startup line.
- Compare expected vs actual port; if different, align to a single value and restart.
- Re-check AppServicePlatformLogs for successful transition after the change.
H2: Binding to localhost
Signals that support
- Console logs show bind target
127.0.0.1:<port>orlocalhost:<port>. - Framework defaults are in use (for example Flask dev server) without explicit host override.
- Process is running but startup pings still fail, indicating network reachability problem rather than process absence.
Signals that weaken
- Logs explicitly show
0.0.0.0:<port>binding. - A known-good production server command (for example Gunicorn bound to
0.0.0.0) is in effect.
What to verify
- Inspect startup logs for exact bind address.
- Inspect startup command (Dockerfile CMD/ENTRYPOINT or Portal startup command) for host argument.
- Ensure production command binds to
0.0.0.0. - Redeploy/restart and confirm startup ping success in platform logs.
H3: Startup time exceeded
Signals that support
- Console logs show long-running initialization (dependency download, migrations, model load) before server starts listening.
- AppServicePlatformLogs show
Container startedfollowed by timeout/failing site start near or beyond the default 230 seconds. - Increasing
WEBSITES_CONTAINER_START_TIME_LIMITimproves startup success rate.
Signals that weaken
- App reaches a listen state quickly (<30 seconds) before the failure occurs.
- Failure happens immediately with explicit crash output rather than timeout behavior.
What to verify
- Measure elapsed time between first platform start event and failing site start event.
- Locate server-ready timestamp in AppServiceConsoleLogs.
- If startup duration exceeds current limit, temporarily set
WEBSITES_CONTAINER_START_TIME_LIMITto 300-600 (up to 1800 max). - Confirm whether timeout errors disappear; if yes, optimize startup path and keep a justified limit.
H4: Application crash during startup
Signals that support
- AppServiceConsoleLogs show traceback/exception, segmentation fault, missing module, or fatal config error.
- AppServicePlatformLogs show repeated start/exit cycles.
- Exit code appears in logs or detector output and indicates non-zero termination.
Signals that weaken
- No crash signatures appear and process remains alive.
- Failure pattern matches timeout without process termination.
What to verify
- Capture full startup stderr/stdout from AppServiceConsoleLogs.
- Correlate each platform restart event with preceding exception traces.
- Validate image dependency completeness and runtime configuration required at startup.
- Fix startup exception, redeploy, and confirm stable single-start behavior.
H5: Missing or incorrect startup command
Signals that support
- Console logs are empty, minimal, or show a process that is not an HTTP server.
- Startup command in Portal overrides Dockerfile CMD with invalid or no-op command.
- CMD/ENTRYPOINT references missing script path or wrong working directory.
Signals that weaken
- Command clearly launches a web server binary with correct arguments.
- Logs show web server startup sequence and port bind attempt.
What to verify
- Inspect Dockerfile
CMDandENTRYPOINTexactly as built into deployed image. - Check Azure Portal startup command override and remove/fix conflicting values.
- Validate command path inside container (via SSH/Kudu) and confirm executable exists.
- Restart app and confirm logs show expected web server process listening.
Normal vs Abnormal Comparison
| Signal | Normal | Container Didn't Respond to HTTP Pings |
|---|---|---|
| Console bind line | Listening at: http://0.0.0.0:<port> appears quickly | Missing bind line, wrong bind (127.0.0.1), or very delayed bind |
| HTTP logs during startup window | Early 200 on warm-up or / | No responses before timeout or repeated startup-phase failures |
| Platform logs | Site started/steady run | Timeout/stop cycle or repeated startup retries |
| TimeTaken pattern | Low to moderate, variable by route | Near timeout limit if probe waits then fails |
| Operational impact | Availability restored after deploy/restart | App remains unavailable until port/bind/startup issue fixed |
Extended Triage Matrix
| Observation in Incident Window | Most Likely Hypothesis | Next Command / Query | Immediate Action |
|---|---|---|---|
Listening at: http://127.0.0.1:<port> | H2 (localhost bind) | AppServiceConsoleLogs bind query | Change bind host to 0.0.0.0 and restart |
WEBSITES_PORT=8080, logs show :8000 | H1 (port mismatch) | az webapp config appsettings list ... | Align port in app and setting |
| No listen line before timeout | H3 or H5 | Console + platform startup sequence | Increase timeout temporarily and verify command path |
| Traceback before listener | H4 | Console error query | Fix startup exception and redeploy |
| Healthy bind + healthy settings + intermittent failures | H3 (startup variance) | Latency trend around restarts | Reduce initialization work on startup |
Normal vs Abnormal Endpoint Examples
| Endpoint | Healthy Startup Example | Startup Ping Failure Example |
|---|---|---|
/ | 200, TimeTaken 20-150 ms | Missing row or 503 near startup timeout |
/diag/env | 200, TimeTaken <20 ms | Missing row or delayed first success |
/diag/stats | 200, TimeTaken <50 ms | Missing row during startup/restart loop |
Warm-up path (WEBSITE_WARMUP_PATH) | Responds with approved status (200 or 202) | Returns non-approved status or not served in time |
7. Likely Root Cause Patterns
- Pattern A: Framework defaults to localhost binding (Flask dev server, Django runserver)
- Pattern B: Missing WEBSITES_PORT setting when app doesn't listen on 8080
- Pattern C: Heavy initialization (ML model loading, database migrations) exceeding startup timeout
- Pattern D: Missing dependency in container image (works locally with cached layers, fails on fresh pull)
- Pattern E: Startup command references a file path that doesn't exist in the container
8. Immediate Mitigations
- Set WEBSITES_PORT to match your app's actual listen port (diagnostic, production-safe)
- Change app binding from 127.0.0.1 to 0.0.0.0 (diagnostic, production-safe)
- Increase WEBSITES_CONTAINER_START_TIME_LIMIT to 300-600 (temporary, production-safe)
- SSH into the container via Kudu to verify the process is running and listening (diagnostic)
- Check docker run locally with the EXACT same environment variables (diagnostic)
9. Prevention
- Always bind to 0.0.0.0 in production configurations
- Use the
PORTenvironment variable for dynamic port binding, and setWEBSITES_PORTto match - Optimize startup time (lazy-load heavy dependencies, run migrations separately)
- Add a lightweight health endpoint that responds immediately even during warm-up
- Test with
docker run -e PORT=8080 -e WEBSITES_PORT=8080 -p 8080:8080locally before deploying
Investigation Notes
- App Service Linux probes the container on the configured port via HTTP. If no response within the startup time limit, the platform stops the site.
- The default expected port is 8080 for built-in images. Custom containers should set
WEBSITES_PORTexplicitly. WEBSITES_PORTis the app setting you configure;PORTis the environment variable the platform injects into the container. They serve different roles: setWEBSITES_PORTto tell the platform, and readPORTin your code for the listen target.- WEBSITES_CONTAINER_START_TIME_LIMIT default is 230 seconds. Maximum is 1800 seconds.
- The startup probe is NOT the same as a configured Health Check. The startup probe is a simple HTTP ping on the root port. Health Check uses a configured path and has different retry logic.
- For more advanced warm-up control,
WEBSITE_WARMUP_PATHlets you specify a custom path for startup probes, andWEBSITE_WARMUP_STATUSESlets you define which HTTP status codes count as successful warm-up responses (e.g.,200,202). - For Python apps: Gunicorn should use
--bind 0.0.0.0:$PORT. Flask dev server defaults to 127.0.0.1 which WILL fail. - For Node.js apps: Express should use
app.listen(process.env.PORT || 8080, '0.0.0.0'). - SSH into the running container: Azure Portal → App Service → Development Tools → SSH (or use Kudu at https://
.scm.azurewebsites.net)
See Also
Related Queries
../../kql/console/startup-errors.md../../kql/console/container-binding-errors.md../../kql/restarts/repeated-startup-attempts.md