Windows Filesystem Quotas and IIS Log Behaviors (Azure App Service Windows)
1. Summary
Symptom
Windows App Service apps intermittently fail with quota and write errors after days or weeks of normal operation. Common impact patterns include 503 responses, application write exceptions, slow responses before failure, deployment extraction failures, and logging interruptions. The incident usually starts when D:\home approaches the plan quota or when write-heavy workflows overload local temporary storage on one worker instance.
Why this scenario is confusing
The behavior mixes persistent and ephemeral storage semantics:
D:\homeis persistent and Azure Storage-backed for the app, so growth survives worker restarts and scale operations.D:\localis worker-local ephemeral disk, so files can disappear when the instance is recycled, moved, or replaced.D:\local\Tempis not automatically cleaned during the lifetime of the same worker instance.- IIS and app diagnostics can continue writing while traffic is normal, so quota pressure may appear unrelated to recent code changes.
Responders often restart the app, observe temporary recovery, and incorrectly assume root cause is fixed.
Troubleshooting decision flow (mermaid diagram)
graph TD
    A[Symptom: 503, write failures, or quota warnings] --> B{Is D:\\home near quota?}
    B -->|Yes| C{What grows fastest under D:\\home?}
    C -->|D:\\home\\LogFiles\\http| H1[H1: IIS HTTP logs filling D:\\home]
    C -->|D:\\home\\LogFiles\\Application| H2[H2: App logs and app files in persistent path]
    C -->|D:\\home\\LogFiles with W3SVC trace| H3[H3: FREB traces accumulating]
    C -->|D:\\home\\data\\SitePackages or old artifacts| H4[H4: Deployment artifacts consuming quota]
    C -->|Dumps and diagnostics folders| H5[H5: Diagnostic dumps consuming disk]
    B -->|No| D{Is D:\\local\\Temp growing rapidly on instance?}
    D -->|Yes| E[Temp lifecycle issue: local temp accumulation on active worker]
    D -->|No| F[Re-check competing bottlenecks and telemetry correlation]
    E --> G[Fix app temp path strategy and cleanup]
Limitations
- This playbook targets Azure App Service Windows workers and filesystem behavior.
- It focuses on quota, log growth, and temp-file pressure; it is not a deep IIS tuning guide.
- It assumes diagnostic logs are enabled and accessible through App Service diagnostics or Kudu.
- Host-level implementation details are abstracted by the platform and may not be fully visible.
Quick Conclusion
Treat the incident as a path-specific storage diagnosis, not a generic "disk full" event. Confirm whether pressure is in persistent D:\home (most often IIS, app logs, deployment remnants, or dumps) versus ephemeral D:\local\Temp (instance-local churn). Validate with Kudu filesystem evidence plus platform logs, then apply bounded retention and cleanup policies.
2. Common Misreadings
- "If I restart and errors stop, the root cause is gone." Persistent
D:\homegrowth usually remains. - "Only application files can fill quota." IIS HTTP logs and FREB traces can fill
D:\homeeven with stable app code. - "
D:\local\Tempis cleaned continuously by the platform." It is not auto-cleaned during the same instance lifetime. - "503 means CPU or memory only." Quota exhaustion and write failures can surface as
503and startup degradation. - "Scaling out always fixes disk pressure." Instance-local pressure may move, but persistent quota pressure follows the app.
- "Deployment succeeded, so no artifact risk." Old zip packages and extracted artifacts can still consume quota.
- "Windows and Linux paths are identical." They are not; Windows uses
D:\homeandD:\local, while Linux uses/homeand/tmp.
3. Competing Hypotheses
- H1: IIS HTTP logs filling D:\home (not rotated/cleaned)
- H2: Application writing large temp files to D:\home instead of D:\local
- H3: FREB traces enabled and accumulating
- H4: Deployment artifacts (old zip packages) consuming quota
- H5: Diagnostic dumps consuming disk space
4. What to Check First
Plan quota context
Confirm expected App Service filesystem quota by plan tier and current footprint.
| Plan context | Typical filesystem quota range (shared app storage) | Operational meaning |
|---|---|---|
| Lower tiers | ~250 MB to low-GB range | Quota can be reached quickly by logs and deployment artifacts |
| Standard/Premium families | Tens to hundreds of GB | Incident often appears after long retention windows |
| Larger Premium/Isolated profiles | Up to ~1 TB | Quota still finite; unbounded logs eventually fail |
Quota interpretation
Use the platform-reported quota for the specific plan and region as the source of truth. The practical range across plans is roughly 250 MB to 1 TB.
Fast storage split check
- Check whether failures reference
D:\home(persistent quota pressure) orD:\local\Temp(instance-local pressure). - Correlate first error timestamp with traffic spikes, deployment events, and logging configuration changes.
- Verify whether errors persist after restart. Persistent recurrence points to
D:\homeaccumulation.
Log path triage
- IIS HTTP logs:
D:\home\LogFiles\http - Application logs:
D:\home\LogFiles\Application - Failed Request Tracing (FREB): under
D:\home\LogFileswith IIS trace files - Deployment packages and artifacts: commonly under
D:\home\data\SitePackagesand deployment history locations - Diagnostic dumps: under app data and diagnostics folders beneath
D:\home
Kudu first look commands
Use Kudu API to get immediate size evidence before deleting anything.
az webapp deployment list-publishing-profiles --resource-group <resource-group> --name <app-name>
az webapp show --resource-group <resource-group> --name <app-name>
curl --request POST \
  --url "https://<app-name>.scm.azurewebsites.net/api/command" \
  --user "<kudu-user>:<kudu-password>" \
  --header "Content-Type: application/json" \
  --data '{"command":"powershell -NoProfile -Command \"Get-PSDrive -Name D | Select-Object Used,Free\"","dir":"site\\wwwroot"}'
Portal view: Logs blade for KQL investigation of disk-pressure error signatures
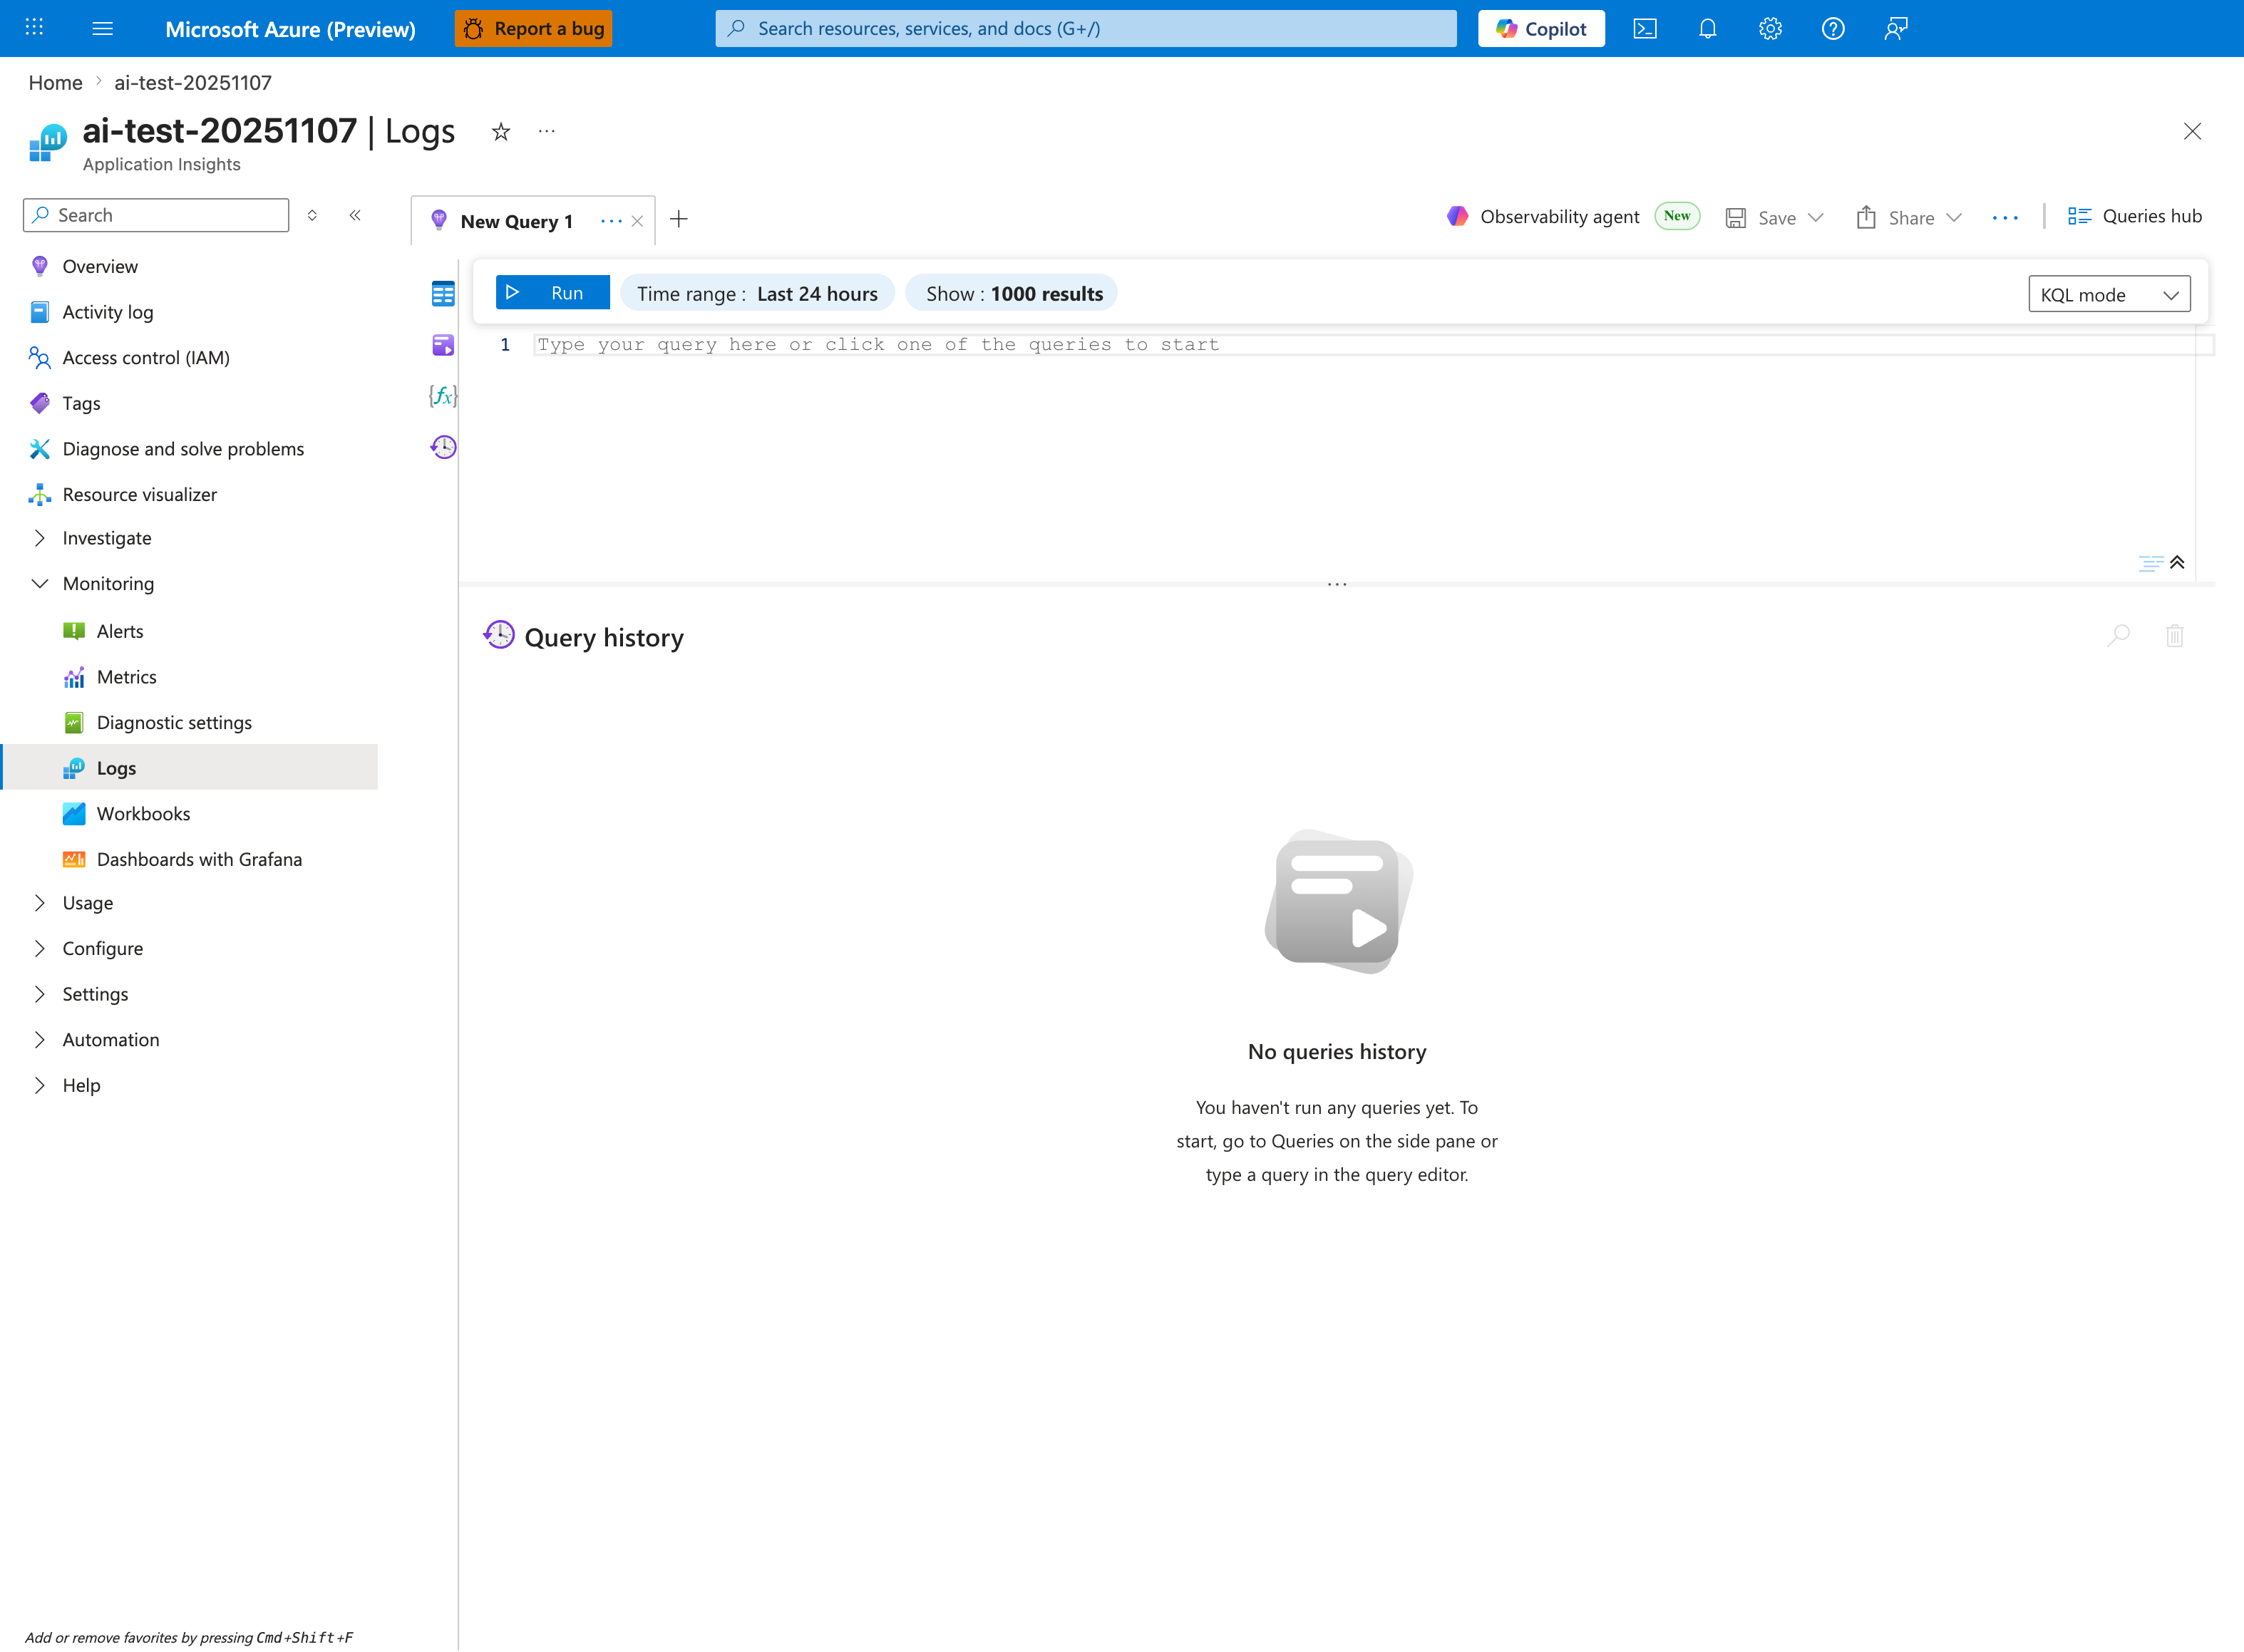
The Logs blade with a New Query 1 tab is the execution surface for KQL queries in the Portal. The visible inline toolbar — Run, Time range: Last 24 hours, Show: 1000 results, KQL mode — names the controls used to bound a query to the incident window. The left-nav Monitoring group lists Alerts, Metrics, Diagnostic settings, Logs (selected), Workbooks, and Dashboards with Grafana. The source resource for this capture is an Application Insights workspace connected to a Linux App Service; the Logs blade itself is OS-agnostic and is the equivalent Portal destination for running KQL queries against a Windows App Service.
5. Evidence to Collect
Required Evidence
- Current filesystem usage for
D:\homeand key subdirectories. - Instance-local temp usage under
D:\local\Temp. - Log retention settings and whether detailed error/FREB logging is enabled.
- Time-correlated error evidence (
503, write exceptions, startup failures). - Recent deployment history and package retention footprint.
- Presence and size of dump files (
.dmp) and diagnostic archives.
Kudu API collection set
API 1: Summarize top folders under D:\home
curl --request POST \
  --url "https://<app-name>.scm.azurewebsites.net/api/command" \
  --user "<kudu-user>:<kudu-password>" \
  --header "Content-Type: application/json" \
  --data '{"command":"powershell -NoProfile -Command \"Get-ChildItem D:\\home -Directory | ForEach-Object { $size=(Get-ChildItem $_.FullName -File -Recurse -ErrorAction SilentlyContinue | Measure-Object Length -Sum).Sum; [PSCustomObject]@{Path=$_.FullName;SizeGB=[math]::Round($size/1GB,2)} } | Sort-Object SizeGB -Descending | Select-Object -First 15\"","dir":"site\\wwwroot"}'
API 2: Check IIS HTTP log growth
curl --request POST \
  --url "https://<app-name>.scm.azurewebsites.net/api/command" \
  --user "<kudu-user>:<kudu-password>" \
  --header "Content-Type: application/json" \
  --data '{"command":"powershell -NoProfile -Command \"$p=\'D:\\\\home\\\\LogFiles\\\\http\'; if (Test-Path $p) { Get-ChildItem $p -File -Recurse | Sort-Object Length -Descending | Select-Object -First 20 FullName,Length,LastWriteTime } else { Write-Output \'Path not found\' }\"","dir":"site\\wwwroot"}'
API 3: Check application log growth
curl --request POST \
  --url "https://<app-name>.scm.azurewebsites.net/api/command" \
  --user "<kudu-user>:<kudu-password>" \
  --header "Content-Type: application/json" \
  --data '{"command":"powershell -NoProfile -Command \"$p=\'D:\\\\home\\\\LogFiles\\\\Application\'; if (Test-Path $p) { Get-ChildItem $p -File -Recurse | Sort-Object Length -Descending | Select-Object -First 20 FullName,Length,LastWriteTime } else { Write-Output \'Path not found\' }\"","dir":"site\\wwwroot"}'
API 4: Check local temp accumulation
curl --request POST \
  --url "https://<app-name>.scm.azurewebsites.net/api/command" \
  --user "<kudu-user>:<kudu-password>" \
  --header "Content-Type: application/json" \
  --data '{"command":"powershell -NoProfile -Command \"$p=\'D:\\\\local\\\\Temp\'; if (Test-Path $p) { Get-ChildItem $p -File -Recurse -ErrorAction SilentlyContinue | Measure-Object Length -Sum | Select-Object Count,@{Name=\'SizeGB\';Expression={[math]::Round($_.Sum/1GB,2)}} } else { Write-Output \'Path not found\' }\"","dir":"site\\wwwroot"}'
API 5: Find dump files and large traces
curl --request POST \
  --url "https://<app-name>.scm.azurewebsites.net/api/command" \
  --user "<kudu-user>:<kudu-password>" \
  --header "Content-Type: application/json" \
  --data '{"command":"powershell -NoProfile -Command \"Get-ChildItem D:\\home -File -Recurse -ErrorAction SilentlyContinue | Where-Object { $_.Extension -in @('.dmp','.zip','.etl','.xml') } | Sort-Object Length -Descending | Select-Object -First 30 FullName,Length,LastWriteTime\"","dir":"site\\wwwroot"}'
How to read Kudu size evidence
Prioritize growth trend and recency. A single large stale file may be less important than rapidly growing current-day logs.
Sample event and log signatures
2026-04-08T03:20:31Z  HTTP  GET  /api/orders  503  1421
2026-04-08T03:20:30Z  APP   IOException: There is not enough space on the disk.
2026-04-08T03:20:30Z  APP   Failed to write file D:\home\site\wwwroot\tmp\report-cache.bin
2026-04-08T03:19:59Z  IIS   W3SVC log write warning: quota or file write issue
KQL queries with example outputs
Query 1: 503 and latency drift around incident window
AppServiceHTTPLogs
| where TimeGenerated > ago(6h)
| summarize requests=count(), errors503=countif(ScStatus == 503), p95=percentile(TimeTaken,95) by bin(TimeGenerated, 5m), CsUriStem
| order by TimeGenerated asc
Example Output
| TimeGenerated | CsUriStem | requests | errors503 | p95 |
|---|---|---|---|---|
| 2026-04-08 03:10:00 | /api/orders | 220 | 0 | 120 |
| 2026-04-08 03:15:00 | /api/orders | 238 | 3 | 680 |
| 2026-04-08 03:20:00 | /api/orders | 245 | 21 | 1421 |
How to Read This
Rising p95 followed by 503 concentration on write-heavy endpoints often indicates storage pressure before hard failure.
Query 2: Console errors with disk indicators
AppServiceConsoleLogs
| where TimeGenerated > ago(24h)
| where ResultDescription has_any ("not enough space", "disk", "quota", "D:\\home", "D:\\local\\Temp")
| project TimeGenerated, ResultDescription
| order by TimeGenerated desc
Example Output
| TimeGenerated | ResultDescription |
|---|---|
| 2026-04-08 03:20:30 | IOException: There is not enough space on the disk. |
| 2026-04-08 03:20:30 | Failed to write D:\home\LogFiles\Application\app-2026-04-08.log |
| 2026-04-08 03:19:58 | Warning: quota threshold reached for site storage |
CLI investigation commands
az webapp config show --resource-group <resource-group> --name <app-name>
az webapp log config --resource-group <resource-group> --name <app-name> --application-logging filesystem --detailed-error-messages true --failed-request-tracing true --web-server-logging filesystem
az webapp log tail --resource-group <resource-group> --name <app-name>
az monitor metrics list --resource <app-resource-id> --metric "Http5xx" --interval PT5M --aggregation Total
az monitor metrics list --resource <app-resource-id> --metric "Requests" --interval PT5M --aggregation Total
Normal vs abnormal comparison
| Signal | Normal | Abnormal |
|---|---|---|
D:\home\LogFiles\http growth | Predictable daily growth with retention | Unbounded accumulation, older files never pruned |
D:\home\LogFiles\Application | Rotated app logs | Large monolithic log files and persistent spikes |
D:\local\Temp | Temporary churn, bounded size | Sustained growth within same instance lifetime |
| HTTP behavior | Stable p95 and low 5xx | Latency ramp then 503 bursts |
| Deployment | New package activated, old artifacts controlled | Old packages accumulate in site package paths |
6. Validation and Disproof by Hypothesis
H1: IIS HTTP logs filling D:\home (not rotated/cleaned)
- Signals that support
D:\home\LogFiles\httpis top consumer and keeps growing.- Error window aligns with heavy request volume and rising log volume.
- App recovers briefly after deleting/rotating old HTTP logs.
- Signals that weaken
- HTTP log path remains small while other folders dominate usage.
- 503 events occur without significant log growth.
- What to verify
- Kudu API 2 output and file recency.
- Current web server logging configuration and retention behavior.
- Whether logging is set to filesystem with no practical cleanup policy.
H2: Application writing large temp files to D:\home instead of D:\local
- Signals that support
- App code paths write caches, exports, or uploads under
D:\home. - Large files appear in app-owned folders in persistent storage.
- Incidents worsen over time rather than per-instance lifecycle.
- App code paths write caches, exports, or uploads under
- Signals that weaken
- Large temp files are under
D:\local\Temponly and rotate naturally with instance change. - Persistent storage remains relatively flat.
- Large temp files are under
- What to verify
- File paths in application logs and stack traces.
- Kudu folder breakdown for app directories under
D:\home\site. - App setting values controlling temp and cache locations.
H3: FREB traces enabled and accumulating
- Signals that support
- Failed Request Tracing is enabled for long periods.
- Trace XML files under
D:\home\LogFilesconsume significant space. - High request-error periods generate large numbers of FREB files.
- Signals that weaken
- FREB is disabled or trace directories are minimal.
- Storage growth is dominated by non-trace files.
- What to verify
- Logging configuration flags for failed request tracing.
- Kudu listing for FREB-related XML files and size trend.
- Correlation between 4xx/5xx bursts and trace file creation.
H4: Deployment artifacts (old zip packages) consuming quota
- Signals that support
D:\home\data\SitePackagesor related deployment paths contain many historical files.- Disk usage increases after each deployment and never returns.
- Startup failures begin after release cadence increases.
- Signals that weaken
- Deployment artifact folders are small and stable.
- Incidents happen without recent deployments.
- What to verify
- Kudu listing of deployment package directories and timestamps.
- Deployment history versus quota growth timeline.
- Whether cleanup process exists for stale packages.
H5: Diagnostic dumps consuming disk space
- Signals that support
.dmpfiles or diagnostics archives are large and recent.- Incident starts after crash loops or proactive dump capture.
- Disk pressure persists even when app log volume is moderate.
- Signals that weaken
- Dump files are absent or negligible.
- Deleting old dumps has no measurable impact.
- What to verify
- Kudu API 5 output sorted by size and date.
- Crash/restart timeline relative to dump generation.
- Dump policy and retention controls.
7. Likely Root Cause Patterns
- Pattern A: Logging retention gap on persistent storage
- IIS HTTP logs and app logs grow in
D:\home\LogFileswithout strict retention.
- IIS HTTP logs and app logs grow in
- Pattern B: Persistent path misuse for temporary workloads
- Export/cache/upload intermediates are written to
D:\homeinstead of bounded local temp.
- Export/cache/upload intermediates are written to
- Pattern C: Trace amplification during incident windows
- FREB and verbose diagnostics multiply file creation during 4xx/5xx spikes.
- Pattern D: Release artifact accumulation
- Old deployment packages and extraction remnants remain under
D:\home.
- Old deployment packages and extraction remnants remain under
- Pattern E: Crash diagnostics saturation
- Dump collection policies create large files with no timed purge.
Investigation notes
- Persistent
D:\homepressure does not disappear reliably after restart. D:\local\Temppressure can look transient but still repeats on long-lived instances.- Quota events can manifest as write exceptions first, then
503as the app degrades. - The fastest discriminator is path-level evidence from Kudu plus timestamped growth trends.
8. Immediate Mitigations
- Reduce filesystem logging scope and retention; disable unneeded verbose categories.
- Clean up stale IIS HTTP logs, stale application logs, old FREB traces, and obsolete package artifacts.
- Move temporary workload files from persistent
D:\hometo boundedD:\local\Tempwhere appropriate. - Remove outdated dumps and tune dump policy to avoid unlimited growth.
- Restart the app after cleanup to validate recovery and confirm new growth baseline.
az webapp log config --resource-group <resource-group> --name <app-name> --application-logging filesystem --web-server-logging filesystem --detailed-error-messages false --failed-request-tracing false
az webapp restart --resource-group <resource-group> --name <app-name>
Deletion safety
Validate active file handles and retention requirements before deleting diagnostics artifacts in production.
9. Prevention
Storage governance controls
- Define explicit retention windows for IIS HTTP logs and application filesystem logs.
- Keep FREB disabled by default and enable only for bounded troubleshooting windows.
- Add routine cleanup jobs for deployment artifacts and historical diagnostics files.
- Enforce application-level quotas for generated files and cache directories.
Application design controls
- Use
D:\local\Tempfor true temporary files and clear them at workflow completion. - Avoid writing large transient files to
D:\homeunless persistence is required. - Keep upload and report generation pipelines streamed when possible to reduce disk spikes.
- Emit structured logs to external sinks instead of large local rolling files when feasible.
Monitoring controls
- Alert on rapid growth under
D:\home\LogFilesand key app data folders. - Alert on sustained 503 increases with concurrent write-failure signatures.
- Review Kudu folder distribution during weekly operational health checks.
Windows vs Linux contrast (for triage only)
- Windows App Service uses
D:\home(persistent) andD:\local\Temp(ephemeral local instance storage). - Linux App Service uses
/home(persistent network-backed mount) and/tmp(local ephemeral storage). - Use the correct path semantics to avoid false assumptions during incident response.