Slow Start / Cold Start vs Real Regression (Azure App Service Linux)
1. Summary
Symptom
Users report the app is "slow" right after deployment, scale-out, or inactivity, with first requests taking 30-60+ seconds on one or more instances, while later requests are much faster.
Why this scenario is confusing
Cold start latency is bursty and event-driven, while true performance regression is sustained. If teams only look at incident screenshots or average latency, they may treat startup behavior as a code regression and over-correct.
2. Common Misreadings
- "Latency is high after deployment, so the release introduced a performance bug."
- "One slow request proves the app is degraded."
- "Health Check or warm-up probes are equivalent to real user warm traffic."
- "Increasing
WEBSITES_CONTAINER_START_TIME_LIMITfixes slow requests" (it only changes startup timeout tolerance). - "P95 spike means always scale up immediately" (without separating first-hit startup from steady-state latency).
3. Competing Hypotheses
- H1: Expected cold start window after scale-out, restart, deployment, slot swap, or idle recycle.
- H2: Startup path is too heavy (Python import cost, model loading, initialization work, startup scripts, dependency installation patterns).
- H3: Misconfiguration of warm-up/startup controls (
AlwaysOn,WEBSITE_WARMUP_PATH, Health Check, startup timeout settings). - H4: Real regression in warm path (code, dependency, DB, or network change causing sustained latency beyond startup window).
4. What to Check First
Metrics
- Request percentile trend (P50/P95/P99) over time, not just a single point.
- Compare first-request latency spikes vs sustained latency over 30-60 minutes.
- Instance count and scale/restart timestamps aligned to latency spikes.
Logs
AppServicePlatformLogs: container start, recycle, scale, worker lifecycle events.AppServiceConsoleLogs: startup sequence, import/load messages, Gunicorn worker boot timing, timeout/warning lines inResultDescription.AppServiceHTTPLogs:TimeTaken,ScStatus,CsUriStemaround event windows.
Portal view: Log stream for live cold-start sequence observation
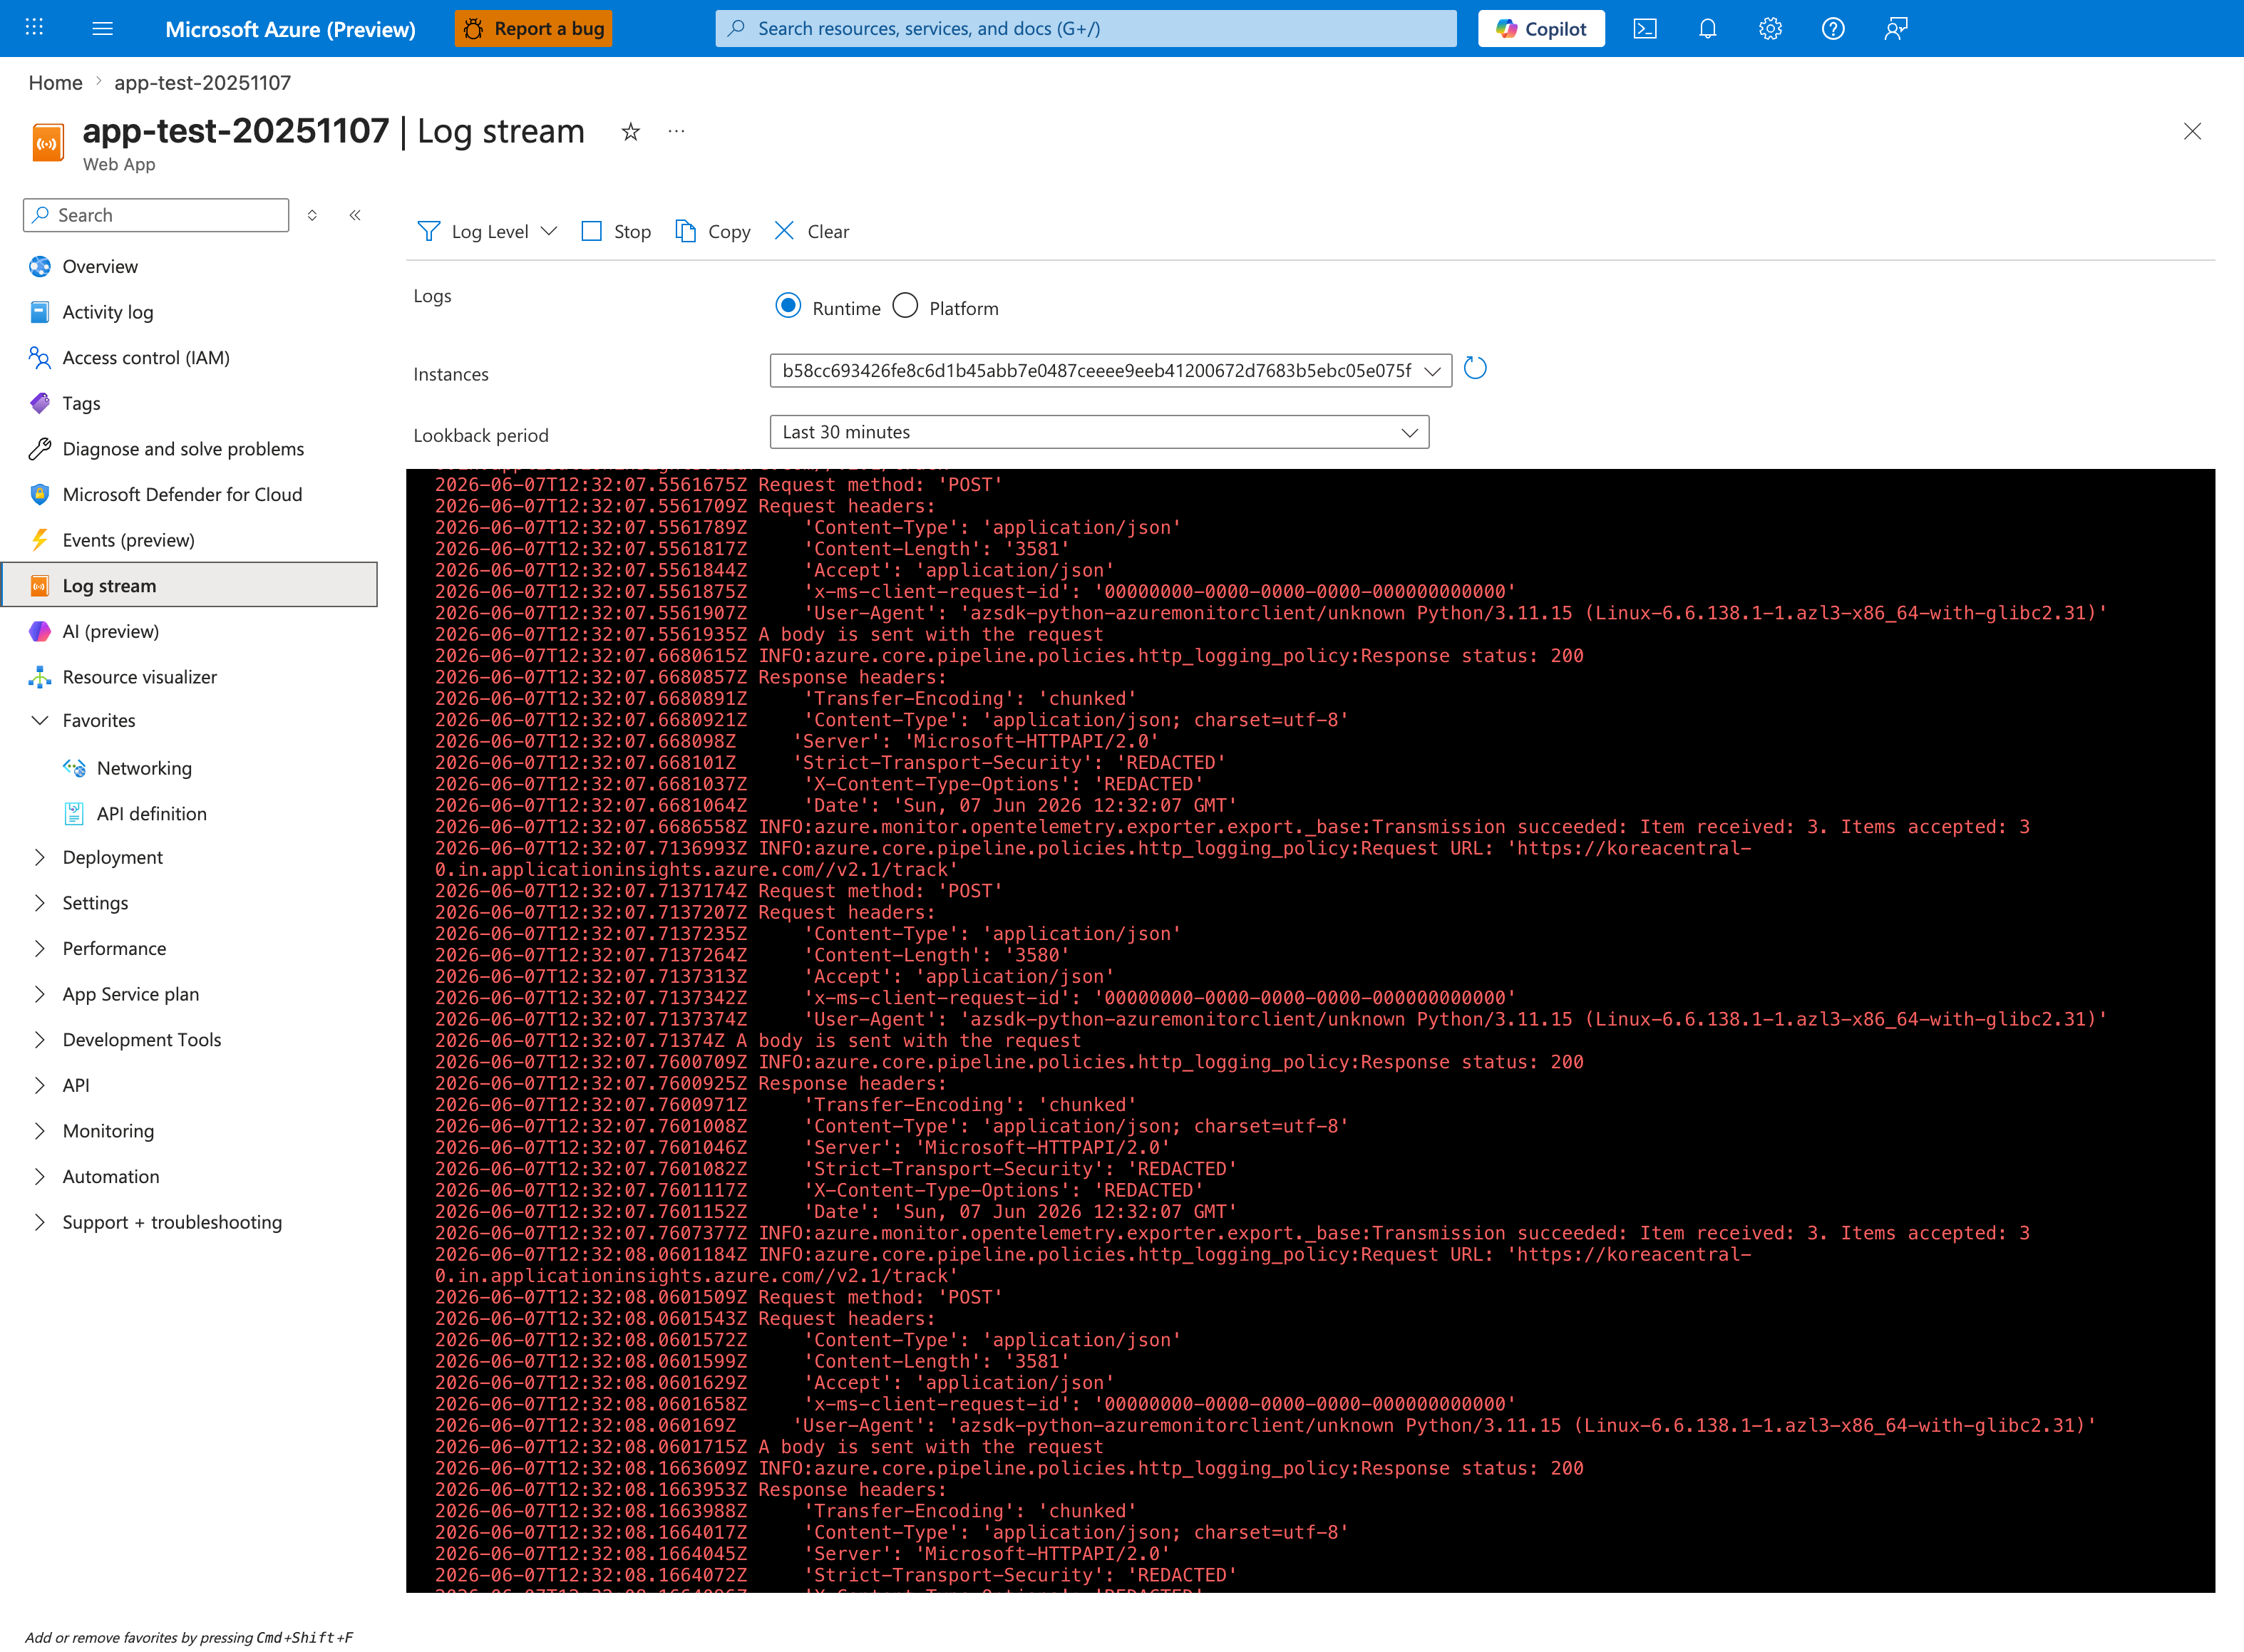
Log stream is the fastest way to watch a cold-start sequence unfold in real time and measure the gap between Starting gunicorn, Listening at: http://0.0.0.0:8000, and the first Booting worker with pid: line — that gap is the dominant startup cost for Python apps on Linux App Service and the central evidence for H2 (startup path is too heavy). Switch the radio to Platform Logs to also capture Container is initializing and ContainerTimeout transitions, then trigger a controlled restart (az webapp restart) and time the sequence with a stopwatch; a sequence longer than the default WEBSITES_CONTAINER_START_TIME_LIMIT=230 seconds will fail repeatedly and surface in the platform stream as LastError: ContainerTimeout. This evidence directly disproves H1 (expected cold start window) when the measured startup duration exceeds the bounded SLO budget and proves the optimization work belongs in the app's import path, not in the warm-up settings.
Platform Signals
- Deployment timeline (
az webapp deployment list) vs latency timeline. - App settings:
AlwaysOn,WEBSITE_WARMUP_PATH,WEBSITES_CONTAINER_START_TIME_LIMIT. - Plan/SKU behavior (for example, idle recycle risk with
AlwaysOn=falseon Basic SKU).
5. Evidence to Collect
Required Evidence
- 24-hour timeline joining HTTP latency, restarts/scale events, and deployment events.
- Startup-related console lines (
ResultDescription) for affected windows. - Per-path latency and status code breakdown from
AppServiceHTTPLogs. - Effective app settings and startup command for the running app.
Useful Context
- Whether slow requests are first-hit only (after restart/scale/idle) or persist under warm traffic.
- Python runtime/framework, Gunicorn worker config, module import profile.
- Whether startup script performs network/package tasks (for example
pip install) before serving traffic. - Traffic pattern (bursty vs constant), and whether pre-warm traffic exists before user traffic.
Sample Log Patterns
AppServiceHTTPLogs (cold-start lab)
2026-04-04T11:23:04Z  GET  /diag/env    200  24
2026-04-04T11:23:03Z  GET  /diag/stats  200  41
2026-04-04T11:22:32Z  GET  /timing      200  11
AppServiceConsoleLogs (startup worker sequence)
2026-04-04T11:14:11Z  [2026-04-04 11:14:11 +0000] [1895] [INFO] Starting gunicorn 22.0.0
2026-04-04T11:14:11Z  [2026-04-04 11:14:11 +0000] [1895] [INFO] Listening at: http://0.0.0.0:8000 (1895)
2026-04-04T11:14:11Z  [2026-04-04 11:14:11 +0000] [1895] [INFO] Using worker: sync
2026-04-04T11:14:11Z  [2026-04-04 11:14:11 +0000] [1897] [INFO] Booting worker with pid: 1897
2026-04-04T11:14:11Z  [2026-04-04 11:14:11 +0000] [1898] [INFO] Booting worker with pid: 1898
AppServicePlatformLogs (timeout/stop sequence)
2026-04-04T11:15:03Z  Informational  State: Stopping, Action: StoppingSiteContainers, LastError: ContainerTimeout, LastErrorTimestamp: 04/04/2026 10:53:07
2026-04-04T11:15:09Z  Informational  Container is terminated. Total time elapsed: 5996 ms.
2026-04-04T11:15:09Z  Informational  Site: <app-name> stopped.
How to Read This
The key signal in this lab is not endpoint failure but startup duration. /diag/stats confirms startup_duration=31.499s, which is long for B1 under cold-start conditions and can trigger perceived slowness after restart/scale events.
KQL Queries with Example Output
Query 1: Cold-start request window profile
AppServiceHTTPLogs
| where TimeGenerated between (datetime(2026-04-04 11:22:30) .. datetime(2026-04-04 11:23:05))
| project TimeGenerated, CsMethod, CsUriStem, ScStatus, TimeTaken
| order by TimeGenerated desc
Example Output
| TimeGenerated | CsMethod | CsUriStem | ScStatus | TimeTaken |
|---|---|---|---|---|
| 2026-04-04 11:23:04 | GET | /diag/env | 200 | 24 |
| 2026-04-04 11:23:03 | GET | /diag/stats | 200 | 41 |
| 2026-04-04 11:22:32 | GET | /timing | 200 | 11 |
How to Read This
This narrow sample alone does not prove regression. Use it with startup metadata (startup_duration) and platform lifecycle events to decide whether this is expected cold-start cost.
Query 2: Startup sequence from console logs
AppServiceConsoleLogs
| where TimeGenerated between (datetime(2026-04-04 11:14:10) .. datetime(2026-04-04 11:14:12))
| project TimeGenerated, Level, ResultDescription
| order by TimeGenerated desc
Example Output
| TimeGenerated | Level | ResultDescription |
|---|---|---|
| 2026-04-04 11:14:11 | Error | [2026-04-04 11:14:11 +0000] [1898] [INFO] Booting worker with pid: 1898 |
| 2026-04-04 11:14:11 | Error | [2026-04-04 11:14:11 +0000] [1897] [INFO] Booting worker with pid: 1897 |
| 2026-04-04 11:14:11 | Error | [2026-04-04 11:14:11 +0000] [1895] [INFO] Using worker: sync |
| 2026-04-04 11:14:11 | Error | [2026-04-04 11:14:11 +0000] [1895] [INFO] Listening at: http://0.0.0.0:8000 (1895) |
| 2026-04-04 11:14:11 | Error | [2026-04-04 11:14:11 +0000] [1895] [INFO] Starting gunicorn 22.0.0 |
How to Read This
Only two sync workers are booted in this sample. If startup and first-hit work include heavy initialization, user-facing latency spikes can occur even before CPU appears stressed.
Query 3: Platform timeout correlation
AppServicePlatformLogs
| where TimeGenerated between (datetime(2026-04-04 11:15:00) .. datetime(2026-04-04 11:15:10))
| project TimeGenerated, Level, Message
| order by TimeGenerated desc
Example Output
| TimeGenerated | Level | Message |
|---|---|---|
| 2026-04-04 11:15:09 | Informational | Site: |
| 2026-04-04 11:15:09 | Informational | Container is terminated. Total time elapsed: 5996 ms. |
| 2026-04-04 11:15:03 | Informational | State: Stopping, Action: StoppingSiteContainers, LastError: ContainerTimeout, LastErrorTimestamp: 04/04/2026 10:53:07 |
How to Read This
A ContainerTimeout near startup windows means startup readiness did not complete in time. Do not treat this as warm-path regression without verifying sustained warm traffic behavior.
CLI Investigation Commands
az webapp show --resource-group <resource-group> --name <app-name> --query "siteConfig.alwaysOn"
az webapp config appsettings list --resource-group <resource-group> --name <app-name>
az webapp deployment list --resource-group <resource-group> --name <app-name>
az webapp log tail --resource-group <resource-group> --name <app-name>
Example Output (sanitized)
$ az webapp show --resource-group <resource-group> --name <app-name> --query "siteConfig.alwaysOn"
false

$ az webapp config appsettings list --resource-group <resource-group> --name <app-name>
[
  {"name": "WEBSITES_CONTAINER_START_TIME_LIMIT", "value": "230"},
  {"name": "WEBSITE_WARMUP_PATH", "value": "/timing"}
]

$ az webapp deployment list --resource-group <resource-group> --name <app-name>
[
  {
    "id": "<deployment-id>",
    "status": 4,
    "received_time": "2026-04-04T11:13:52Z"
  }
]
How to Read This
AlwaysOn=false plus a small SKU increases cold-start exposure. Deployment timing close to first-user latency spikes is expected; this should not be auto-classified as code regression.
Normal vs Abnormal Comparison
| Signal | Normal Cold Start | Abnormal Regression |
|---|---|---|
| Latency shape | First-hit spike then normalization | Elevated latency persists after warm-up |
| Startup metrics | startup_duration elevated but bounded (for example ~31.499s) | Startup normal, but warm endpoints remain slow |
| Platform logs | Restart/scale/deploy events align with spike | No event correlation with sustained slowdown |
| Console logs | Worker boot sequence visible, no repeated runtime faults | Repeated timeouts/errors under warm traffic |
| Health endpoints | Recover quickly after warm-up | Also degrade over longer windows |
6. Validation and Disproof by Hypothesis
H1: Expected cold start window
- Signals that support
- Spikes align tightly with
AppServicePlatformLogsevents (container start,restart,scale out). - First requests on new instances are slow; subsequent requests normalize quickly.
- Latency spike is narrow (for example 5-15 minutes) and not sustained.
- Spikes align tightly with
- Signals that weaken
- No restart/scale/deployment/idle event near latency increase.
- Warm traffic remains slow long after instance initialization.
- All requests across all instances are consistently slow.
- What to verify
- KQL (event and latency correlation):
let latency = AppServiceHTTPLogs | where TimeGenerated > ago(24h) | summarize p50=percentile(TimeTaken, 50), p95=percentile(TimeTaken, 95), requests=count() by bin(TimeGenerated, 5m); let platform = AppServicePlatformLogs | where TimeGenerated > ago(24h) | where ResultDescription has_any ("restart", "recycle", "container", "scale") | summarize platform_events=count(), samples=make_set(ResultDescription, 5) by bin(TimeGenerated, 5m); latency | join kind=leftouter platform on TimeGenerated | order by TimeGenerated asc - KQL (first-hit signature by path/status):
- KQL (event and latency correlation):
H2: Startup path is too heavy (Python-specific initialization)
- Signals that support
AppServiceConsoleLogs.ResultDescriptionshows long gaps during startup before listener is ready.- Logs indicate expensive imports (
numpy,pandas, ML model loading) during worker boot. - Oryx-related build/install activity appears in startup path (for example
pip installexecuted during restart/startup workflow), delaying readiness. - Startup scripts perform package/network tasks before app starts (for example runtime
pip installbehavior). - Cold start duration increases with app package size/model size while warm-path latency remains stable.
- Signals that weaken
- Startup completes quickly and consistently in logs.
- Import/model load is deferred and first-request spikes are absent in controlled warm tests.
- Slowdown persists on already warm workers (indicates H4).
- What to verify
- KQL (startup timing clues from console):
- CLI (startup config and app settings):
- Confirm build/run flow: dependencies should be installed at build/deploy stage, not per restart/startup script.
H3: Warm-up/startup controls are misconfigured
- Signals that support
AlwaysOnis disabled for continuously-used production workloads.WEBSITE_WARMUP_PATHis missing or points to heavy endpoint.WEBSITES_CONTAINER_START_TIME_LIMITis too low for known startup duration, causing startup retries/failures.- Health Check path is expensive, unstable, or not representative of readiness.
- Signals that weaken
AlwaysOnenabled, warm-up endpoint lightweight, and startup timeout sized with margin.- Startup completes consistently without timeout/recycle loops.
- Cold start occurs only after legitimate scale-out and remains within expected SLO.
- What to verify
- CLI (settings inspection):
- KQL (timeout/recycle hints):
- Treat
WEBSITES_CONTAINER_START_TIME_LIMITas a startup survivability control, not a latency optimization knob.
H4: Real regression in warm request path
- Signals that support
- Elevated P95/P99 continues well after startup windows.
- Slow endpoints are the same under warm traffic and normal instance lifecycle.
- Dependency timings/error rates increased after code or config change.
- No meaningful correlation with restart/scale/deployment events.
- Signals that weaken
- Only first request(s) are slow and metrics normalize quickly.
- Performance degradation disappears once workers are warm.
- Regression cannot be reproduced with sustained warm load.
- What to verify
- KQL (sustained warm-path latency):
- KQL (slowest warm endpoints):
7. Likely Root Cause Patterns
- Pattern A: Scale-out cold instance onboarding delay
- New instances need image/container/runtime/app initialization before stable serving.
- Pattern B: Deployment-triggered first-hit slowness
- Fresh workers receive user traffic before caches/imports/readiness are warmed.
- Pattern C: Idle recycle then cold request (AlwaysOn disabled)
- Idle period leads to recycle; next request pays startup cost.
- Pattern D: Misread startup spike as regression
- Teams evaluate only immediate post-event latency and miss steady-state normalization.
Investigation Notes
sequenceDiagram
    autonumber
    participant U as User
    participant FE as App Service Front End
    participant I as New/Cold Instance
    participant W as Warm Instance

    Note over FE,I: Cold start path
    FE->>I: Route request after scale/deploy/idle
    I->>I: Container pull / mount
    I->>I: Runtime init (Python/Gunicorn)
    I->>I: App init (imports, config, model/cache)
    I-->>FE: First response (often slow)
    FE-->>U: Elevated first-request latency

    Note over FE,W: Warm request path
    FE->>W: Route request
    W-->>FE: Response (steady-state)
FE-->>U: Normal latencyWEBSITES_CONTAINER_START_TIME_LIMITaffects how long platform waits for startup readiness. It does not directly improve warm request performance.- For Basic SKU with
AlwaysOn=false, idle periods can create predictable "next request is slow" behavior due to recycle/cold start. - Keep examples and exported logs sanitized: replace subscription/resource IDs with placeholders like
<subscription-id>and<resource-group>.
Quick Conclusion
If latency spikes occur immediately after scale/deploy/idle events and then normalize, treat them as cold start behavior first and validate with platform-event correlation. Call it a real regression only when elevated latency remains under warm steady-state traffic across time.
8. Immediate Mitigations
- Enable
AlwaysOnfor production apps that require low first-hit latency (risk: increased baseline resource usage/cost). - Configure
WEBSITE_WARMUP_PATHto a lightweight endpoint that initializes critical dependencies (risk: if endpoint is heavy, startup becomes slower). - Keep Health Check endpoint lightweight and readiness-focused; do not use expensive business logic (risk: noisy health signals if misused).
- If startup time is legitimately longer than default timeout, increase
WEBSITES_CONTAINER_START_TIME_LIMITcarefully (risk: masks startup inefficiency if used alone). - During incident response, separate first-request spike alerts from sustained P95 breaches to avoid false regression escalation (risk: under-alerting if thresholds are too relaxed).
9. Prevention
- Reduce Python startup cost: lazy-import heavy modules, preload only essential components, externalize large model loading, cache warmed artifacts.
- Move dependency installation entirely to build/deployment stage; avoid runtime
pip installor network-heavy startup scripts. - Implement deterministic pre-warm before traffic cutover (slot warm-up, controlled synthetic requests to warm endpoints).
- Establish dual SLOs: startup-first-request SLO and warm steady-state latency SLO.
- Add dashboards correlating restart/scale/deploy events with first-request latency and sustained P95/P99.
Limitations
- This playbook is Linux App Service focused and excludes Windows/IIS behavior.
- This playbook distinguishes cold start from regression; it does not replace deep dependency profiling or code-level performance tuning playbooks.
- Warm-up vs health/availability design details are intentionally out of scope here.
See Also
Related Queries
../../kql/http/latency-trend-by-status-code.md../../kql/http/slowest-requests-by-path.md../../kql/restarts/restart-timing-correlation.md