Slow Response but Low CPU (Azure App Service Linux)
1. Summary
Symptom
HTTP responses are slow (high P95/P99 latency or elevated TimeTaken in AppServiceHTTPLogs), but App Service Plan CPU metrics remain well below saturation (e.g., under 40-50%).
Why this scenario is confusing
Engineers instinctively check CPU first. When CPU is low, they assume the app is not resource-constrained and may stop investigating platform-level or dependency-level causes.
Troubleshooting decision flow
graph TD
    A[Symptom: Slow responses with low CPU] --> B{Check latency shape first}
    B --> C[P95/P99 high on dependency-heavy paths]
    B --> D[P99 spikes with concurrency/backlog]
    C --> H1[H1: Downstream dependency slowness]
    D --> H2[H2: Thread/worker starvation]
    A --> E{Check plan memory and restart correlation}
    E --> F[Memory rises with uptime; restart helps]
    E --> G[Spikes after restart/scale or outbound-heavy windows]
    F --> H3[H3: Memory pressure causing degradation]
    G --> H4["H4: Platform-side delays (cold start/SNAT/I/O)"]
2. Common Misreadings
- "CPU is low, so the app cannot be resource-constrained."
- "If latency is high, scale-out is always the first fix."
- "No HTTP 5xx means users are not affected."
- "No exceptions in AppServiceConsoleLogs means request path is healthy end-to-end."
- "Average latency is acceptable, so the issue is minor" (while P95/P99 is breaching SLO for real users).
3. Competing Hypotheses
- H1: Downstream dependency slowness (Azure SQL, Cosmos DB, Storage, Redis, Key Vault, or third-party API latency).
- H2: Thread/worker starvation (Gunicorn workers exhausted, worker timeouts, async queue backlog, connection pool exhaustion).
- H3: Memory pressure causing GC pauses or swap-like behavior at plan level (high memory utilization with low CPU, leading to degraded responsiveness).
- H4: Platform-side delays (cold start after restart/scale event, SNAT port contention on outbound-heavy workloads, or slow file I/O paths such as mounted/shared storage access).
4. What to Check First
Metrics
- App Service Plan CPU Percentage and Memory Percentage in Azure Monitor (same time window as incident).
- Request latency percentiles (P50/P95/P99) using
AppServiceHTTPLogs.TimeTaken. - Active TCP/HTTP connection-related metrics (for burst or exhaustion patterns).
Logs
AppServiceHTTPLogs: identify highTimeTakengrouped byCsUriStemandScStatus.AppServiceConsoleLogs: look fortimeout,worker timeout,connection refused,pool exhausted, DNS/connect/read timeout messages, GC pressure warnings.
Platform Signals
AppServicePlatformLogs: restart, recycle, scale, container start timing.- Diagnose and Solve Problems: SNAT Port Exhaustion detector.
- Correlation with deployment/release timestamps and app setting changes.
5. Evidence to Collect
Required Evidence
- KQL for latency distribution over time from
AppServiceHTTPLogs. - KQL for console log error/warning bursts during slow windows.
- Azure Monitor metrics for App Service Plan: CPU %, Memory %, Connections.
- Dependency telemetry (Application Insights dependencies table, if enabled): call duration, failure %, target endpoint.
Portal view: Application Insights overview for dependency latency evidence
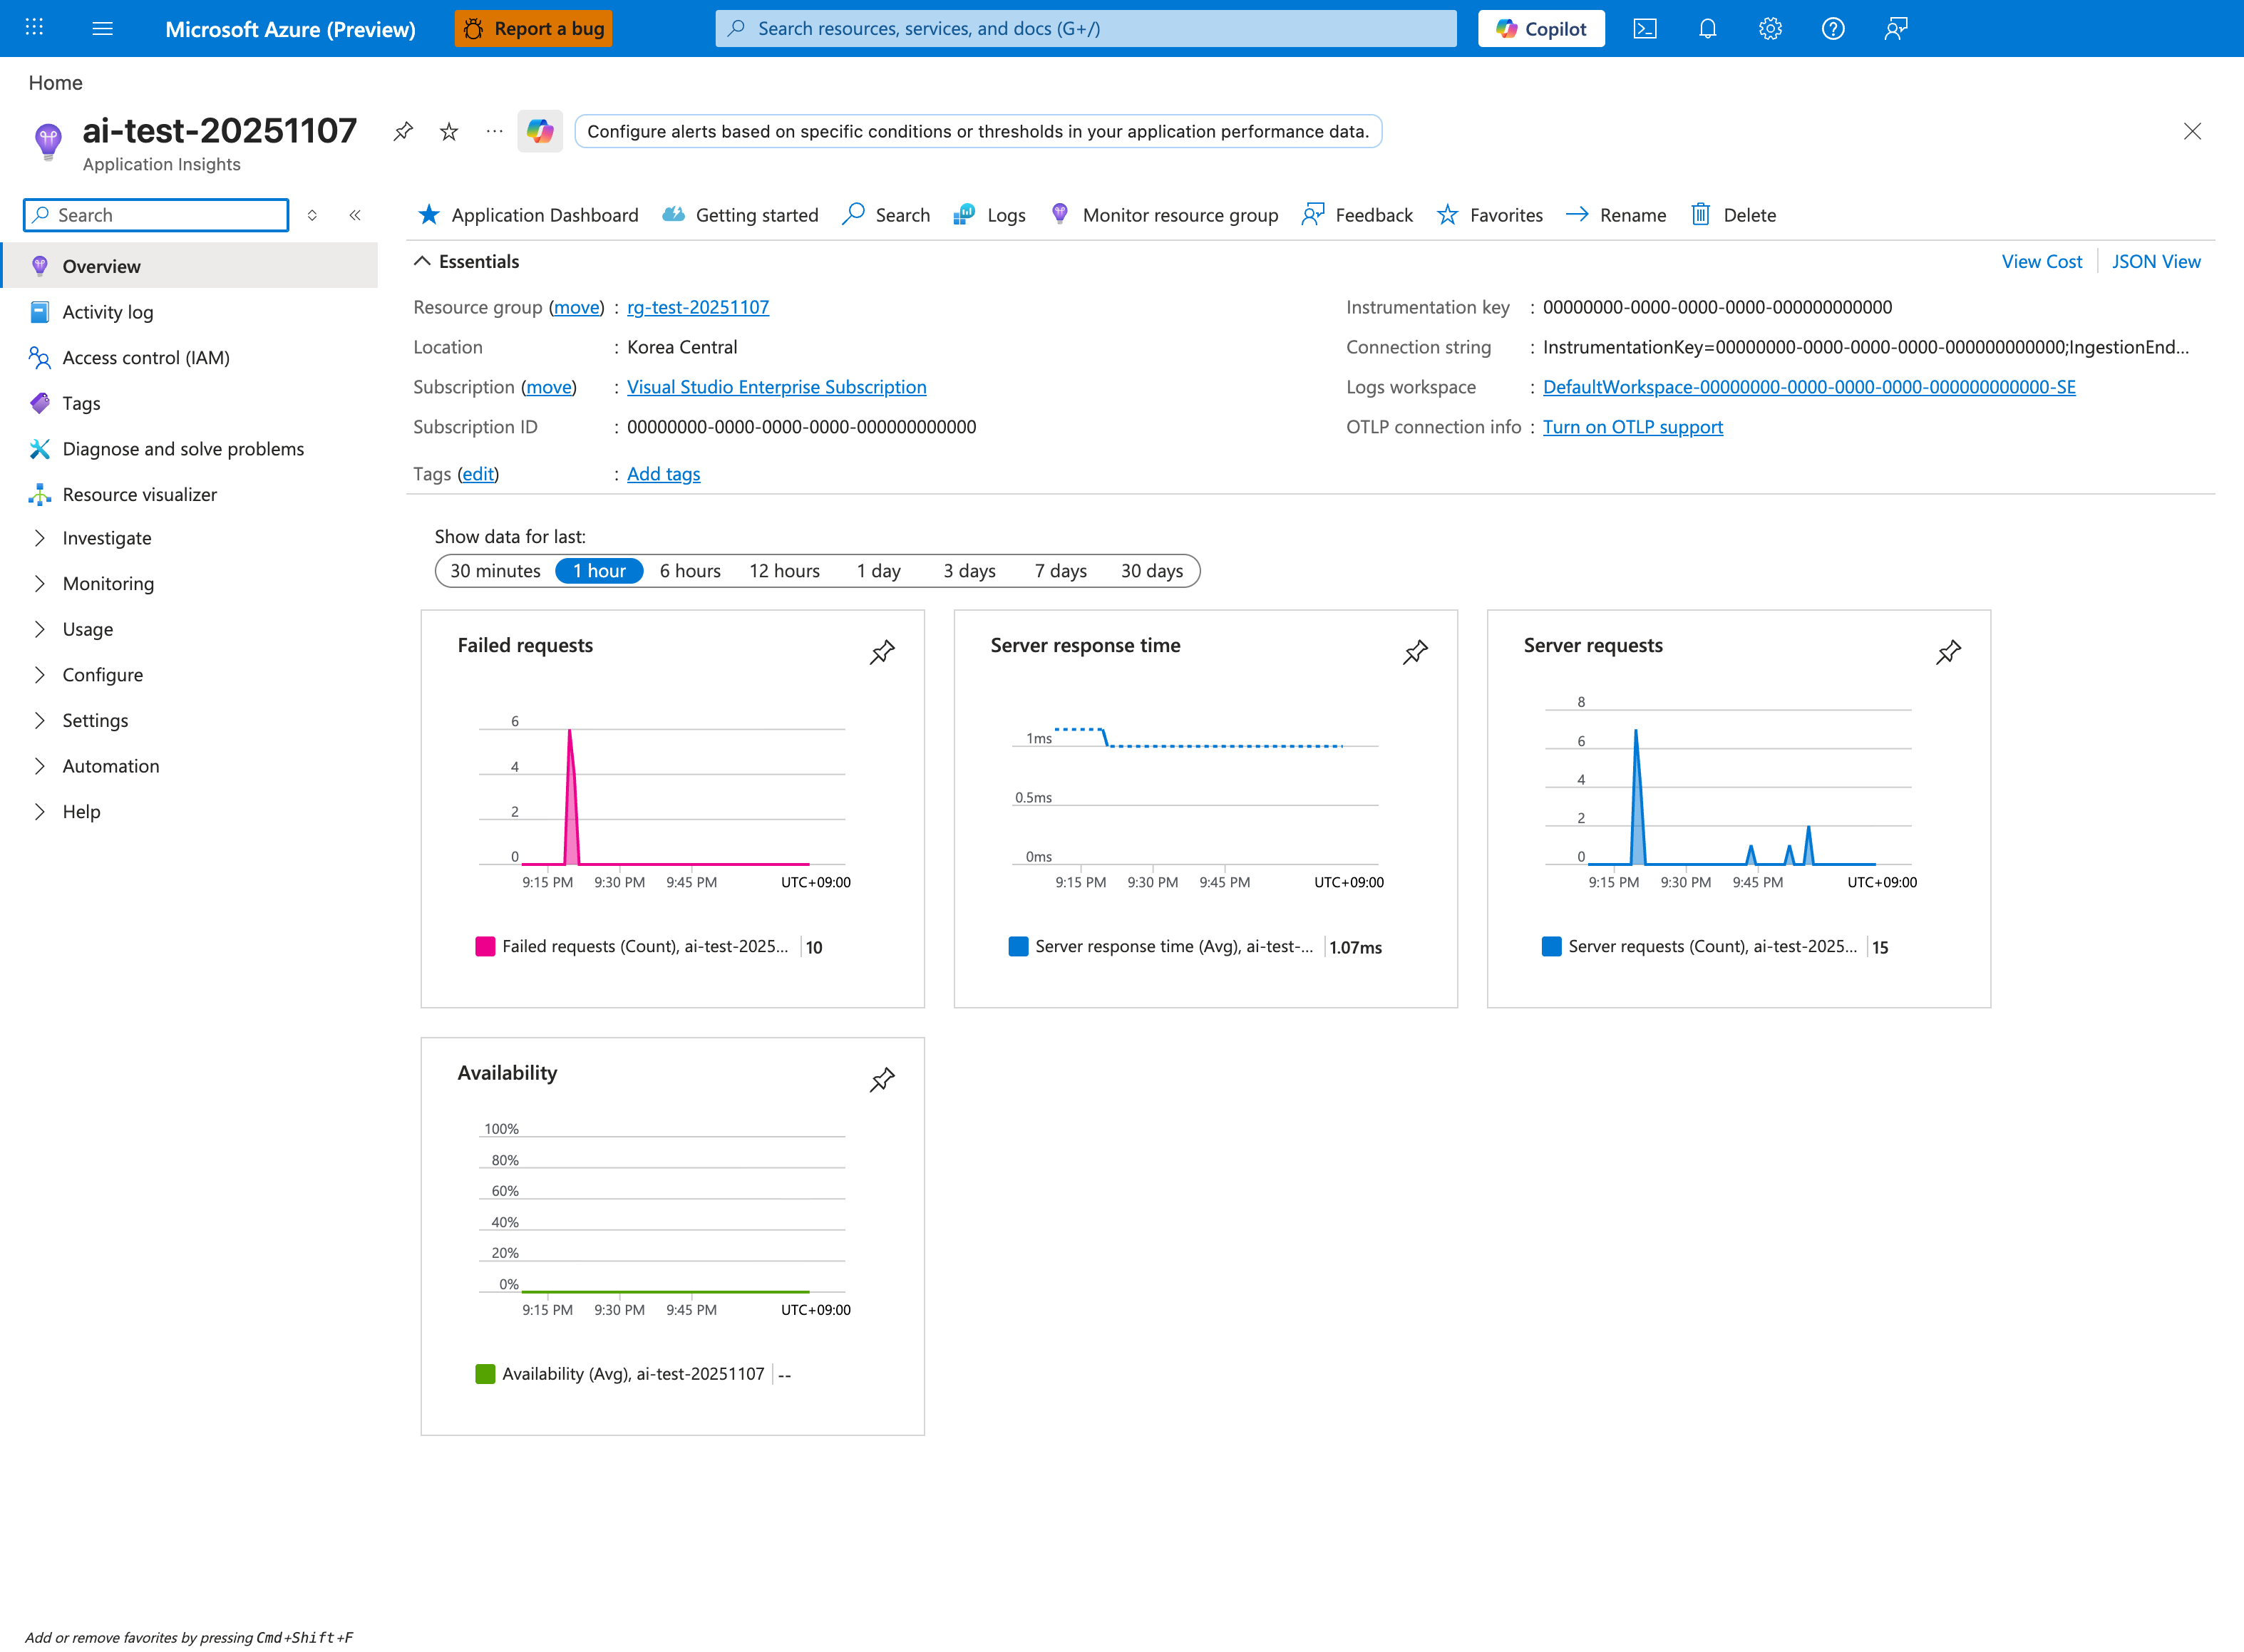
The Application Insights blade is the decisive evidence source for H1 (downstream dependency slowness), because the Failures and Performance links inside the (collapsed) Investigate group of the left nav reveal per-dependency latency that AppServiceHTTPLogs cannot — AppServiceHTTPLogs.TimeTaken only captures total request duration without exposing which dependency call inside the request was slow. The Server response time tile (showing 1.07ms here on a healthy app) and the linked Performance blade let you split the same total latency by Dependency name and Target so you can prove whether the slow path is the SQL call, the Redis call, the third-party API, or the Key Vault lookup. For this playbook specifically, navigate to Application Map to visualize dependency call duration as a topology overlay — a dependency node with Avg ms significantly higher than its baseline is the single strongest signal that low-CPU latency is dependency-bound rather than worker-bound.
Useful Context
- Recent deployments, startup command changes, app setting changes, scale events.
- Dependency-side health: Azure SQL DTU/vCore pressure, storage throttling, third-party API status.
- Runtime worker configuration: Gunicorn
--workers,--threads,--timeout, DB pool size, outbound HTTP client pool/timeout/retry settings.
Sample Log Patterns
Illustrative Dataset
This playbook section uses synthetic but realistic patterns (based on memory-pressure and intermittent-5xx behavior) to demonstrate diagnosis when CPU is low and latency is high.
AppServiceHTTPLogs (high latency, mostly 200s)
2026-04-04T11:22:35Z  GET  /api/orders/summary   200  3187
2026-04-04T11:22:35Z  GET  /api/orders/summary   200  2910
2026-04-04T11:22:34Z  GET  /api/catalog          200   184
2026-04-04T11:22:34Z  GET  /api/dependency-proxy 200  4128
2026-04-04T11:22:33Z  GET  /healthz              200    11
2026-04-04T11:22:33Z  GET  /api/dependency-proxy 504  5002
2026-04-04T11:22:32Z  GET  /api/orders/summary   200  2764
AppServiceConsoleLogs (dependency wait + worker pressure)
2026-04-04T11:22:35Z  WARNING  dependency call timeout target=db-primary elapsed_ms=3000
2026-04-04T11:22:35Z  INFO     request queued route=/api/orders/summary queue_depth=12
2026-04-04T11:22:34Z  WARNING  pool exhausted for upstream=inventory-api acquire_timeout_ms=1200
2026-04-04T11:22:34Z  INFO     [gunicorn] [INFO] Worker heartbeat delayed by blocking I/O
2026-04-04T11:22:33Z  INFO     [gunicorn] [INFO] Using worker: sync
AppServicePlatformLogs (no hard platform fault)
2026-04-04T11:22:30Z  Informational  Site: <app-name> started.
2026-04-04T11:22:30Z  Informational  Container health check passed.
2026-04-04T11:22:28Z  Informational  Instance count unchanged. No scale action required.
How to Read This
Health endpoint remains fast while dependency-heavy paths are slow. This usually means requests are waiting on external calls, pool acquisition, or queue depth rather than burning CPU cycles.
KQL Queries with Example Output
Query 1: Fast health endpoint vs slow business endpoints
// Illustrative query using realistic incident shape
AppServiceHTTPLogs
| where TimeGenerated between (datetime(2026-04-04 11:22:30) .. datetime(2026-04-04 11:22:36))
| summarize req=count(), p95=percentile(TimeTaken,95), err=countif(ScStatus >= 500) by CsUriStem
| order by p95 desc
Example Output
| CsUriStem | req | p95 | err |
|---|---|---|---|
| /api/dependency-proxy | 2 | 5002 | 1 |
| /api/orders/summary | 3 | 3187 | 0 |
| /api/catalog | 1 | 184 | 0 |
| /healthz | 1 | 11 | 0 |
How to Read This
Large latency differences by route strongly suggest dependency or queueing bottlenecks. If CPU were primary, broader endpoint slowdown would usually appear.
Query 2: Worker starvation and pool exhaustion signatures
// Illustrative console search for low-CPU/high-latency patterns
AppServiceConsoleLogs
| where TimeGenerated between (datetime(2026-04-04 11:22:30) .. datetime(2026-04-04 11:22:36))
| where ResultDescription has_any ("timeout", "pool exhausted", "queue", "heartbeat delayed", "worker")
| project TimeGenerated, ResultDescription
| order by TimeGenerated desc
Example Output
| TimeGenerated | ResultDescription |
|---|---|
| 2026-04-04 11:22:35 | dependency call timeout target=db-primary elapsed_ms=3000 |
| 2026-04-04 11:22:35 | request queued route=/api/orders/summary queue_depth=12 |
| 2026-04-04 11:22:34 | pool exhausted for upstream=inventory-api acquire_timeout_ms=1200 |
| 2026-04-04 11:22:34 | [gunicorn] [INFO] Worker heartbeat delayed by blocking I/O |
How to Read This
Timeout + pool exhaustion + queue depth is a classic low-CPU/high-latency triad. Requests are mostly waiting, not computing.
Query 3: Proving platform was stable during latency spike
// Illustrative platform timeline check
AppServicePlatformLogs
| where TimeGenerated between (datetime(2026-04-04 11:22:26) .. datetime(2026-04-04 11:22:36))
| where Message has_any ("started", "health check passed", "scale")
| project TimeGenerated, Level, Message
| order by TimeGenerated desc
Example Output
| TimeGenerated | Level | Message |
|---|---|---|
| 2026-04-04 11:22:30 | Informational | Site: |
| 2026-04-04 11:22:30 | Informational | Container health check passed. |
| 2026-04-04 11:22:28 | Informational | Instance count unchanged. No scale action required. |
How to Read This
Stable platform events during slowdown reduce the probability of cold-start or platform health as primary cause. Move investigation to downstream latency and concurrency controls.
CLI Investigation Commands
az monitor metrics list --resource <app-service-plan-resource-id> --metric "CpuPercentage,MemoryPercentage" --interval PT1M --aggregation Average
az webapp config show --resource-group <resource-group> --name <app-name>
az webapp config appsettings list --resource-group <resource-group> --name <app-name>
az webapp log tail --resource-group <resource-group> --name <app-name>
Example Output (sanitized)
$ az monitor metrics list --resource <app-service-plan-resource-id> --metric "CpuPercentage,MemoryPercentage" --interval PT1M --aggregation Average
timestamp                  CpuPercentage_Average   MemoryPercentage_Average
-------------------------  ----------------------  ------------------------
2026-04-04T11:22:00Z       28.4                    71.3
2026-04-04T11:23:00Z       31.1                    72.0

$ az webapp config show --resource-group <resource-group> --name <app-name>
{
  "alwaysOn": true,
  "linuxFxVersion": "PYTHON|3.12"
}

$ az webapp config appsettings list --resource-group <resource-group> --name <app-name>
[
  {"name": "WEBSITES_PORT", "value": "8000"},
  {"name": "GUNICORN_CMD_ARGS", "value": "--workers 2 --threads 1 --timeout 120"}
]
How to Read This
Low CPU with small worker pool (--workers 2) is enough to produce queue-driven latency if endpoints block on dependencies. Scale decisions should include worker and dependency behavior, not CPU alone.
Normal vs Abnormal Comparison
| Signal | Normal (Healthy) | Abnormal (Slow response, low CPU) |
|---|---|---|
| CPU trend | Increases with latency during compute load | Remains low/moderate while latency spikes |
| Endpoint spread | Similar latency profile across related APIs | Dependency-heavy endpoints much slower than health/static |
| Console clues | Few timeout/pool messages | pool exhausted, dependency timeout, queue depth growth |
| Platform events | Stable and uneventful | Usually still stable (no major platform error) |
| Error pattern | Mostly low latency 2xx | Mix of slow 2xx and occasional 504/499 |
| Tail latency | Controlled P95/P99 | P95/P99 breaches with moderate P50 |
6. Validation and Disproof by Hypothesis
H1: Downstream dependency slowness
- Signals that support
AppServiceHTTPLogsshows highTimeTakenonly on endpoints known to call DB/external APIs.- Application Insights dependencies have increased duration aligned with HTTP latency spikes.
- CPU remains low while request duration and upstream timeout/retry logs increase.
- Slow periods align with dependency-side incidents (Azure status page, API provider incident report, DB load spikes).
- Signals that weaken
- Static/light endpoints with no dependency calls are equally slow.
- Dependency durations remain stable while request latency rises.
- Local in-process operations are slow even when dependency calls are bypassed.
- What to verify
- KQL (
AppServiceHTTPLogs): - KQL (Application Insights dependency correlation):
// Time-bin approximation — for precise per-request correlation, join on operation_Id requests | where timestamp > ago(6h) | summarize req_p95=percentile(duration,95), req_count=count() by bin(timestamp, 5m) | join kind=leftouter ( dependencies | where timestamp > ago(6h) | summarize dep_p95=percentile(duration,95), dep_fail=countif(success==false), dep_count=count() by bin(timestamp, 5m) ) on timestamp | order by timestamp asc - CLI (dependency state examples):
- KQL (
H2: Thread/worker starvation
- Signals that support
AppServiceConsoleLogsincludes Gunicorn messages such asWORKER TIMEOUT, worker restart loops, backlog behavior.- Latency spikes coincide with increased request concurrency, but CPU is still not saturated.
- High tail latency (P99) with moderate median (P50), indicating queueing/contention.
- DB/HTTP client connection pool exhaustion logs (
max pool size reached, acquire timeout).
- Signals that weaken
- Worker count and thread pool are sized conservatively with no timeout/backlog logs.
- Low traffic periods still show high latency.
- Endpoints with no blocking operations remain fast while blocked endpoints are isolated to dependency delay (supports H1 more strongly).
- What to verify
- KQL (
AppServiceConsoleLogsworker errors): - CLI (Linux App Service app settings and startup command):
- Validate current effective Gunicorn startup parameters (
workers,threads,timeout) from startup command / container logs.
- KQL (
H3: Memory pressure causing GC pauses or degraded responsiveness
- Signals that support
- App Service Plan Memory % exceeds ~80% during slowdown windows while CPU stays low/moderate.
- Latency gradually degrades over uptime, then recovers after worker recycle/restart.
- Console logs show memory/GC pressure symptoms (large heap growth, OOM-near behavior, frequent full GC).
- Multiple apps share the same plan and aggregate memory pressure correlates with incident windows.
- Signals that weaken
- Memory % remains stable and comfortably below pressure thresholds during incidents.
- No memory growth trend over time; performance degrades immediately after deployment (points to H4/H2).
- Restart does not temporarily improve latency.
- What to verify
- CLI (plan metrics):
- KQL (latency vs restart correlation):
let slow = AppServiceHTTPLogs | where TimeGenerated > ago(24h) | summarize p95=percentile(TimeTaken,95) by bin(TimeGenerated, 5m); let restarts = AppServicePlatformLogs | where TimeGenerated > ago(24h) | where ResultDescription has_any ("restart", "recycle", "container start") | summarize restart_count=count(), restart_reasons=make_set(ResultDescription) by bin(TimeGenerated, 5m); slow | join kind=leftouter restarts on TimeGenerated | order by TimeGenerated asc - Compare memory trend across all apps in the same plan, not only the affected app.
H4: Platform-side delays (cold start, SNAT contention, shared I/O bottlenecks)
- Signals that support
- Latency spikes begin right after restart, scale event, slot swap, or deployment.
AppServicePlatformLogsshow restart/container initialization events aligned with user-facing delay.- SNAT detector reports high/critical outbound port usage during high-latency periods.
- Endpoints that perform outbound calls or shared storage access are disproportionately slow.
- Signals that weaken
- No restart/scale/deployment event near incident windows.
- SNAT detector is healthy and outbound call volume is low.
- Warm instances still show consistent latency long after startup.
- What to verify
- KQL (
AppServicePlatformLogsevent timeline): - Azure portal detector: Diagnose and Solve Problems -> SNAT Port Exhaustion.
- CLI (deployment history timing):
- Confirm whether code path reads/writes on mounted/shared storage for hot request paths.
- KQL (
7. Likely Root Cause Patterns
- Pattern A: Blocking dependency calls exhaust Gunicorn concurrency
- Python App Service Linux apps often run Gunicorn sync workers. A few long synchronous dependency calls can occupy all workers, increasing queue wait and P95/P99 without high CPU.
- Pattern B: Memory leak or heap growth drives periodic degradation
- Over hours/days, memory pressure rises at plan/app level; latency worsens before recycle, then temporarily improves after restart.
- Pattern C: SNAT contention for outbound-heavy workloads
- High outbound connection churn (short-lived HTTP calls, insufficient connection reuse) causes connect delays/timeouts while CPU stays low.
- Pattern D: Cold-start windows after restart/deployment
- Container initialization, dependency warm-up, and JIT/cache priming create temporary slow responses immediately after app restarts or new instances come online.
Investigation Notes
- Low App Service Plan CPU does not eliminate resource contention; requests may be waiting on I/O, locks, pool acquisition, network, or queue depth.
- Gunicorn concurrency is finite: sync workers process one request at a time per worker. Long-running blocking operations create tail latency before CPU saturation appears.
- Distinguish plan-level metrics from app/instance behavior. A single problematic app instance can be masked by aggregate plan CPU.
- On App Service Linux, file access patterns that depend on shared or mounted storage can introduce latency variance compared with purely local in-container memory access.
Quick Conclusion
When App Service Linux latency is high but CPU is low, prioritize a hypothesis-driven check of dependency latency, worker concurrency limits, memory pressure trends, and platform events rather than CPU-only scaling decisions. Use AppServiceHTTPLogs, AppServiceConsoleLogs, AppServicePlatformLogs, and plan metrics together in the same time window to validate or disprove each hypothesis. Apply short-term mitigations to stabilize user impact, then implement durable worker/dependency architecture fixes to prevent recurrence.
8. Immediate Mitigations
- Increase Gunicorn workers/threads conservatively and redeploy startup command (temporary, risk-bearing: can increase memory pressure).
- Reduce outbound timeout and add bounded retries with jitter for dependency calls (production-safe if tuned carefully).
- Trigger controlled scale-out for temporary headroom while investigation continues (temporary, diagnostic for concurrency bottleneck).
- Restart affected app instance(s) to clear degraded worker state (temporary, risk-bearing: short disruption/cold start).
- Enable/expand Application Insights dependency collection and sampling override during incident window (diagnostic, production-safe with cost consideration).
9. Prevention
- Redesign hot endpoints to use async/non-blocking I/O and connection reuse (HTTP keep-alive, pooled DB connections).
- Right-size worker model using measured concurrency (Gunicorn worker class, workers, threads, timeout) and load-test baselines.
- Add dependency resilience: circuit breakers, bulkheads, per-dependency timeout budgets, fallback behavior.
- Isolate noisy neighbors by moving critical apps to dedicated App Service Plan capacity where needed.
- Build SLO-driven alerting on P95/P99 latency plus dependency duration, memory trend, and restart correlation.
Limitations
- Windows-specific behavior is out of scope.
- Framework-specific tuning (Django vs Flask vs FastAPI) is not covered in depth.
- This playbook focuses on symptom separation, not application architecture redesign.
See Also
Related Queries
../../kql/http/latency-trend-by-status-code.md../../kql/http/slowest-requests-by-path.md../../kql/correlation/latency-vs-errors.md../../kql/restarts/restart-timing-correlation.md