No Space Left on Device / Ephemeral Storage Pressure (Azure App Service Linux)
1. Summary
Symptom
Applications on Azure App Service Linux intermittently fail with No space left on device, especially during startup, deployment, package extraction, file upload, cache writes, or runtime temporary file creation. Typical impact includes failed deployments, container startup failures, write exceptions, and request errors.
Why this scenario is confusing
The issue often looks like an application bug, but the underlying constraint can be storage tier specific: /home is persistent but quota-limited, while /tmp and container writable layers are ephemeral and can fill quickly under build/runtime activity. Restarting may briefly clear symptoms (especially /tmp) and hide root cause, leading to repeated incidents.
Troubleshooting decision flow
graph TD
    A[Symptom: "No space left on device"] --> B{Where is pressure?}
    B --> C[Check /home usage and growth]
    B --> D[Check /tmp and container writable layer usage]
    C --> E{High /home usage?}
    E -->|Yes| H1[H1: Oryx/build artifacts or persistent app files fill /home]
    E -->|No| F{High /tmp or layer usage?}
    D --> F
    F -->|Yes| H2[H2: Temp/log/cache growth in /tmp or app layer]
    F -->|No| G{Deployment/runtime still fails?}
    G -->|Yes| H3[H3: Image extraction/layer cache exceeds ephemeral budget]
    G -->|No| H4[H4: Misattributed storage signal; verify competing bottlenecks]
2. Common Misreadings
- "Disk errors mean the Azure Storage account is full." (App Service local storage is separate.)
- "Restart fixed it, so root cause is resolved." (Ephemeral cleanup can mask recurring writes.)
- "Only
/homematters." (/tmpand container writable layers can fail first.) - "Deployment failed because code is broken." (Oryx artifacts and extracted dependencies can exhaust quota.)
- "This is a Windows/IIS quota issue." (This playbook is Linux App Service filesystem behavior.)
3. Competing Hypotheses
- H1: Persistent
/homequota exhaustion from Oryx build artifacts, retained deployment packages, or application-generated files. - H2: Ephemeral
/tmpor writable layer exhaustion due to temp files, logs, or cache growth during runtime. - H3: Container image extraction/layer pressure where pulled/extracted layers exceed available ephemeral budget during startup or deployment.
- H4: Storage symptom is secondary to another issue (restart storms, repeated failed startups, request amplification) that accelerates file churn.
4. What to Check First
Metrics
- App restart count and timing versus deployment windows.
- HTTP error drift (
ScStatus5xx/4xx) and latency increase (TimeTaken) during suspected storage events. - If available, App Service plan resource utilization trend around incident windows.
Logs
AppServiceConsoleLogsfor exactNo space left on device, write failures, extraction failures, Oryx build errors.AppServicePlatformLogsfor container lifecycle events (OperationName) and repeated container changes (ContainerId).AppServiceHTTPLogsfor endpoint-specific impact (CsUriStem) and status/latency changes (ScStatus,TimeTaken).
Portal view: Log stream for live No space left on device detection
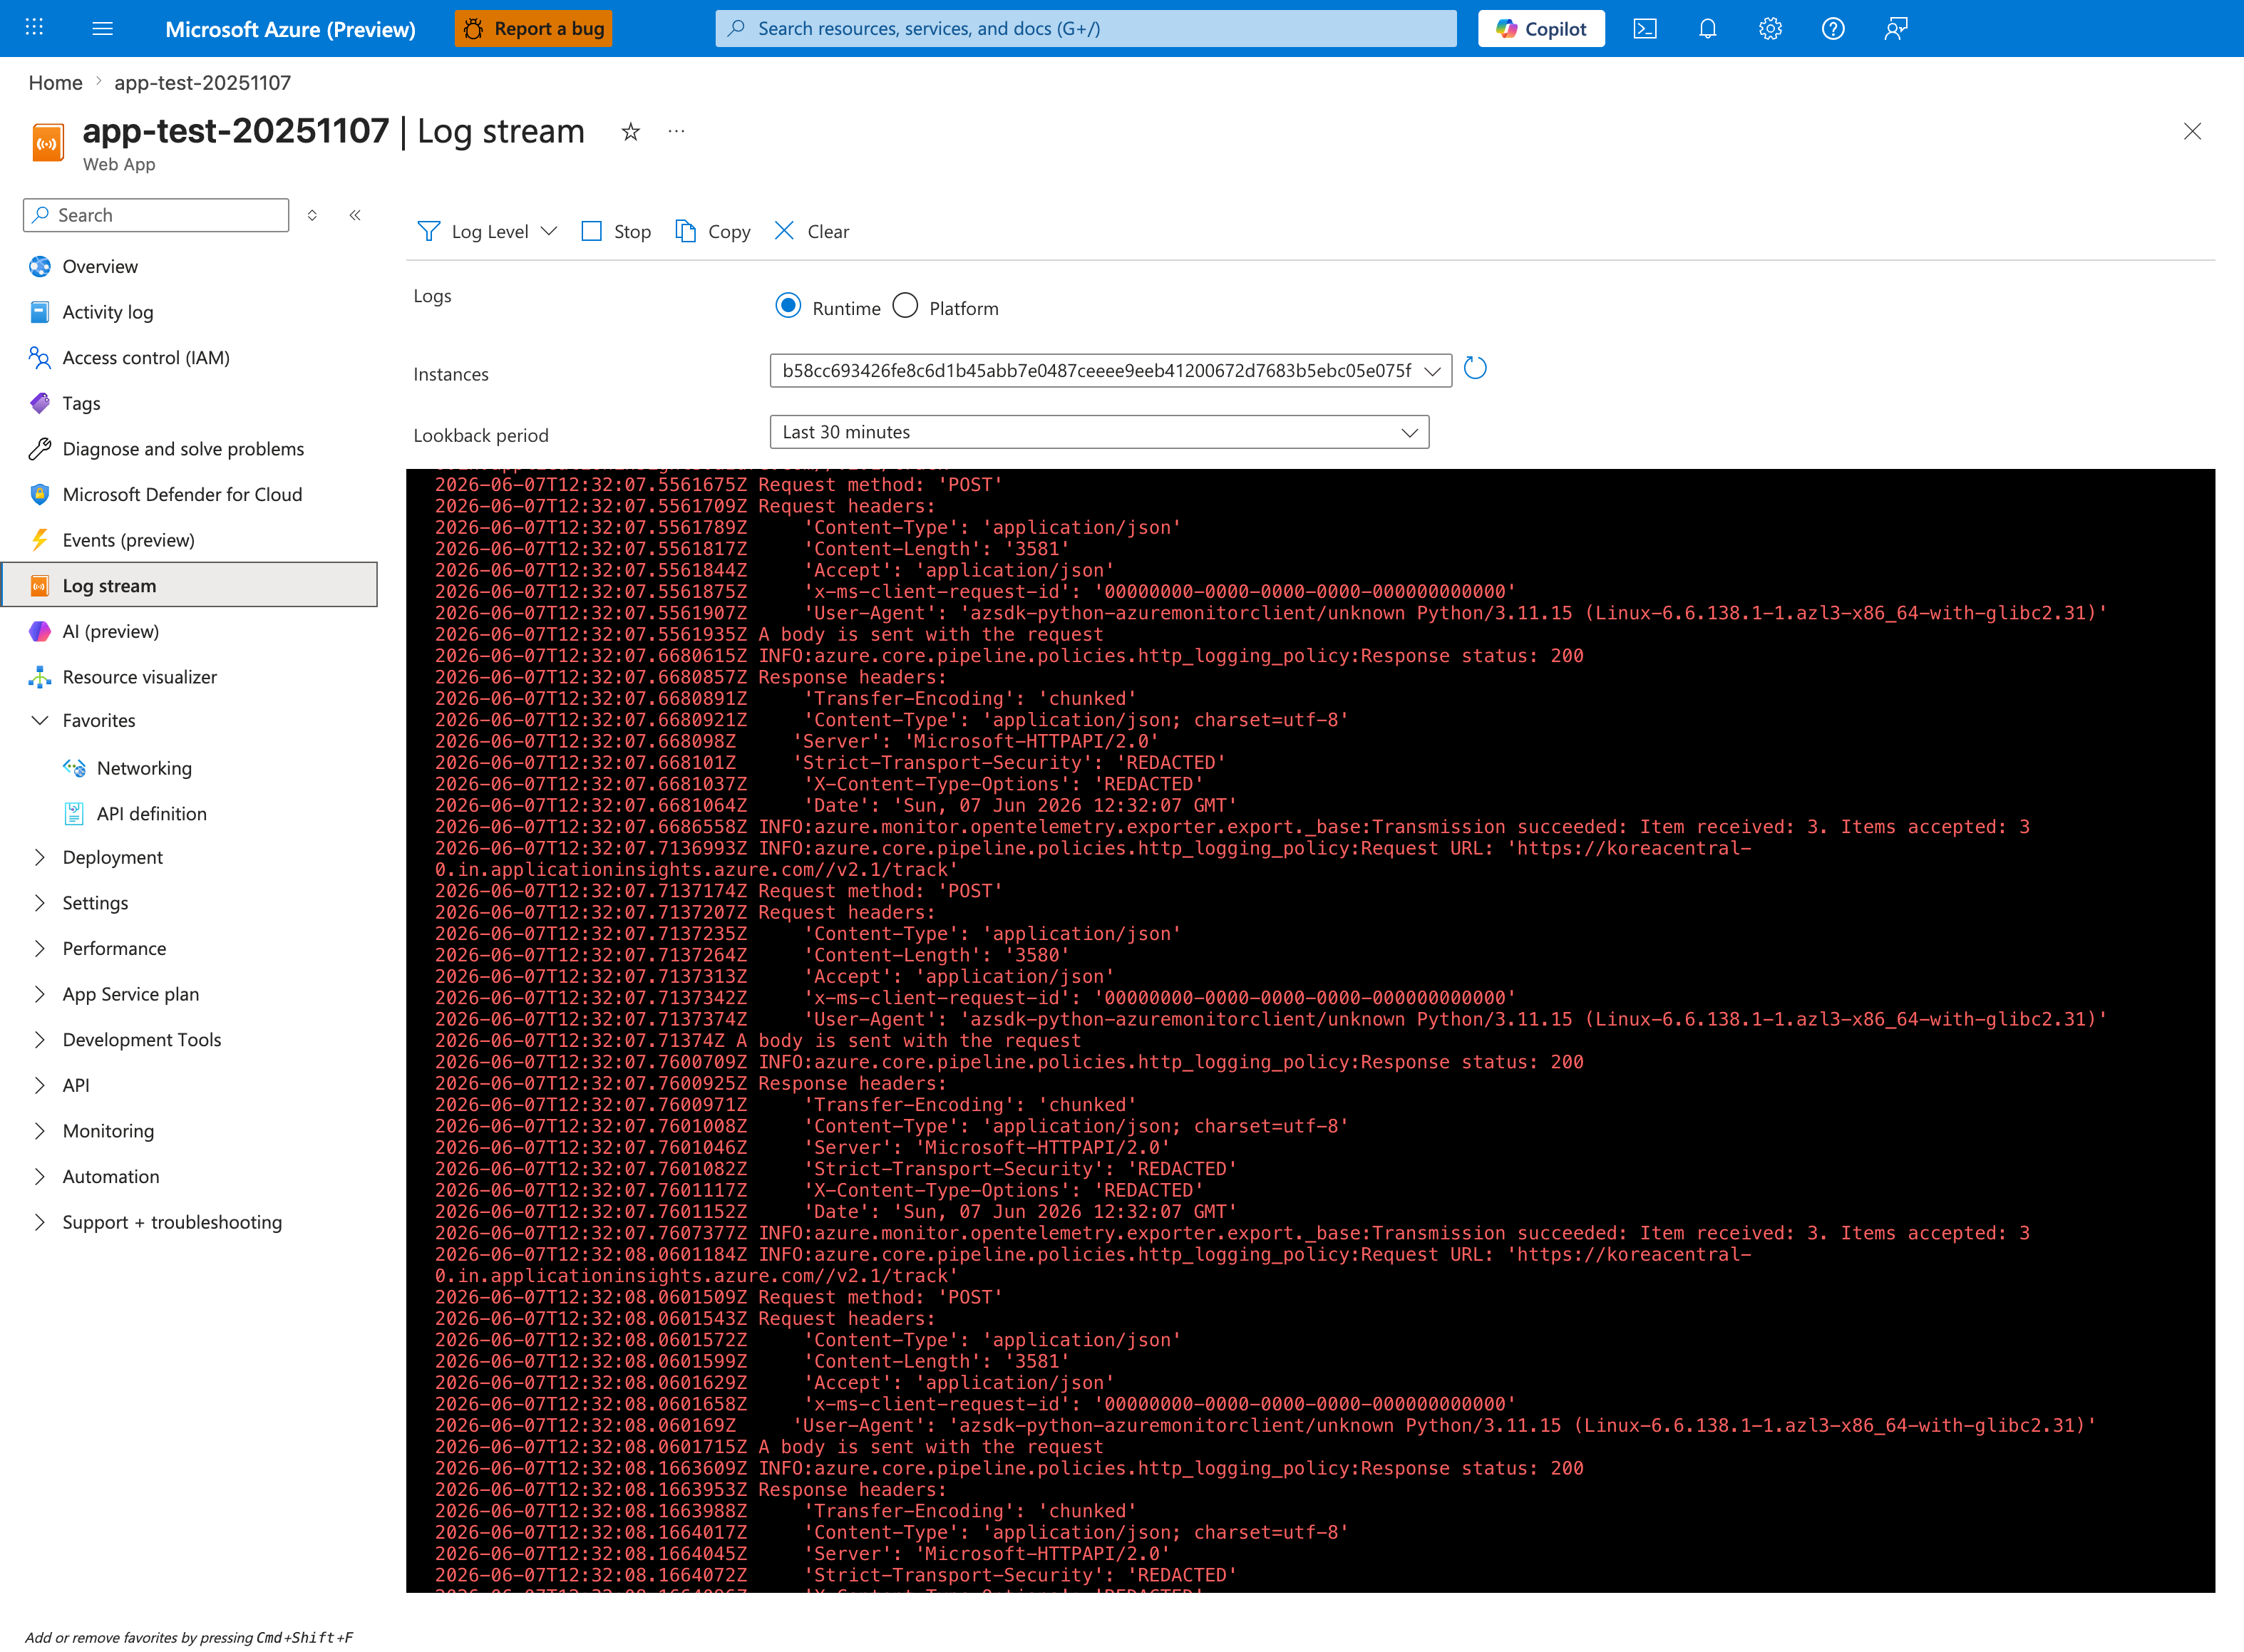
The Log stream blade is the fastest way to catch the exact No space left on device write exception in flight, because it surfaces AppServiceConsoleLogs lines within ~5 seconds of emission — before they reach Log Analytics ingestion (which has a 2-5 minute delay). Keep the Runtime Logs radio selected and Instances set to All Instances so you see write failures from whichever instance is currently saturating its writable layer, then trigger the suspected workload (deployment, upload, build, cache warmup) and watch for the literal [Errno 28] No space left on device substring alongside the affected file path. The path itself is the decisive evidence: /home/... errors indicate persistent quota exhaustion (H1) and survive restart, while /tmp/... or container-layer paths indicate ephemeral pressure (H2/H3) that restart appears to fix but the underlying write pattern remains.
Platform Signals
- Confirm whether failure starts during deployment (
SCM_DO_BUILD_DURING_DEPLOYMENT=true) versus steady runtime. - Confirm Linux file target (
/home,/tmp, extracted image path) from console traces. - Check if incidents correlate with fresh image pulls, startup retries, or sudden request volume.
5. Evidence to Collect
Required Evidence
- Console log excerpts showing
No space left on deviceand adjacent operations (build, unzip, write, cache, temp). - Platform log timeline with
OperationName,ContainerId,ResultDescriptionto detect restart/recreate loops. - HTTP timeline showing status/latency impact by path.
- Current app settings relevant to build/runtime writes (for example
SCM_DO_BUILD_DURING_DEPLOYMENT, temp/cache/log paths).
Useful Context
- App Service Plan SKU and expected storage constraints for the tier.
- Whether app writes to
/home,/tmp, or both. - Deployment strategy (Zip Deploy, container image deploy, build on deploy).
- Recent changes that increased artifact size (dependencies, model files, static bundles).
Sample Log Patterns
AppServiceHTTPLogs (no-space lab)
2026-04-04T11:23:04Z  GET  /diag/env      200  2
2026-04-04T11:23:03Z  GET  /diag/stats    200  20
2026-04-04T11:22:32Z  GET  /disk-status   200  8
2026-04-04T11:22:32Z  GET  /fill-home     200  11360
2026-04-04T11:22:30Z  GET  /fill-home     200  9648
2026-04-04T11:22:29Z  GET  /fill-tmp      200  8071
2026-04-04T11:22:28Z  GET  /fill-home     200  7641
2026-04-04T11:22:27Z  GET  /fill-home     200  6131
AppServiceConsoleLogs (startup/runtime baseline)
2026-04-04T11:14:00Z  [2026-04-04 11:14:00 +0000] [1895] [INFO] Starting gunicorn 25.3.0
2026-04-04T11:14:00Z  [2026-04-04 11:14:00 +0000] [1895] [INFO] Listening at: http://0.0.0.0:8000 (1895)
2026-04-04T11:14:00Z  [2026-04-04 11:14:00 +0000] [1897] [INFO] Booting worker with pid: 1897
2026-04-04T11:14:00Z  [2026-04-04 11:14:00 +0000] [1898] [INFO] Booting worker with pid: 1898
2026-04-04T11:14:01Z  [2026-04-04 11:14:01 +0000] [1895] [INFO] Control socket listening at /root/.gunicorn/gunicorn.ctl
AppServicePlatformLogs (timeout/stop signature)
2026-04-04T11:14:24Z  Informational  State: Stopping, Action: StoppingSiteContainers, LastError: ContainerTimeout, LastErrorTimestamp: 04/04/2026 10:58:30
2026-04-04T11:14:30Z  Informational  Container is terminated. Total time elapsed: 5749 ms.
2026-04-04T11:14:30Z  Informational  Site: <app-name> stopped.
How to Read This
/fill-home and /fill-tmp are successful (200) but very slow (6-11 seconds), which means the filesystem is under stress before total failure. This is an early-warning phase where users feel severe slowness before clear write exceptions appear.
KQL Queries with Example Output
Query 1: Write-heavy endpoint latency profile
AppServiceHTTPLogs
| where TimeGenerated between (datetime(2026-04-04 11:22:25) .. datetime(2026-04-04 11:23:05))
| project TimeGenerated, CsMethod, CsUriStem, ScStatus, TimeTaken
| order by TimeGenerated desc
Example Output
| TimeGenerated | CsMethod | CsUriStem | ScStatus | TimeTaken |
|---|---|---|---|---|
| 2026-04-04 11:23:04 | GET | /diag/env | 200 | 2 |
| 2026-04-04 11:23:03 | GET | /diag/stats | 200 | 20 |
| 2026-04-04 11:22:32 | GET | /disk-status | 200 | 8 |
| 2026-04-04 11:22:32 | GET | /fill-home | 200 | 11360 |
| 2026-04-04 11:22:30 | GET | /fill-home | 200 | 9648 |
| 2026-04-04 11:22:29 | GET | /fill-tmp | 200 | 8071 |
| 2026-04-04 11:22:28 | GET | /fill-home | 200 | 7641 |
| 2026-04-04 11:22:27 | GET | /fill-home | 200 | 6131 |
How to Read This
Compare /fill-home and /fill-tmp against diagnostics endpoints. Fast diagnostics with slow write endpoints indicate storage I/O pressure, not a whole-app CPU bottleneck.
Query 2: Console startup clues and runtime context
AppServiceConsoleLogs
| where TimeGenerated between (datetime(2026-04-04 11:13:58) .. datetime(2026-04-04 11:14:05))
| project TimeGenerated, Level, ResultDescription
| order by TimeGenerated desc
Example Output
| TimeGenerated | Level | ResultDescription |
|---|---|---|
| 2026-04-04 11:14:01 | Error | [2026-04-04 11:14:01 +0000] [1895] [INFO] Control socket listening at /root/.gunicorn/gunicorn.ctl |
| 2026-04-04 11:14:00 | Error | [2026-04-04 11:14:00 +0000] [1898] [INFO] Booting worker with pid: 1898 |
| 2026-04-04 11:14:00 | Error | [2026-04-04 11:14:00 +0000] [1897] [INFO] Booting worker with pid: 1897 |
| 2026-04-04 11:14:00 | Error | [2026-04-04 11:14:00 +0000] [1895] [INFO] Listening at: http://0.0.0.0:8000 (1895) |
| 2026-04-04 11:14:00 | Error | [2026-04-04 11:14:00 +0000] [1895] [INFO] Starting gunicorn 25.3.0 |
How to Read This
Startup appears normal initially; the incident is triggered by subsequent write-heavy operations. This helps separate startup-command issues from filesystem saturation issues.
Query 3: Platform timeout sequence
AppServicePlatformLogs
| where TimeGenerated between (datetime(2026-04-04 11:14:20) .. datetime(2026-04-04 11:14:35))
| project TimeGenerated, Level, Message
| order by TimeGenerated desc
Example Output
| TimeGenerated | Level | Message |
|---|---|---|
| 2026-04-04 11:14:30 | Informational | Site: |
| 2026-04-04 11:14:30 | Informational | Container is terminated. Total time elapsed: 5749 ms. |
| 2026-04-04 11:14:24 | Informational | State: Stopping, Action: StoppingSiteContainers, LastError: ContainerTimeout, LastErrorTimestamp: 04/04/2026 10:58:30 |
How to Read This
ContainerTimeout without immediate syntax/import failures often indicates startup/runtime couldn’t finish in time due to resource stress, including disk pressure.
CLI Investigation Commands
az webapp config appsettings list --resource-group <resource-group> --name <app-name>
az webapp log tail --resource-group <resource-group> --name <app-name>
az webapp ssh --resource-group <resource-group> --name <app-name>
Example Output (sanitized)
$ df -h /home /tmp
Filesystem      Size  Used Avail Use% Mounted on
/dev/root        30G  1.7G   28G   5.65% /home
tmpfs            1.0G  602M  422M  58.76% /tmp

$ du -sh /home/site/wwwroot/*
8.0K  /home/site/wwwroot/startup.sh
2.1M  /home/site/wwwroot/src
407M  /home/site/wwwroot/data
How to Read This
Use both percentages and absolute size. A moderate % can still be problematic if hot paths repeatedly write large files (for example 100 MB blocks) faster than cleanup.
Normal vs Abnormal Comparison
| Signal | Normal (Healthy) | Abnormal (No-space incident) |
|---|---|---|
/fill-home runtime | Occasional test writes complete quickly | Repeated 6-11 second writes |
/fill-tmp runtime | Short-lived temp writes, low variance | Multi-second write latency and rising retry behavior |
/disk-status | Stable and low utilization trend | Rapid growth in /tmp or /home usage |
| Platform lifecycle | No frequent timeout/stop transitions | ContainerTimeout followed by stop/terminate events |
| App availability | Stable under write load | Slow requests, then write failures or restarts |
6. Validation and Disproof by Hypothesis
H1: Persistent /home quota exhaustion
- Signals that support
- Errors begin during deployment/build or shortly after release.
- Repeated console messages indicate write/extract failures under
/home. - Incidents persist across restart because persistent storage remains full.
- Signals that weaken
- Restart immediately and durably resolves issue without cleanup.
- Logs point to temp paths only and
/homereferences are absent. - Failures correlate only with transient load spikes.
- What to verify
- KQL (console storage errors and
/homecontext):AppServiceConsoleLogs | where TimeGenerated > ago(24h) | where ResultDescription has "No space left on device" or ResultDescription has "/home" or ResultDescription has_any ("oryx", "SCM_DO_BUILD_DURING_DEPLOYMENT", "extract", "unzip", "tar") | project TimeGenerated, ResultDescription | order by TimeGenerated desc - KQL (deploy/start impact seen in platform events):
- CLI (inspect settings and stream logs):
- KQL (console storage errors and
H2: Ephemeral /tmp or writable layer exhaustion at runtime
- Signals that support
- Errors spike during traffic peaks, uploads, report generation, or cache warmups.
- Console logs reference
/tmpand temporary write failures. - Restart gives short-term relief, then issue returns as temp data accumulates.
- Signals that weaken
- Failures happen only during deployment with low runtime traffic.
- No temp-path references in console output.
- Endpoint latency/error profile does not change when failures occur.
- What to verify
- KQL (runtime temp-file/storage errors):
- KQL (path and status impact during the same window):
- CLI (restart for controlled comparison):
H3: Image extraction or container layer pressure
- Signals that support
- Startup/deployment fails after image updates or dependency size growth.
- Platform logs show repeated container creation/start attempts with changing
ContainerId. - Console logs include extraction, layer, or filesystem write failures before app binds.
- Signals that weaken
- Same image starts consistently on larger SKU without changes in behavior.
- Failures happen long after startup and only under request load.
- Container lifecycle is stable while errors are request-path-specific.
- What to verify
- KQL (container lifecycle churn):
- KQL (startup console failure signatures):
- CLI (container configuration and deployment context):
H4: Storage signal is secondary to another churn pattern
- Signals that support
- Repeated startup failures/restarts produce large log and temp churn.
- HTTP error bursts align with restart windows rather than sustained storage growth.
- Console logs show mixed primary failures with storage errors appearing later in sequence.
- Signals that weaken
- Storage errors are first failure event and remain dominant across windows.
- Cleaning up files immediately resolves incident without further restart loops.
- No evidence of repeated container lifecycle operations.
- What to verify
- KQL (restart-timing correlation):
- KQL (HTTP blast radius near churn windows):
- CLI (recent deployments and config drift checks):
7. Likely Root Cause Patterns
- Pattern A: Build-on-deploy accumulation in
/home- Oryx temporary/build artifacts and deployment outputs are retained beyond expected lifecycle, saturating persistent quota.
- Pattern B: Runtime temp/cache/log growth in
/tmpor writable paths- App writes unbounded temp files, buffered payloads, or verbose local logs without cleanup.
- Pattern C: Image/dependency footprint outgrows ephemeral budget
- Larger container layers or extracted packages push startup over available ephemeral space.
- Pattern D: Restart churn amplifies storage pressure
- Repeated startup attempts continuously rewrite temporary files/log fragments, turning transient stress into persistent incident.
Investigation Notes
/homepersistence means restart alone usually does not fix true quota exhaustion there./tmpand writable-layer pressure can clear after restart, which can mislead responders.SCM_DO_BUILD_DURING_DEPLOYMENT=trueis a high-signal clue when failures start during deployment.- Always align console, platform, and HTTP timelines; isolated evidence can misattribute causality.
- For Linux App Service, prioritize filesystem path evidence over generic "disk full" assumptions.
Quick Conclusion
Treat No space left on device on App Service Linux as a path-specific storage diagnosis: separate persistent /home quota exhaustion from ephemeral /tmp or writable-layer pressure, then validate hypotheses with AppServiceConsoleLogs, AppServicePlatformLogs, and AppServiceHTTPLogs in one timeline. Stabilize quickly with cleanup and configuration controls, then prevent recurrence by minimizing build/runtime disk writes and enforcing bounded temp/cache behavior.
8. Immediate Mitigations
- Disable build-on-deploy if not required and deploy prebuilt artifacts (production-safe when CI build parity is validated).
- Remove or rotate non-essential files under app-managed paths, prioritizing known temp/cache outputs (risk-bearing if deletion scope is unclear).
- Redirect temp/cache paths to controlled locations and enforce cleanup on startup/shutdown (production-safe with app validation).
- Reduce local logging verbosity and avoid large on-disk debug dumps (production-safe).
- Scale to a higher App Service Plan SKU for temporary headroom (production-safe, cost impact).
- Restart app after cleanup to reset ephemeral state and verify recovery window (temporary, brief disruption).
9. Prevention
- Move all build activity to CI/CD and publish deploy-ready artifacts to minimize runtime/build writes on App Service.
- Enforce strict quotas and eviction policies for application temp/cache/log directories.
- Keep container images lean (multi-stage builds, minimal runtime dependencies, remove build-only assets).
- Stream logs to centralized sinks instead of retaining large local files.
- Add alerts on repeated
No space left on devicesignatures and correlated restart spikes. - Validate storage behavior in load tests, including upload/report/cache-heavy workflows.
Limitations
- This playbook targets Azure App Service Linux storage pressure scenarios only.
- It does not cover Windows/IIS filesystem behavior.
- It does not provide app-language-specific file I/O profiling guidance.
- Platform internals for host-level storage allocation are abstracted and may not be fully visible in tenant logs.