Detector Map
Quick reference for Azure App Service Diagnostics detectors relevant to Linux/OSS troubleshooting.
graph TD
    A[Troubleshooting scenario] --> B{Scenario type}
    B --> C[Startup or availability]
    B --> D[Performance degradation]
    B --> E[Outbound connectivity]
    C --> F[Web App Down]
    C --> G[Running Containers]
    D --> H[HTTP Server Errors]
    D --> I[Plan CPU and Memory]
    E --> J[SNAT Port Exhaustion]
    E --> K[TCP Connections]
    F --> L[Validate with logs and metrics]
    I --> L
    J --> L
How to Access
Navigate to your App Service in the Azure Portal → Diagnose and solve problems.
Portal view: Diagnose and solve problems hub (category landing)
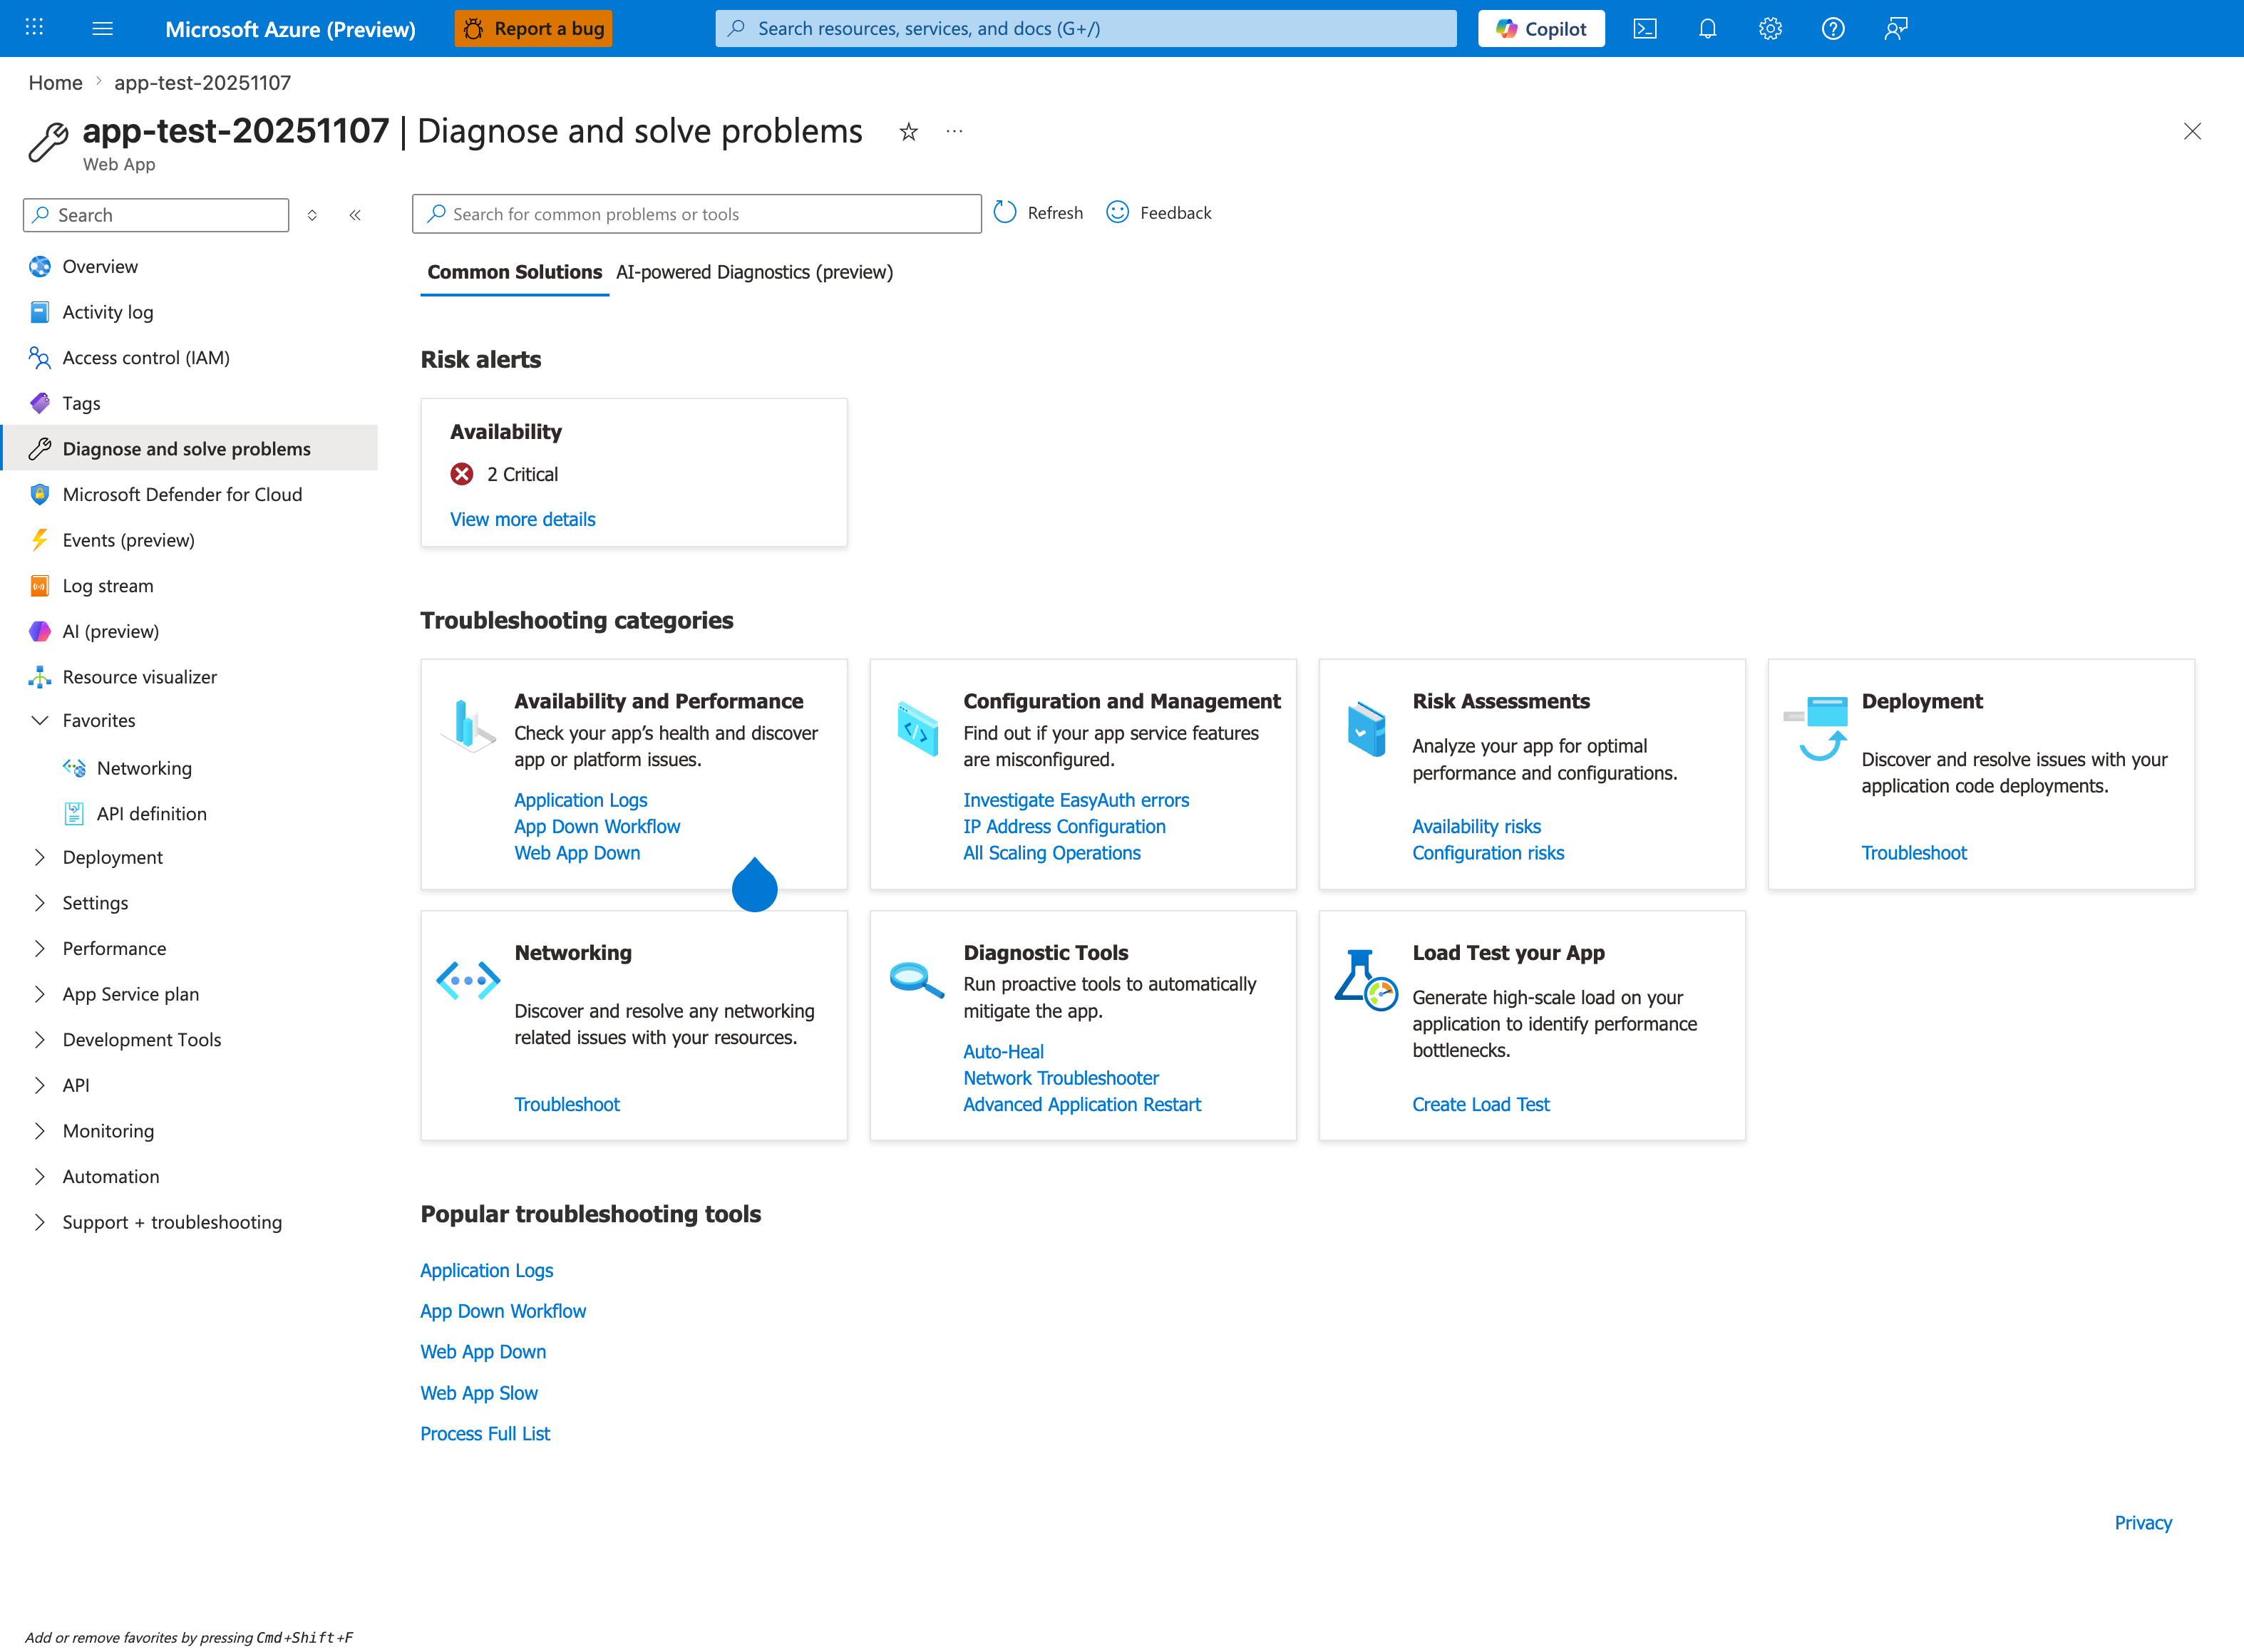
This is the landing page for every detector in the reference table below. The seven category cards map directly to the Category column - the visible quick links under Availability and Performance are Application Logs, App Down Workflow, and Web App Down, while Networking and Configuration and Management expose their own troubleshoot links (the table below maps the full detector set per category). The Risk alerts Availability card with 2 Critical surfaces detectors that have already flagged anomalies for this app, so triaging risks here before running individual detectors is the fastest path to a hypothesis. The Common Solutions tab (currently selected) lists pre-built workflows; the adjacent AI-powered Diagnostics (preview) tab gives a synthesized narrative across detectors, but per the Detector Limitations section it remains a starting point - validate with logs.
Detector Reference
| Detector | Category | What It Shows | When to Use | Related Playbook |
|---|---|---|---|---|
| Web App Down | Availability | Whether the app is responding to requests | App not loading, 503 errors | container-didnt-respond-to-http-pings |
| Linux - Number of Running Containers | Availability | Container count over time, start/stop events | Startup failures, unexpected restarts | container-didnt-respond-to-http-pings |
| SNAT Port Exhaustion | Networking | SNAT port allocation and usage per instance | Outbound connection failures, intermittent timeouts | snat-or-application-issue |
| TCP Connections | Networking | Active TCP connections per instance | Connection leak detection, pool exhaustion | snat-or-application-issue |
| HTTP Server Errors | Performance | 5xx error trends over time | Intermittent server errors under load | intermittent-5xx-under-load |
| App Service Plan CPU | Performance | Plan-level CPU utilization percentage | Performance degradation investigation | slow-response-but-low-cpu |
| App Service Plan Memory | Performance | Plan-level memory utilization percentage | Memory pressure, gradual degradation | memory-pressure-and-worker-degradation |
| Application Logs | Diagnostics | App stdout/stderr output | Runtime errors, crash investigation | All playbooks |
| Deployment Logs | Configuration | Deployment history and status | Post-deployment failures | All startup playbooks |
Portal view: Web App Down detector (healthy baseline output)
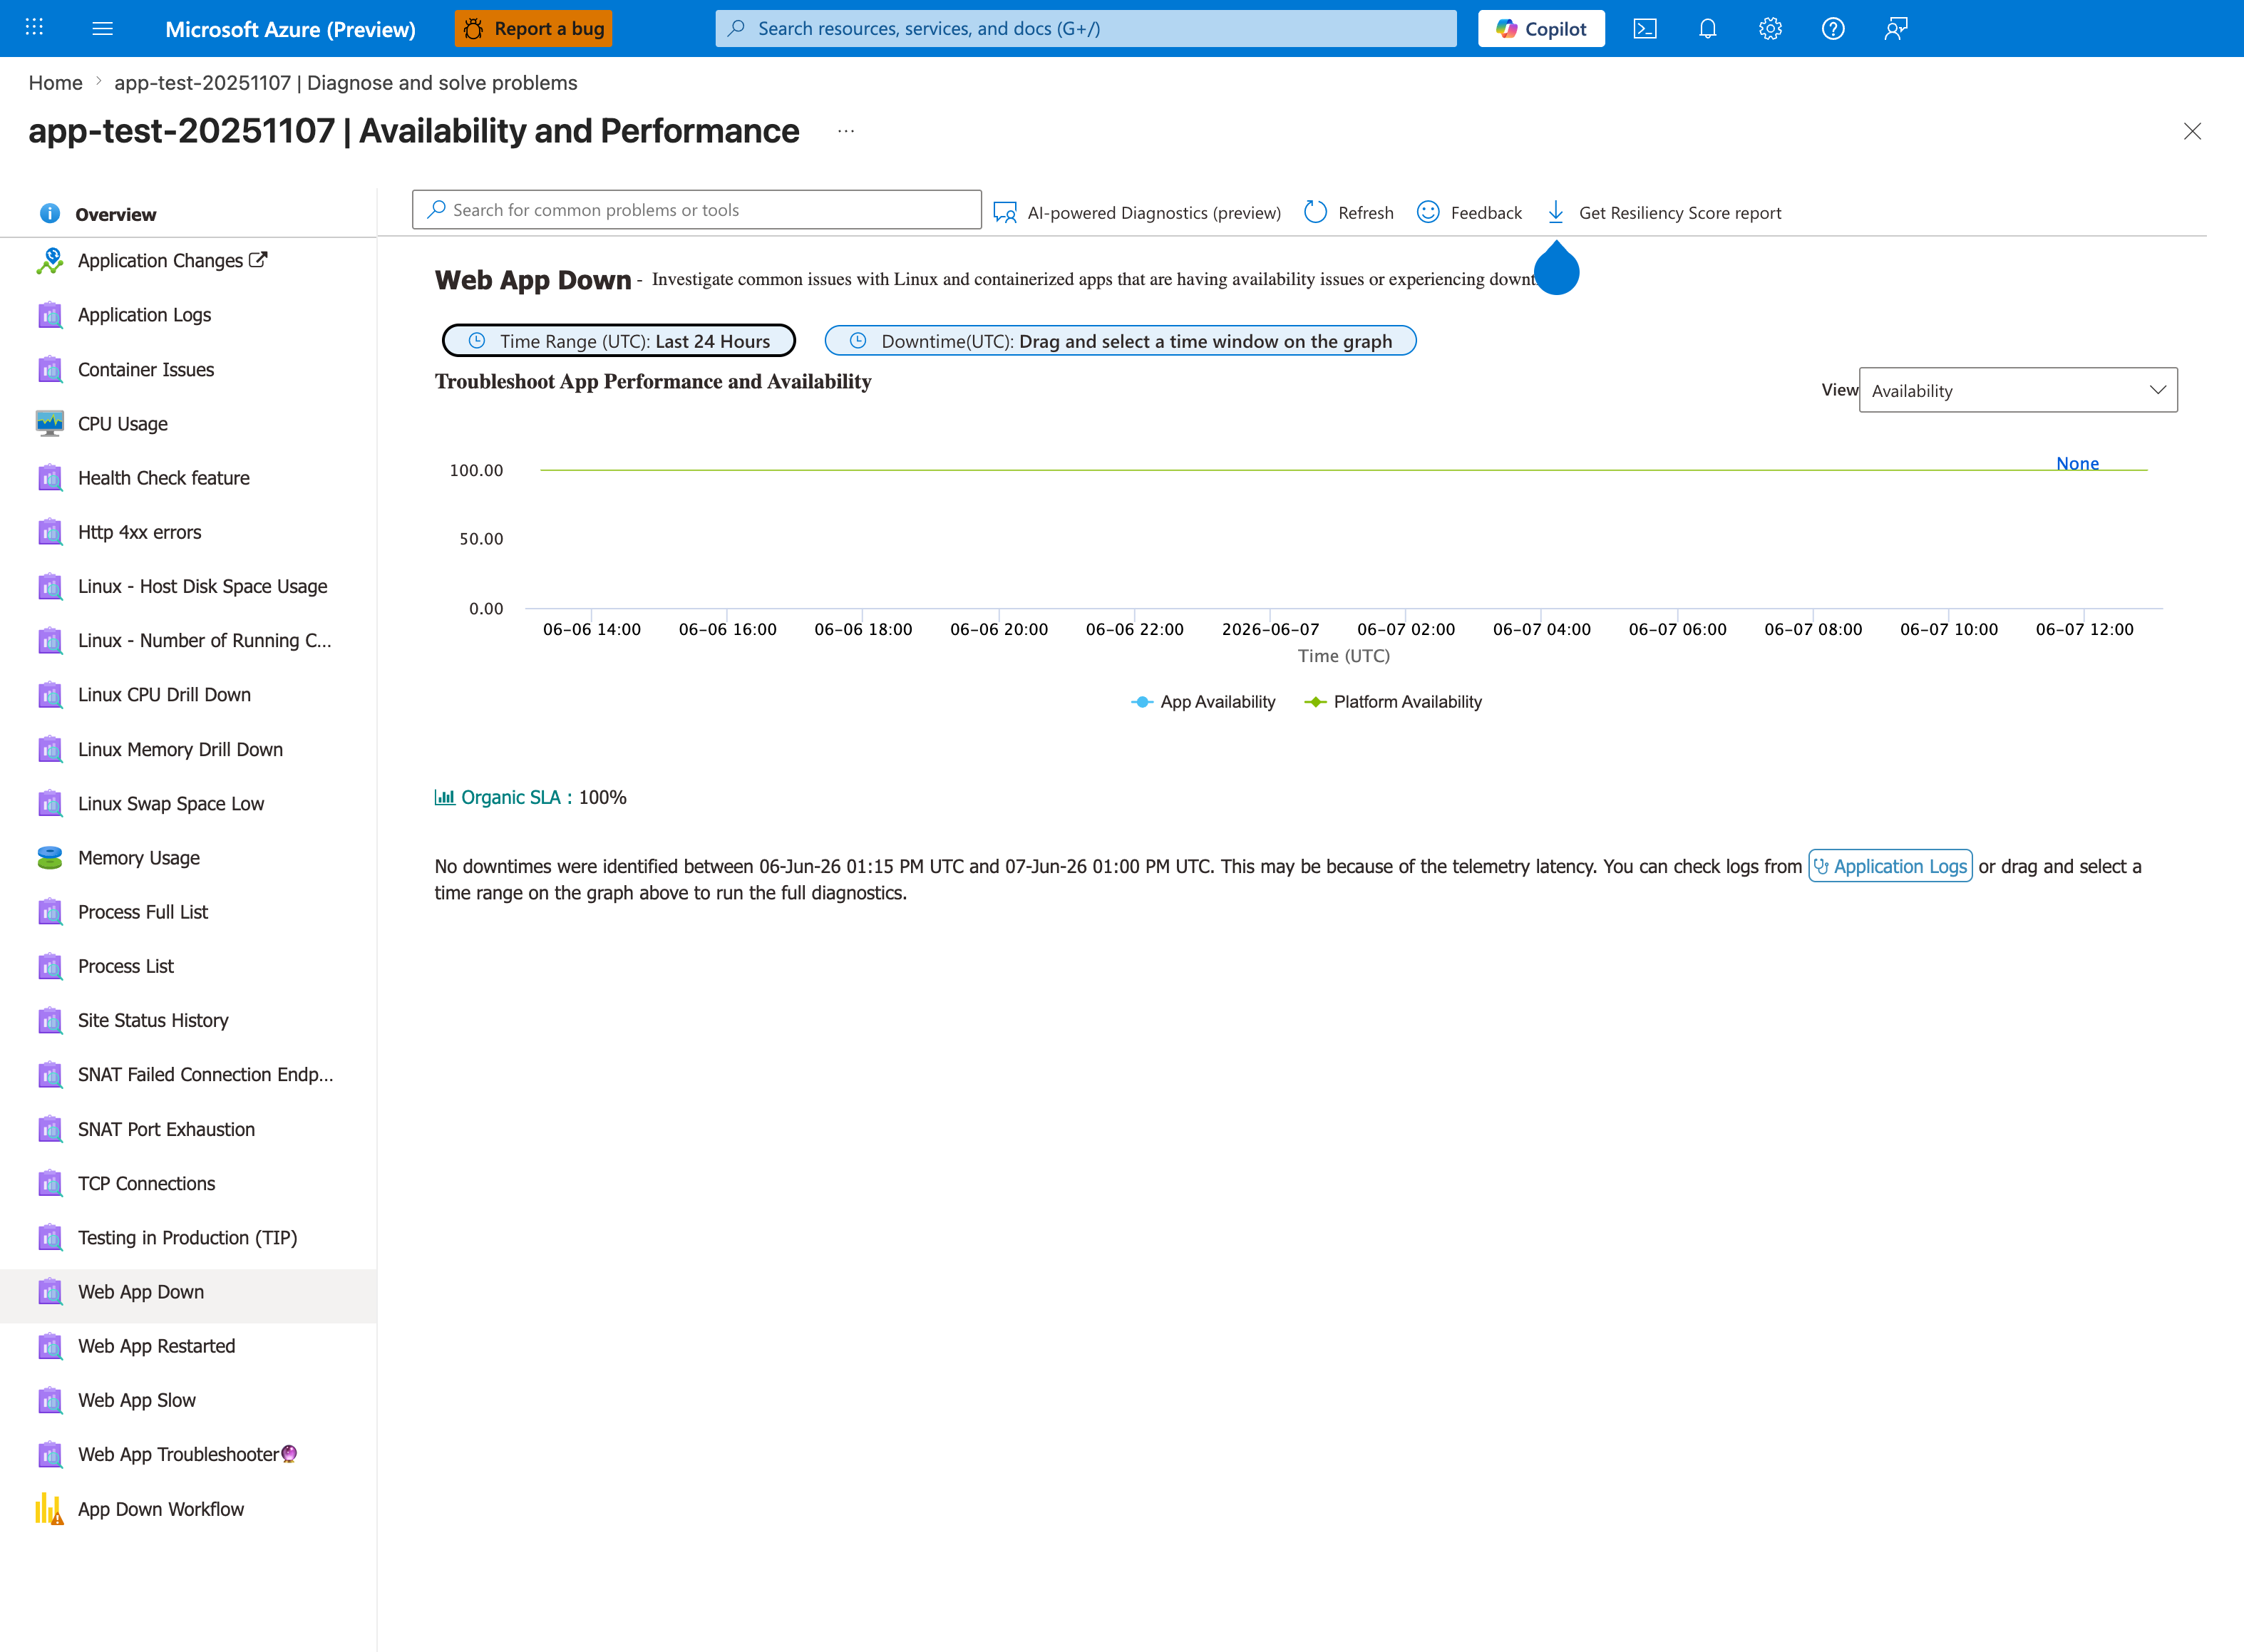
This is what Web App Down looks like when the app is healthy - both App Availability and Platform Availability at 100%, Organic SLA: 100%, and the explicit "No downtimes were identified" banner. The distinction between App Availability (your code responding) and Platform Availability (the App Service infrastructure healthy) is critical for triage: a low App Availability with high Platform Availability points to application/container issues (use container-didnt-respond-to-http-pings); a low Platform Availability points to platform incidents - check Azure Status before code changes. The left-rail detector list also reveals the sibling detectors you'd hop to next: Container Issues, Linux CPU Drill Down, Web App Restarted. The 24-hour scope shown here is the detector default and matches the Time scope limitation noted below.
Detector Limitations
- Data refresh delay: 5–15 minute lag between an event and its appearance in diagnostics.
- Sampling: High-volume detectors may sample events rather than capturing every occurrence.
- Linux coverage gaps: Some Windows-only profiling tools (e.g., CLR Profiler) have no Linux equivalent.
- Platform-level focus: Detectors see stdout/stderr but cannot inspect application memory or stack without Application Insights.
- Time scope: Some detectors only analyze the last 24 hours — use Log Analytics directly for older data.
- Starting point, not conclusion: Detector output is a hypothesis generator. Always validate with logs and metrics.
CLI Equivalents
# Application logs (same data as Application Logs detector)
az webapp log show --resource-group $RG --name $APP_NAME

# CPU metrics (same data as App Service Plan CPU detector)
az monitor metrics list --resource $RESOURCE_ID --metric "CpuPercentage" --interval PT5M

# Memory metrics (same data as App Service Plan Memory detector)
az monitor metrics list --resource $RESOURCE_ID --metric "MemoryPercentage" --interval PT5M

# Container log stream (useful for startup troubleshooting)
az webapp log tail --name $APP_NAME --resource-group $RG