Troubleshooting Mental Model
This page provides a classification model for App Service incidents so you can start with the correct evidence source instead of guessing.
Core idea: classify the problem first, then investigate deeply.
Why this model matters
Most incident delays come from category mistakes:
- startup failures investigated as pure application bugs
- outbound DNS/SNAT failures investigated as CPU problems
- deployment events ignored while symptoms are treated as random instability
This classification helps you avoid looking at the wrong logs from the start.
Classification flowchart
flowchart TD
    A[Observed symptom] --> B{Primary failure signal}
    B -->|5xx, latency, routing| C[Category 1: Request path issue]
    B -->|Container not ready, ping failures| D[Category 2: App startup issue]
    B -->|Degradation over time| E[Category 3: Runtime degradation]
    B -->|Dependency timeout, DNS, connection reset| F[Category 4: Dependency or outbound issue]
    B -->|Regression after change, restart, swap| G[Category 5: Deployment recycle platform event]

    C --> C1[Start with HTTP + platform path evidence]
    D --> D1[Start with console startup signals]
    E --> E1[Start with memory disk timeout progression]
    F --> F1[Start with outbound and resolver evidence]
    G --> G1[Start with Activity Log and config delta]
Portal view: Diagnose and solve problems landing page
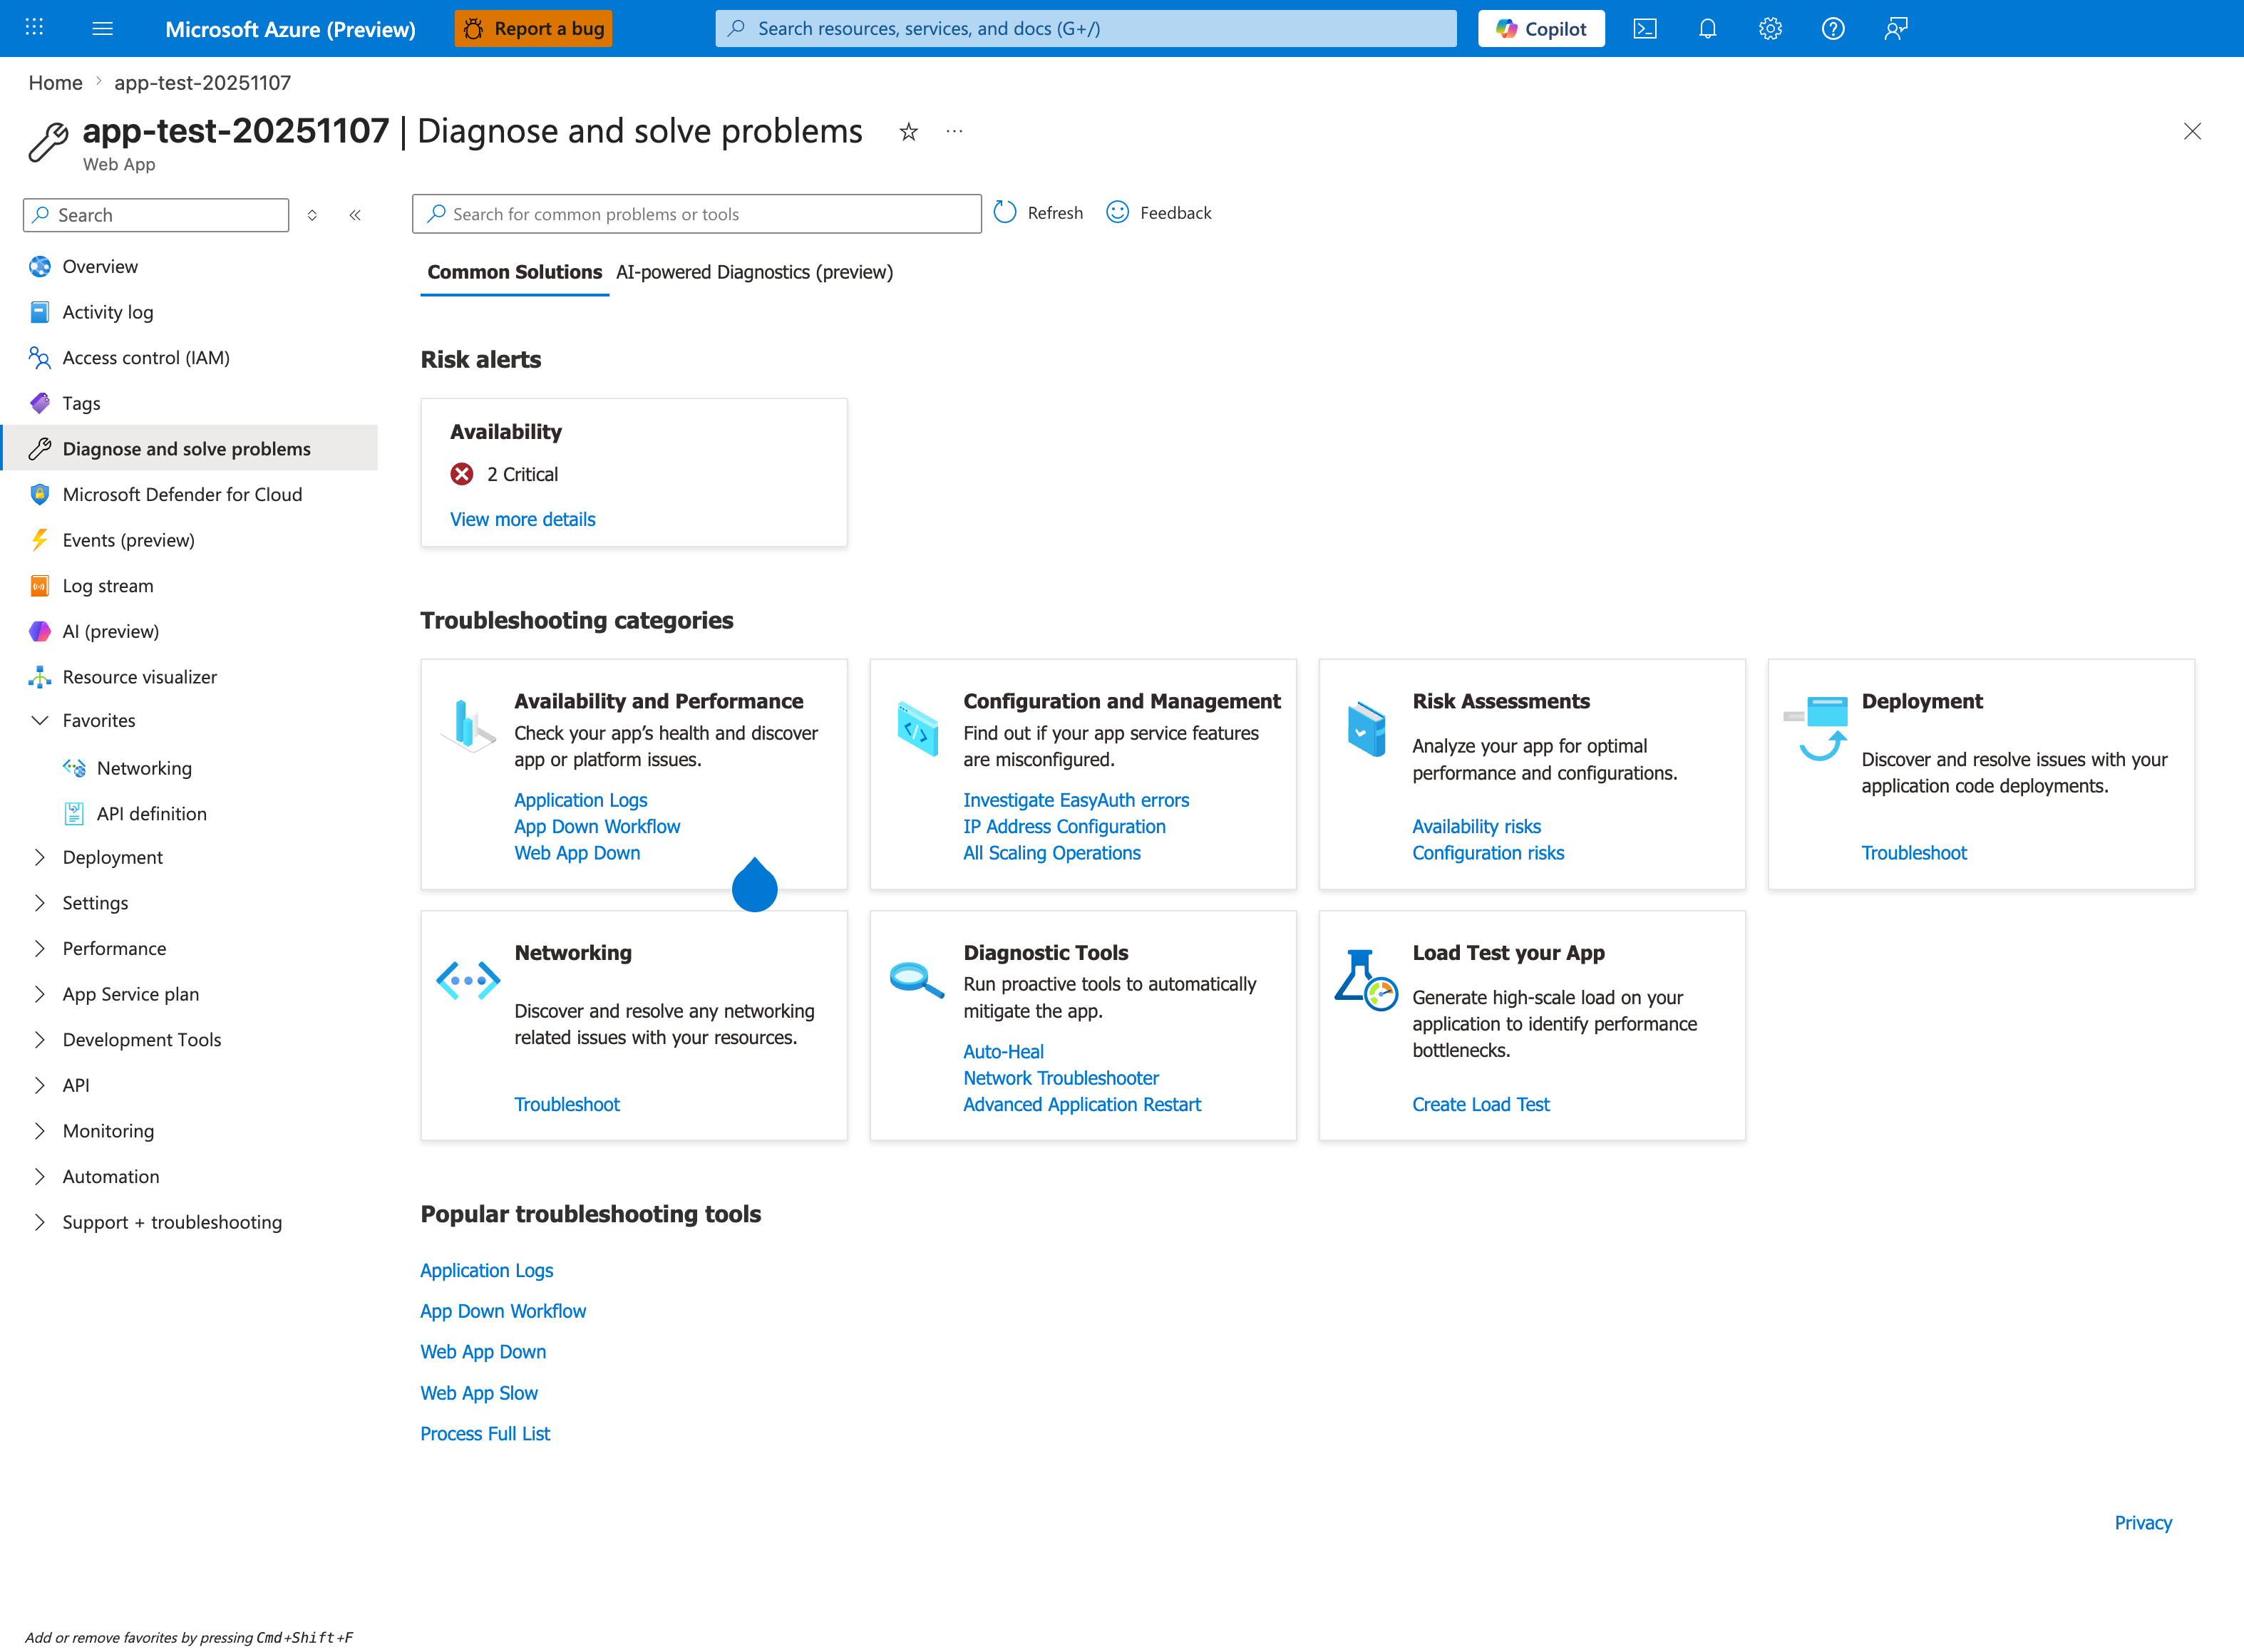
The Portal's own Diagnose and solve problems blade is the operational mirror of the five-category classification above. Availability and Performance aligns to Category 1 (Request path) and Category 3 (Runtime degradation). Configuration and Management plus Deployment align to Category 5 (Deployment/recycle/platform event). Networking is the direct counterpart to Category 4 (Dependency/outbound), and Diagnostic Tools (Auto-Heal, Network Troubleshooter) is the mitigation toolbox. The Risk alerts panel at the top (here showing 2 Critical availability issues) is the fastest pre-classification signal — when it is non-empty, click View more details before running any KQL. The AI-powered Diagnostics (preview) tab provides ML-based pattern matching that can short-circuit the manual classification when the symptom is familiar.
Category summary matrix
| Category | Typical Symptoms | First Signal to Check | Common Mistake |
|---|---|---|---|
| Request path issue | 5xx, latency spikes, forwarding errors | AppServiceHTTPLogs status/time trend | assuming every 5xx is app code |
| App startup issue | container did not respond, warm-up timeout | AppServiceConsoleLogs startup sequence | checking only live request traces |
| Runtime degradation | slow over time, recycle, queue timeout | memory/disk trend + console timeout signatures | looking only at CPU |
| Dependency/outbound issue | connect timeout, DNS failures, reset/refused | console/app dependency errors + DNS checks | restarting app without validating outbound cause |
| Deployment/recycle/platform event | incident starts after deploy/swap/config change | Activity Log + platform lifecycle events | treating change-related incidents as random noise |
1) Category: Request Path Issue
Request path issues are failures in the inbound flow from client to app response.
Typical symptom patterns
- 500/502/503 appearing at endpoint level
- latency increase before error-rate increase
- only specific routes or methods failing
- proxy/forwarding failures in incident timeline
Portal view: Application Insights Overview as the first signal
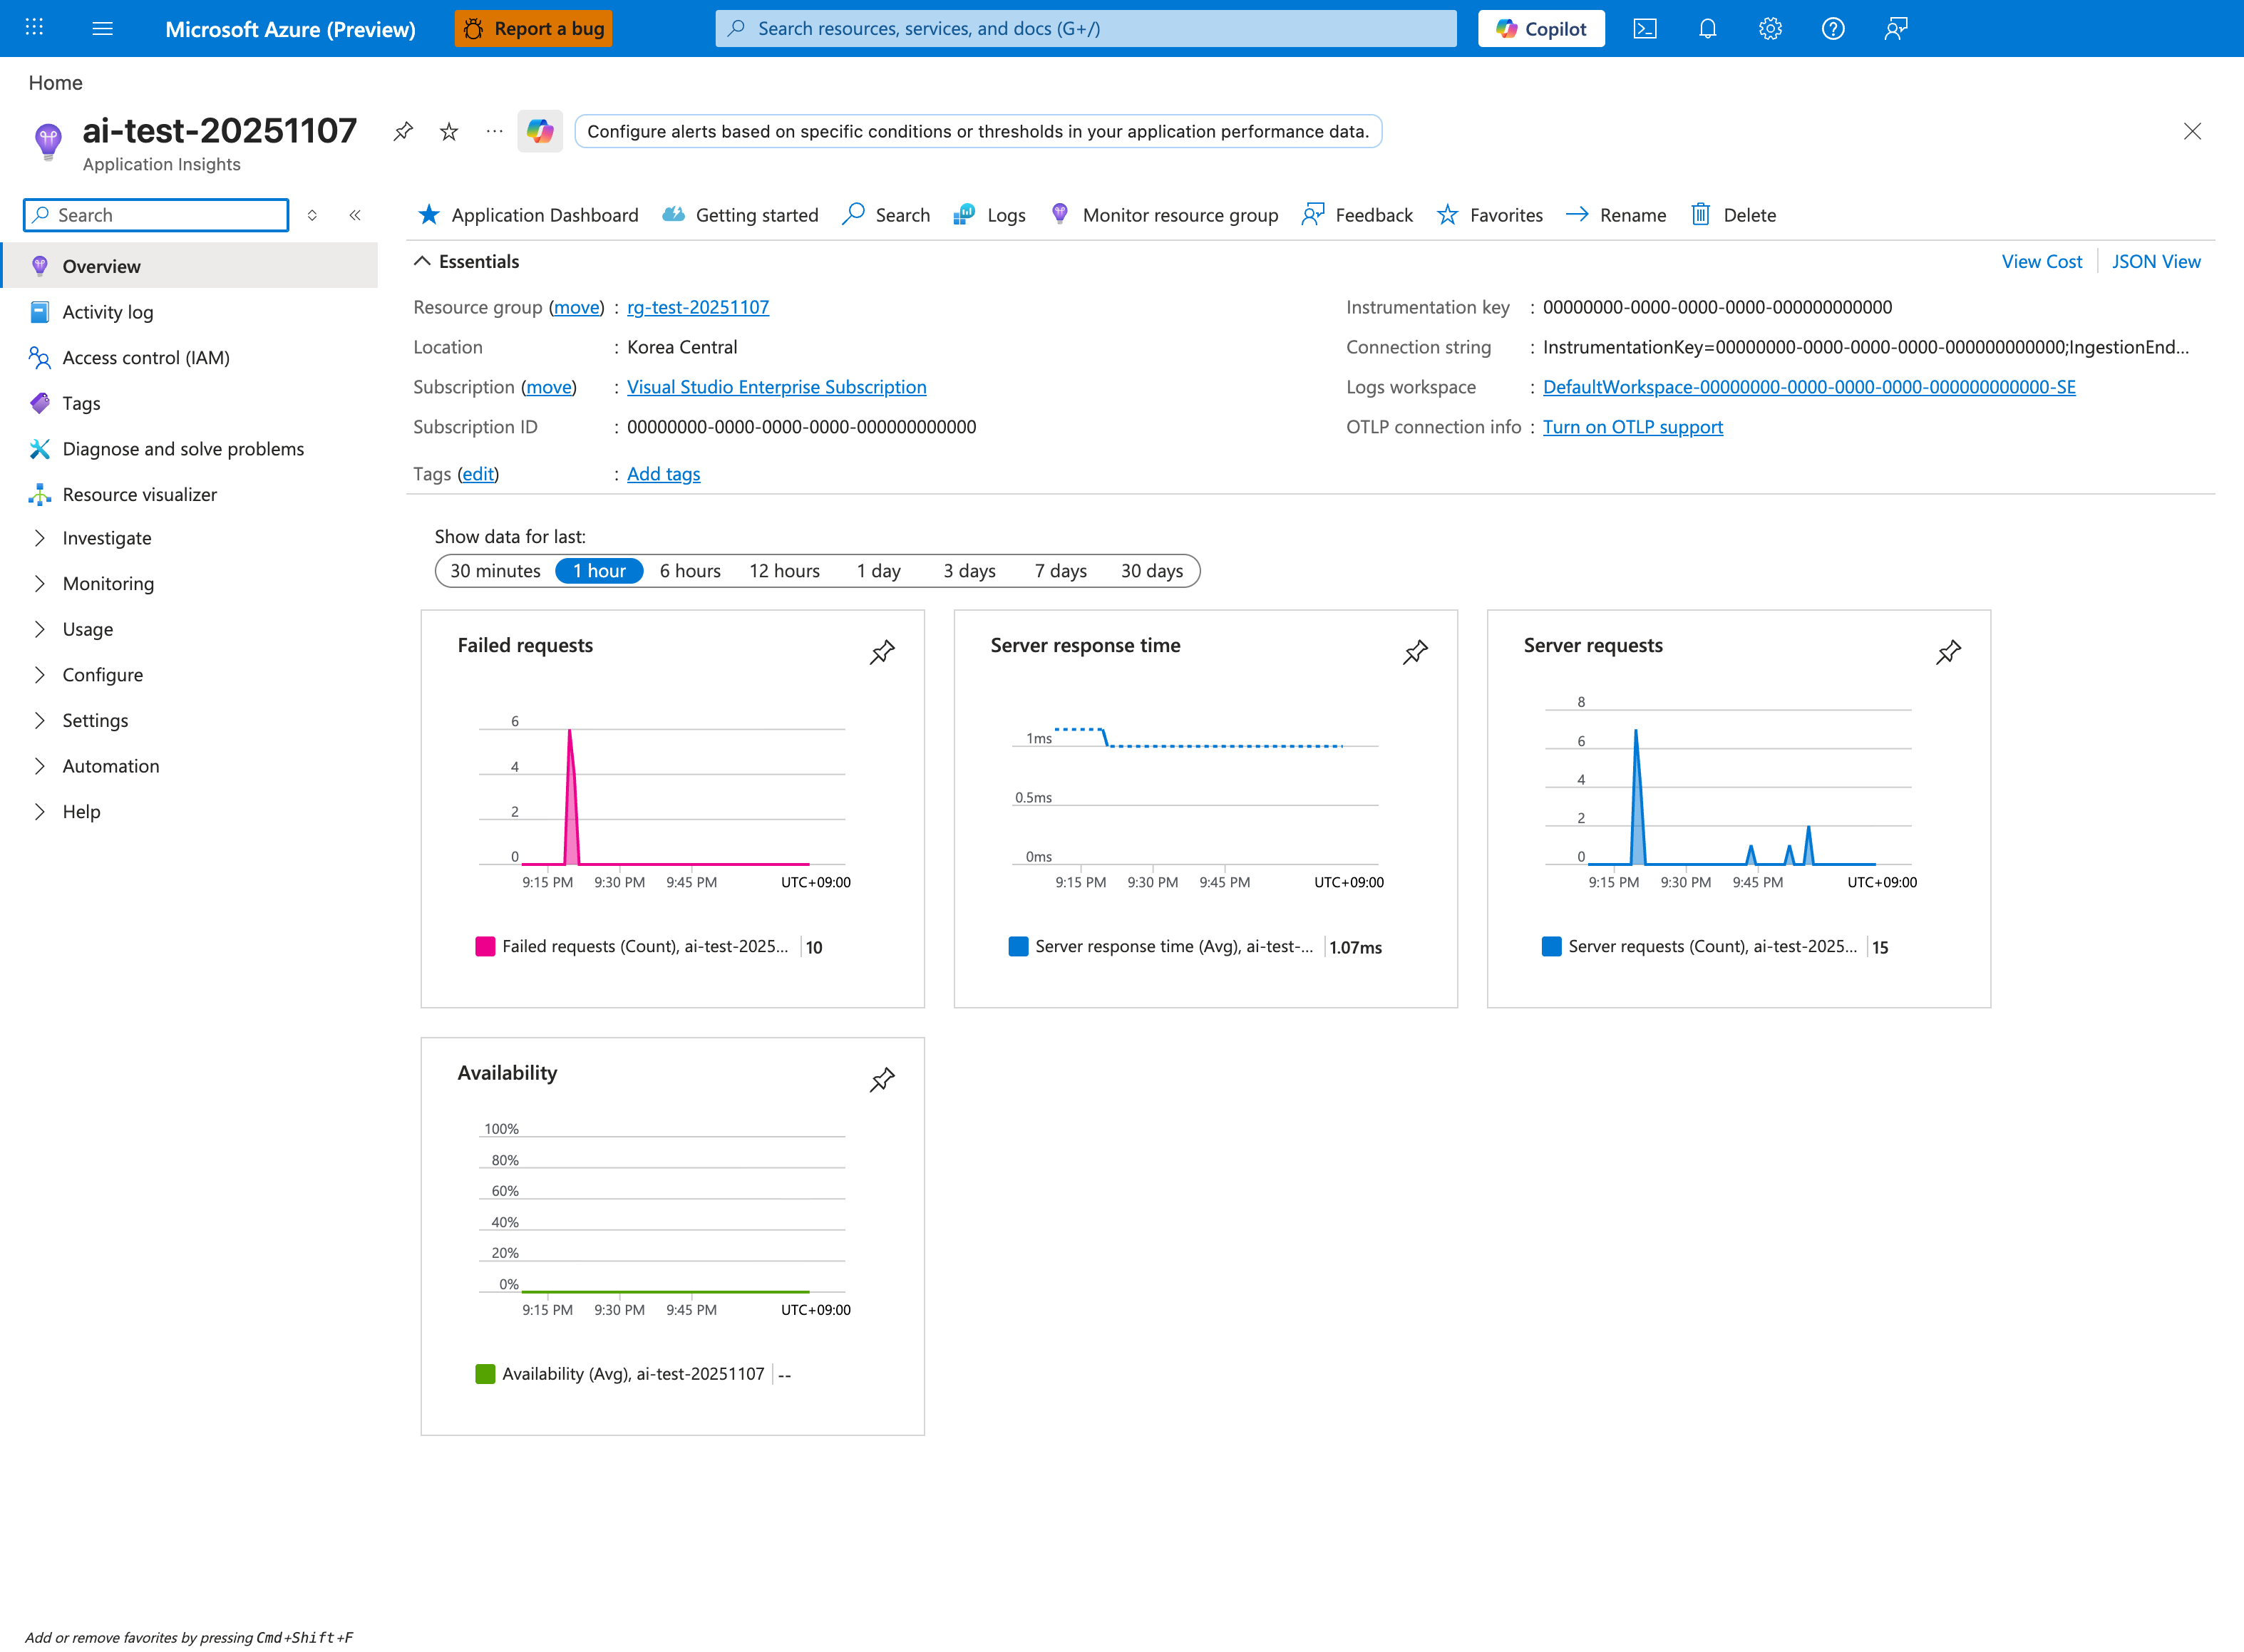
For Category 1 incidents, the Application Insights Failed requests and Server response time tiles are the first signal — together they reveal whether the request path is failing outright or simply slow. The 1 hour window is the right starting scope; widen to compare against the 24-hour baseline if needed. Click Failed requests to drill into the per-endpoint breakdown that maps to the CsUriStem grouping in the KQL query below. Server requests count is the denominator — a request spike with no failure-rate increase is normal load, while flat requests with rising failures indicates a routing or upstream issue.
First signal to check
AppServiceHTTPLogs
| where TimeGenerated > ago(2h)
| summarize total=count(), err5xx=countif(ScStatus >= 500 and ScStatus < 600), p95=percentile(TimeTaken,95) by bin(TimeGenerated, 5m), CsUriStem
| order by TimeGenerated asc
Common mistakes
- interpreting one status code in isolation without timing context
- ignoring route concentration (
CsUriStem) and focusing only on global totals - skipping platform logs that can explain 502/503 transitions
Recommended playbooks
2) Category: App Startup Issue
Startup issues occur when runtime readiness never stabilizes after deployment, recycle, or slot event.
Typical symptom patterns
- deployment marked successful but app unavailable
container didn't respond to HTTP pings- warm-up succeeds in one slot but fails after swap
- immediate 503 after restart or rollout
First signal to check
AppServiceConsoleLogs
| where TimeGenerated > ago(6h)
| where ResultDescription has_any ("startup", "didn't respond", "could not bind", "listen", "warm-up", "health")
| project TimeGenerated, ResultDescription, Host
| order by TimeGenerated desc
Common mistakes
- assuming deployment success equals startup success
- validating only app code and skipping startup command/port binding
- confusing warm-up path behavior with health check behavior
Recommended playbooks
- Container Didn't Respond to HTTP Pings
- Warm-up vs Health Check
- Deployment Succeeded but Startup Failed
- Slot Swap Failed During Warm-up
3) Category: Runtime Degradation
Runtime degradation means the app starts correctly but performance deteriorates due to memory, disk, or worker execution behavior.
Typical symptom patterns
- increasing latency over hours followed by restart/recycle
- intermittent timeout errors while CPU appears moderate
No space left on deviceand logging/write failures- request queueing and worker timeout under burst traffic
First signal to check
AppServiceConsoleLogs
| where TimeGenerated > ago(24h)
| where ResultDescription has_any ("No space left on device", "OOM", "killed", "timeout", "WORKER TIMEOUT")
| project TimeGenerated, ResultDescription
| order by TimeGenerated desc
Common mistakes
- relying on CPU as the only capacity metric
- missing trend-based failures because only point-in-time checks are used
- restarting repeatedly instead of identifying memory/disk growth pattern
Recommended playbooks
4) Category: Dependency / Outbound Issue
Outbound issues occur when the app runtime is healthy but calls to external systems fail due to DNS, SNAT, routing, or dependency-side latency.
Typical symptom patterns
- connection timeout, reset, or refused errors during dependency calls
- failures cluster on endpoints that call one external service
- DNS resolution failures in VNet-integrated environments
- intermittent behavior that worsens with outbound concurrency
First signal to check
AppServiceConsoleLogs
| where TimeGenerated > ago(6h)
| where ResultDescription has_any ("getaddrinfo", "Name or service not known", "Temporary failure in name resolution", "ConnectTimeout", "ReadTimeout", "connection reset", "connection refused")
| project TimeGenerated, ResultDescription
| order by TimeGenerated desc
Common mistakes
- treating all dependency failures as provider outages
- skipping DNS verification from inside app context
- assuming SNAT without correlating with traffic shape and outbound fan-out
Recommended playbooks
- SNAT or Application Issue?
- DNS Resolution (VNet-Integrated)
- Private Endpoint / Custom DNS Route Confusion
5) Category: Deployment / Recycle / Platform Event
This category covers incidents triggered by operational changes rather than steady-state code behavior.
Typical symptom patterns
- errors begin immediately after deployment or configuration update
- instability appears after slot swap
- restart/recycle events correlate with outage window
- app behavior differs between staging and production slot
Portal view: Activity log as the first signal
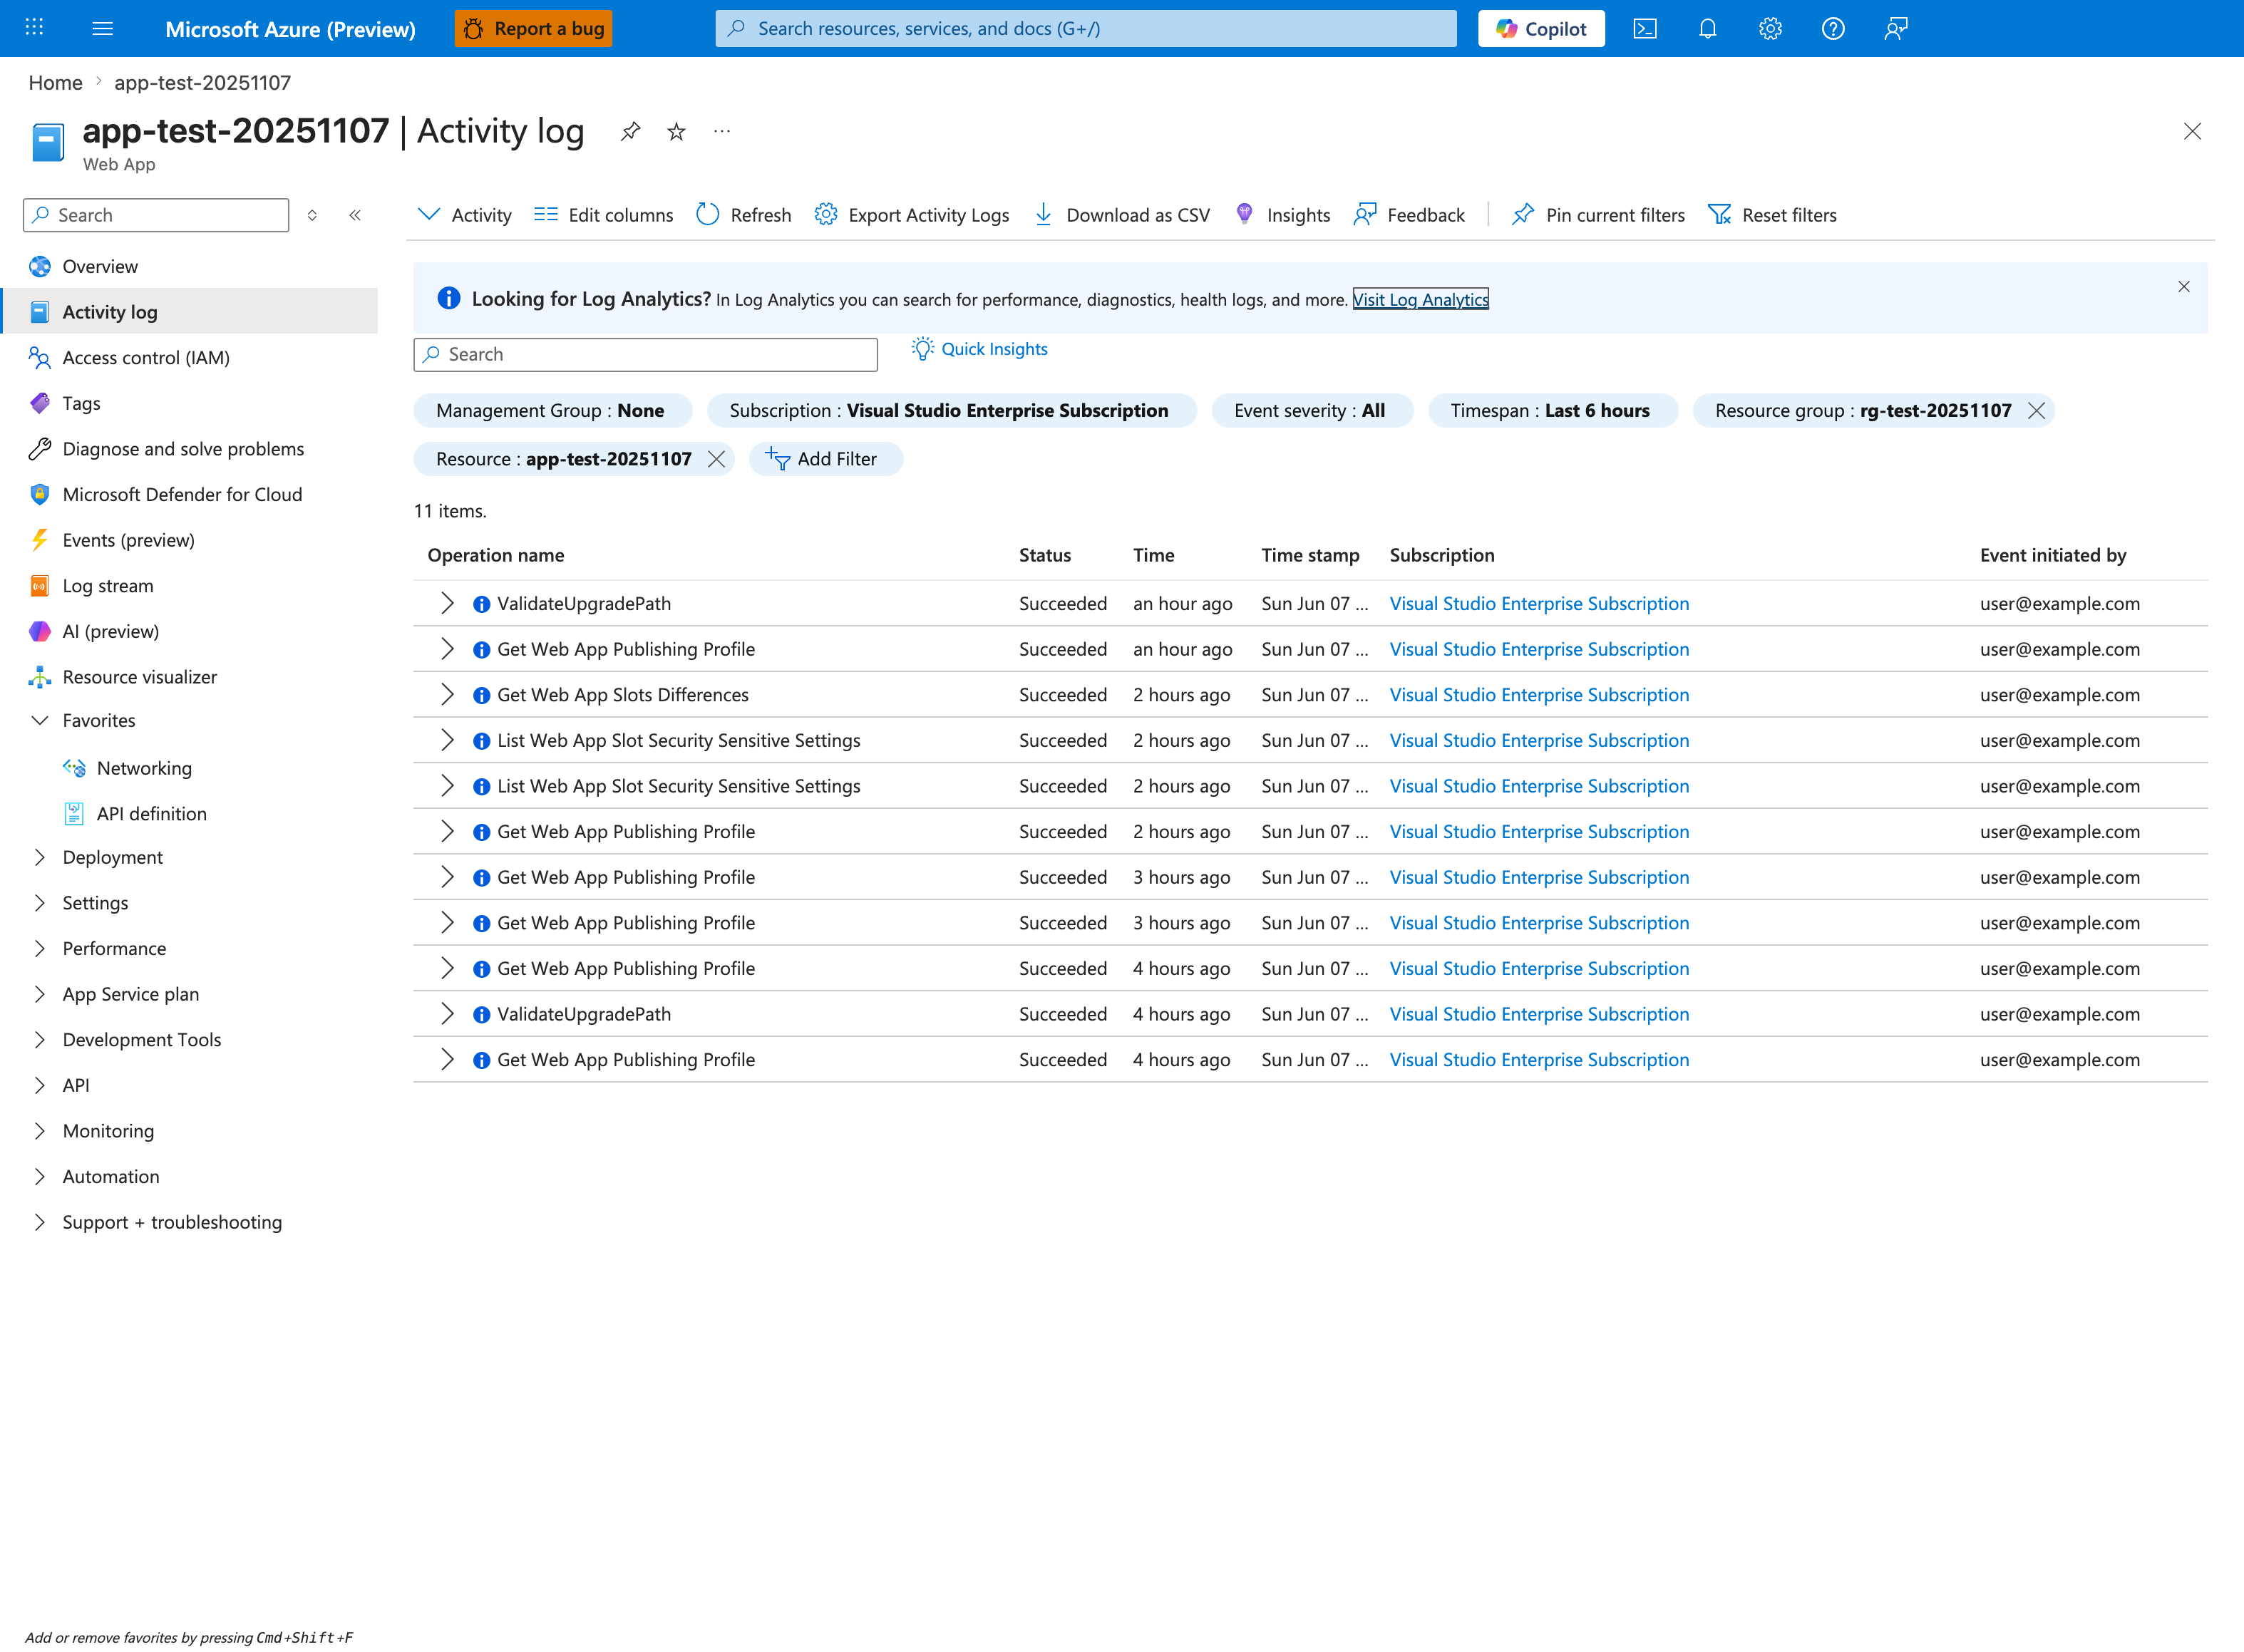
For Category 5 incidents, the Activity log is the authoritative timeline of every control-plane change against this Web App. The first question to answer is "what operation immediately preceded the incident window?" — sort by Time descending and look for Update Site, Update Configuration, Update App Settings, Microsoft.Web/sites/publish/Action, or any slot-swap operation in the hour before symptoms began. The Event initiated by column distinguishes a human deploy from a CI/CD service principal or platform-initiated change. The Timespan: Last 6 hours filter chip should match the incident window; widen to 24 hours if the suspected change is older. Pair this with the CLI/KQL commands below to extract the change details (Update App Settings operations log the new values in their JSON payload).
First signal to check
az monitor activity-log list --resource-group <resource-group> --offset 24h
az webapp config appsettings list --resource-group <resource-group> --name <app-name>
az webapp config show --resource-group <resource-group> --name <app-name>
AppServicePlatformLogs
| where TimeGenerated > ago(24h)
| where ResultDescription has_any ("restart", "recycle", "swap", "deploy", "configuration", "health")
| project TimeGenerated, OperationName, ResultDescription
| order by TimeGenerated desc
Common mistakes
- treating deployment/change correlation as coincidence
- failing to compare slot-specific settings and sticky configuration
- applying runtime mitigations without first validating config drift
Recommended playbooks
Classification workflow in practice
- Pick one dominant symptom and timestamp window.
- Map to one of the five categories using the flowchart.
- Run only the first evidence query for that category.
- If evidence contradicts the category, reclassify immediately.
- Open the linked playbook and continue with hypothesis-driven analysis.
Anti-patterns this model prevents
- Wrong-table bias: querying the same table for every incident type.
- Single-metric bias: letting CPU charts decide all hypotheses.
- No-change blind spot: ignoring deployment and config events.
- Premature root cause: selecting one familiar explanation before evidence correlation.
Use category labels in incident notes
Add an explicit category label in the first incident update. Example: "Initial classification: Category 4 (Dependency/Outbound), confidence medium." This keeps the team aligned on which evidence to collect first.
See Also
- Troubleshooting Method
- Detector Map
- Architecture Overview
- Evidence Map
- Decision Tree
- Playbooks Index
- KQL Query Library