Lab Guide (Level 3): SNAT Exhaustion on Azure App Service Linux
This lab is a full diagnostic reference for reproducing and proving outbound SNAT pressure on Azure App Service Linux using a Python/Flask workload. It expands the original scaffold into a complete investigation package with architecture background, falsifiable hypothesis, deterministic runbook, and artifact-backed experiment log.
Lab Metadata
| Attribute | Value |
|---|---|
| Difficulty | Advanced |
| Estimated Duration | 60-75 minutes |
| Tier | Basic |
| Failure Mode | Outbound connection churn without pooling drives SNAT pressure, timeouts, and worker instability |
| Skills Practiced | Outbound dependency troubleshooting, SNAT-pressure analysis, network diagnostics, HTTP and console log correlation |
What this guide is
This is a troubleshooting reference lab guide intended for engineers who need repeatable, evidence-driven diagnosis. It is not a quickstart.
PII policy
All IDs in this guide are already sanitized. Keep all examples sanitized if you copy this structure for new investigations.
1) Background
SNAT exhaustion on App Service is rarely a single-event failure. It is usually a cascade:
- App generates high outbound connection churn.
- Platform SNAT mapping inventory gets stressed.
- Pending outbound calls wait longer for usable translated ports.
- Upstream call latency grows.
- Worker threads block and queue expands.
- Gunicorn workers timeout and get killed/recycled.
- Inbound availability degrades (499/503/000 symptoms).
1.1 Outbound flow on App Service Linux
The following logical flow explains where SNAT sits in the path:
flowchart TD
    A[Client Request] --> B[App Service Front End]
    B --> C[Linux Worker / Gunicorn]
    C --> D[Flask /outbound endpoint]
    D --> E[New outbound TCP connection]
    E --> F[Azure Load Balancer SNAT]
    F --> G[Internet target e.g. httpbin.org]
    G --> F
    F --> C

    style F fill:#f57c00,color:#fff
    style D fill:#1976d2,color:#fff
    style C fill:#455a64,color:#fff
Key point: SNAT mapping happens on platform egress. Your code does not directly manage SNAT tables, but your connection behavior determines churn pressure.
1.2 Why per-request TCP creation is dangerous
In this lab app:
/outboundusesurllib.requestwithConnection: close.- Every outbound call tends to create a fresh TCP socket.
- Under concurrency, sockets accumulate in active and post-close states.
When requests finish, connections do not disappear immediately due to TCP lifecycle behavior (for example, TIME_WAIT). That lag means transient churn can still consume port inventory for a while.
1.3 SNAT port inventory and App Service guidance
Microsoft guidance for App Service outbound troubleshooting describes finite SNAT inventory and recommends connection reuse/pooling to avoid intermittent failures.
Operationally relevant concepts:
- Finite SNAT mappings per instance.
- Port reuse delay due to TCP lifecycle.
- Connection pooling reduces churn and improves stability.
- Symptom signatures: outbound timeout, connection refused, intermittent spikes.
1.4 Causal mechanics with TCP states
sequenceDiagram
    participant W as Worker Thread
    participant A as App Code (/outbound)
    participant L as LB SNAT
    participant T as External Target

    W->>A: Handle inbound request
    A->>L: Open outbound TCP
    L->>T: Forward with translated source port
    T-->>L: Response
    L-->>A: Return response
    A-->>W: Complete call
    Note over L: Port mapping not always instantly reusable
Under low traffic this is fine. Under burst concurrency with no pooling, the per-call setup/teardown overhead becomes dominant and error-prone.
1.5 Why this lab can also show worker SIGKILL
The lab does not claim SNAT directly kills a worker process. The chain is indirect:
- Outbound calls stall.
- Request handlers exceed worker timeout thresholds.
- Worker recycling/kill events increase.
- Platform and app become unstable.
This is a classic cascading failure pattern, where initial network pressure manifests as process churn.
1.6 Lab code paths relevant to diagnosis
| Endpoint | Purpose | Behavior |
|---|---|---|
/outbound | Reproduce anti-pattern | no pooling, Connection: close |
/outbound-fixed | Control path | requests.Session() + pooled adapter |
/diag/net | Network diagnostics | sockstat, TCP line count, local port range |
/diag/stats | Process counters | request counters + outbound counters |
/diag/env | Runtime context | safe env projection |
1.7 Why this is not only an outbound problem
Outbound instability can surface as inbound errors:
499in HTTP logs (client closed or downstream timeout path).503when process/service is degraded.000in synthetic probes (curltransport failure).
1.8 Diagram: healthy vs exhausted behavior
flowchart TD
    A[Inbound request] --> B{Outbound call mode}
    B -->|Pooled| C[Reuse existing sockets]
    C --> D[Low churn]
    D --> E[Stable latency]
    E --> F[Healthy workers]

    B -->|No pooling| G[Create many new sockets]
    G --> H[High SNAT churn]
    H --> I[Outbound delay/timeout]
    I --> J[Worker timeout]
    J --> K[SIGKILL/recycle events]
    K --> L[499/503 increase]

    style C fill:#2e7d32,color:#fff
    style G fill:#ef6c00,color:#fff
    style K fill:#c62828,color:#fff
1.9 Baseline environment evidence (from artifacts)
Source files:
baseline/diag-net.jsonbaseline/diag-stats.jsonbaseline/diag-env.jsonbaseline/app-config.jsonbaseline/health.json
Observed baseline values:
| Signal | Value |
|---|---|
| Health payload | {"lab":"snat-exhaustion","status":"healthy"} |
| Gunicorn startup command | gunicorn --bind=0.0.0.0 --timeout=120 --workers=4 app:app |
WEBSITES_PORT | 8000 |
/proc/sys/net/ipv4/ip_local_port_range | 32768-60999 |
Baseline connection_count | 10 |
| Baseline sockstat TCP in-use | 5 |
Baseline sockstat TCP tw | 4 |
2) Hypothesis
2.1 Statement (falsifiable)
Hypothesis:
When a Python/Flask app creates a new outbound TCP connection per request without connection pooling, SNAT ports exhaust within minutes under concurrent load, causing timeouts and SIGKILL'd workers.
2.2 Causal chain under test
flowchart TD
    A[No pooling in /outbound] --> B[High outbound socket churn]
    B --> C[SNAT mapping pressure]
    C --> D[Outbound timeout growth]
    D --> E[Gunicorn worker timeout]
    E --> F[Worker SIGKILL / recycle]
    F --> G[HTTP 499/503 and curl 000]

    style C fill:#ef6c00,color:#fff
    style E fill:#d84315,color:#fff
    style F fill:#b71c1c,color:#fff
2.3 Proof criteria
All of the following must be observed in the same trigger window:
- Transport failures appear under load
curlresults include000responses and long (~60s) waits.
- HTTP log degradation appears
- Large share of
499/503with elevatedTimeTaken.
- Large share of
- Application timeout signatures appear
- Body samples include timeout text (for example,
The read operation timed out).
- Body samples include timeout text (for example,
- Worker instability appears in console logs
WORKER TIMEOUTandSIGKILLevents recorded.
- Recovery indicator appears after pressure drops
- Diagnostic endpoints become reachable again and counters restart/new PID appears.
2.4 Disproof criteria
Any one of the following disconfirms this specific chain:
- High concurrency produces no transport failures and no elevated HTTP time.
- No worker timeout/SIGKILL events during failure period.
- Failures occur equally in pooled and non-pooled paths with equivalent concurrency.
- Artifact evidence shows stable outbound behavior and no timeout signatures.
2.5 Scope boundaries
This lab tests application-driven outbound churn behavior, not every possible outbound failure root cause.
Not in scope:
- Upstream service outage as primary fault.
- DNS-wide outage.
- VNet routing misconfiguration.
- TLS certificate trust misconfiguration.
2.6 Expected measurable variables
| Layer | Variable | Expected during failure |
|---|---|---|
| Trigger CSV | status code | many 000 |
| Trigger CSV | elapsed seconds | cluster near 60 |
| App response body | sampleErrors | timeout message present |
| HTTP logs | ScStatus | 499/503 rise |
| HTTP logs | TimeTaken | long-tail near timeout window |
| Console logs | Gunicorn events | WORKER TIMEOUT, SIGKILL |
| Diag endpoints | reachability | transient unreachability |
2.7 Competing explanations considered
| Alternative explanation | How assessed in this lab |
|---|---|
| App code crash unrelated to outbound | Console pattern shows repeated timeout->kill loop tied to pressure window |
| One-off platform restart | Repeated failure signals in multiple artifacts, not a single restart message |
| Pure client-side network issue | Server-side logs show timeout and worker churn signatures |
3) Runbook
This runbook is the repeatable execution path. Use long-form flags for Azure CLI commands.
3.1 Prerequisites
| Tool | Check command |
|---|---|
| Azure CLI | az version |
| Bash | bash --version |
| jq | jq --version |
| Authenticated session | az account show |
3.2 Variable setup
export RG="rg-lab-snat"
export LOCATION="koreacentral"
export TEMPLATE_FILE="labs/snat-exhaustion/main.bicep"
3.3 Deploy infrastructure
az group create --name "$RG" --location "$LOCATION"

az deployment group create \
  --resource-group "$RG" \
  --template-file "$TEMPLATE_FILE"
Capture app name:
export APP_NAME=$(az webapp list \
  --resource-group "$RG" \
  --query "[0].name" \
  --output tsv)

export APP_HOST=$(az webapp show \
  --resource-group "$RG" \
  --name "$APP_NAME" \
  --query "defaultHostName" \
  --output tsv)

export APP_URL="https://$APP_HOST"
3.4 Deploy lab app
az webapp deploy \
  --resource-group "$RG" \
  --name "$APP_NAME" \
  --src-path "labs/snat-exhaustion/app" \
  --type zip \
  --restart true
3.5 Baseline checks
curl --silent --show-error "$APP_URL/health"
curl --silent --show-error "$APP_URL/diag/env"
curl --silent --show-error "$APP_URL/diag/net"
curl --silent --show-error "$APP_URL/diag/stats"
Expected baseline shape:
- Health returns
status=healthy. WEBSITES_PORTand/orPORTindicate container listener context./diag/netreturns low TCP pressure.
3.6 Trigger failure mode
Trigger behavior from script:
- Sends 200
/outbound?calls=40requests. - Runs concurrent batches (capped job count).
- Summarizes transport (
000) and HTTP (5xx) failures.
3.7 Optional control check (pooled endpoint)
Run a smaller controlled load against pooled mode:
for request_number in $(seq 1 40); do
  curl \
    --silent \
    --show-error \
    --output /dev/null \
    --write-out "%{http_code}\n" \
    "$APP_URL/outbound-fixed?calls=40"
done
3.8 Collect platform diagnostics
Portal view: Diagnose and solve (network and SNAT detector hub)
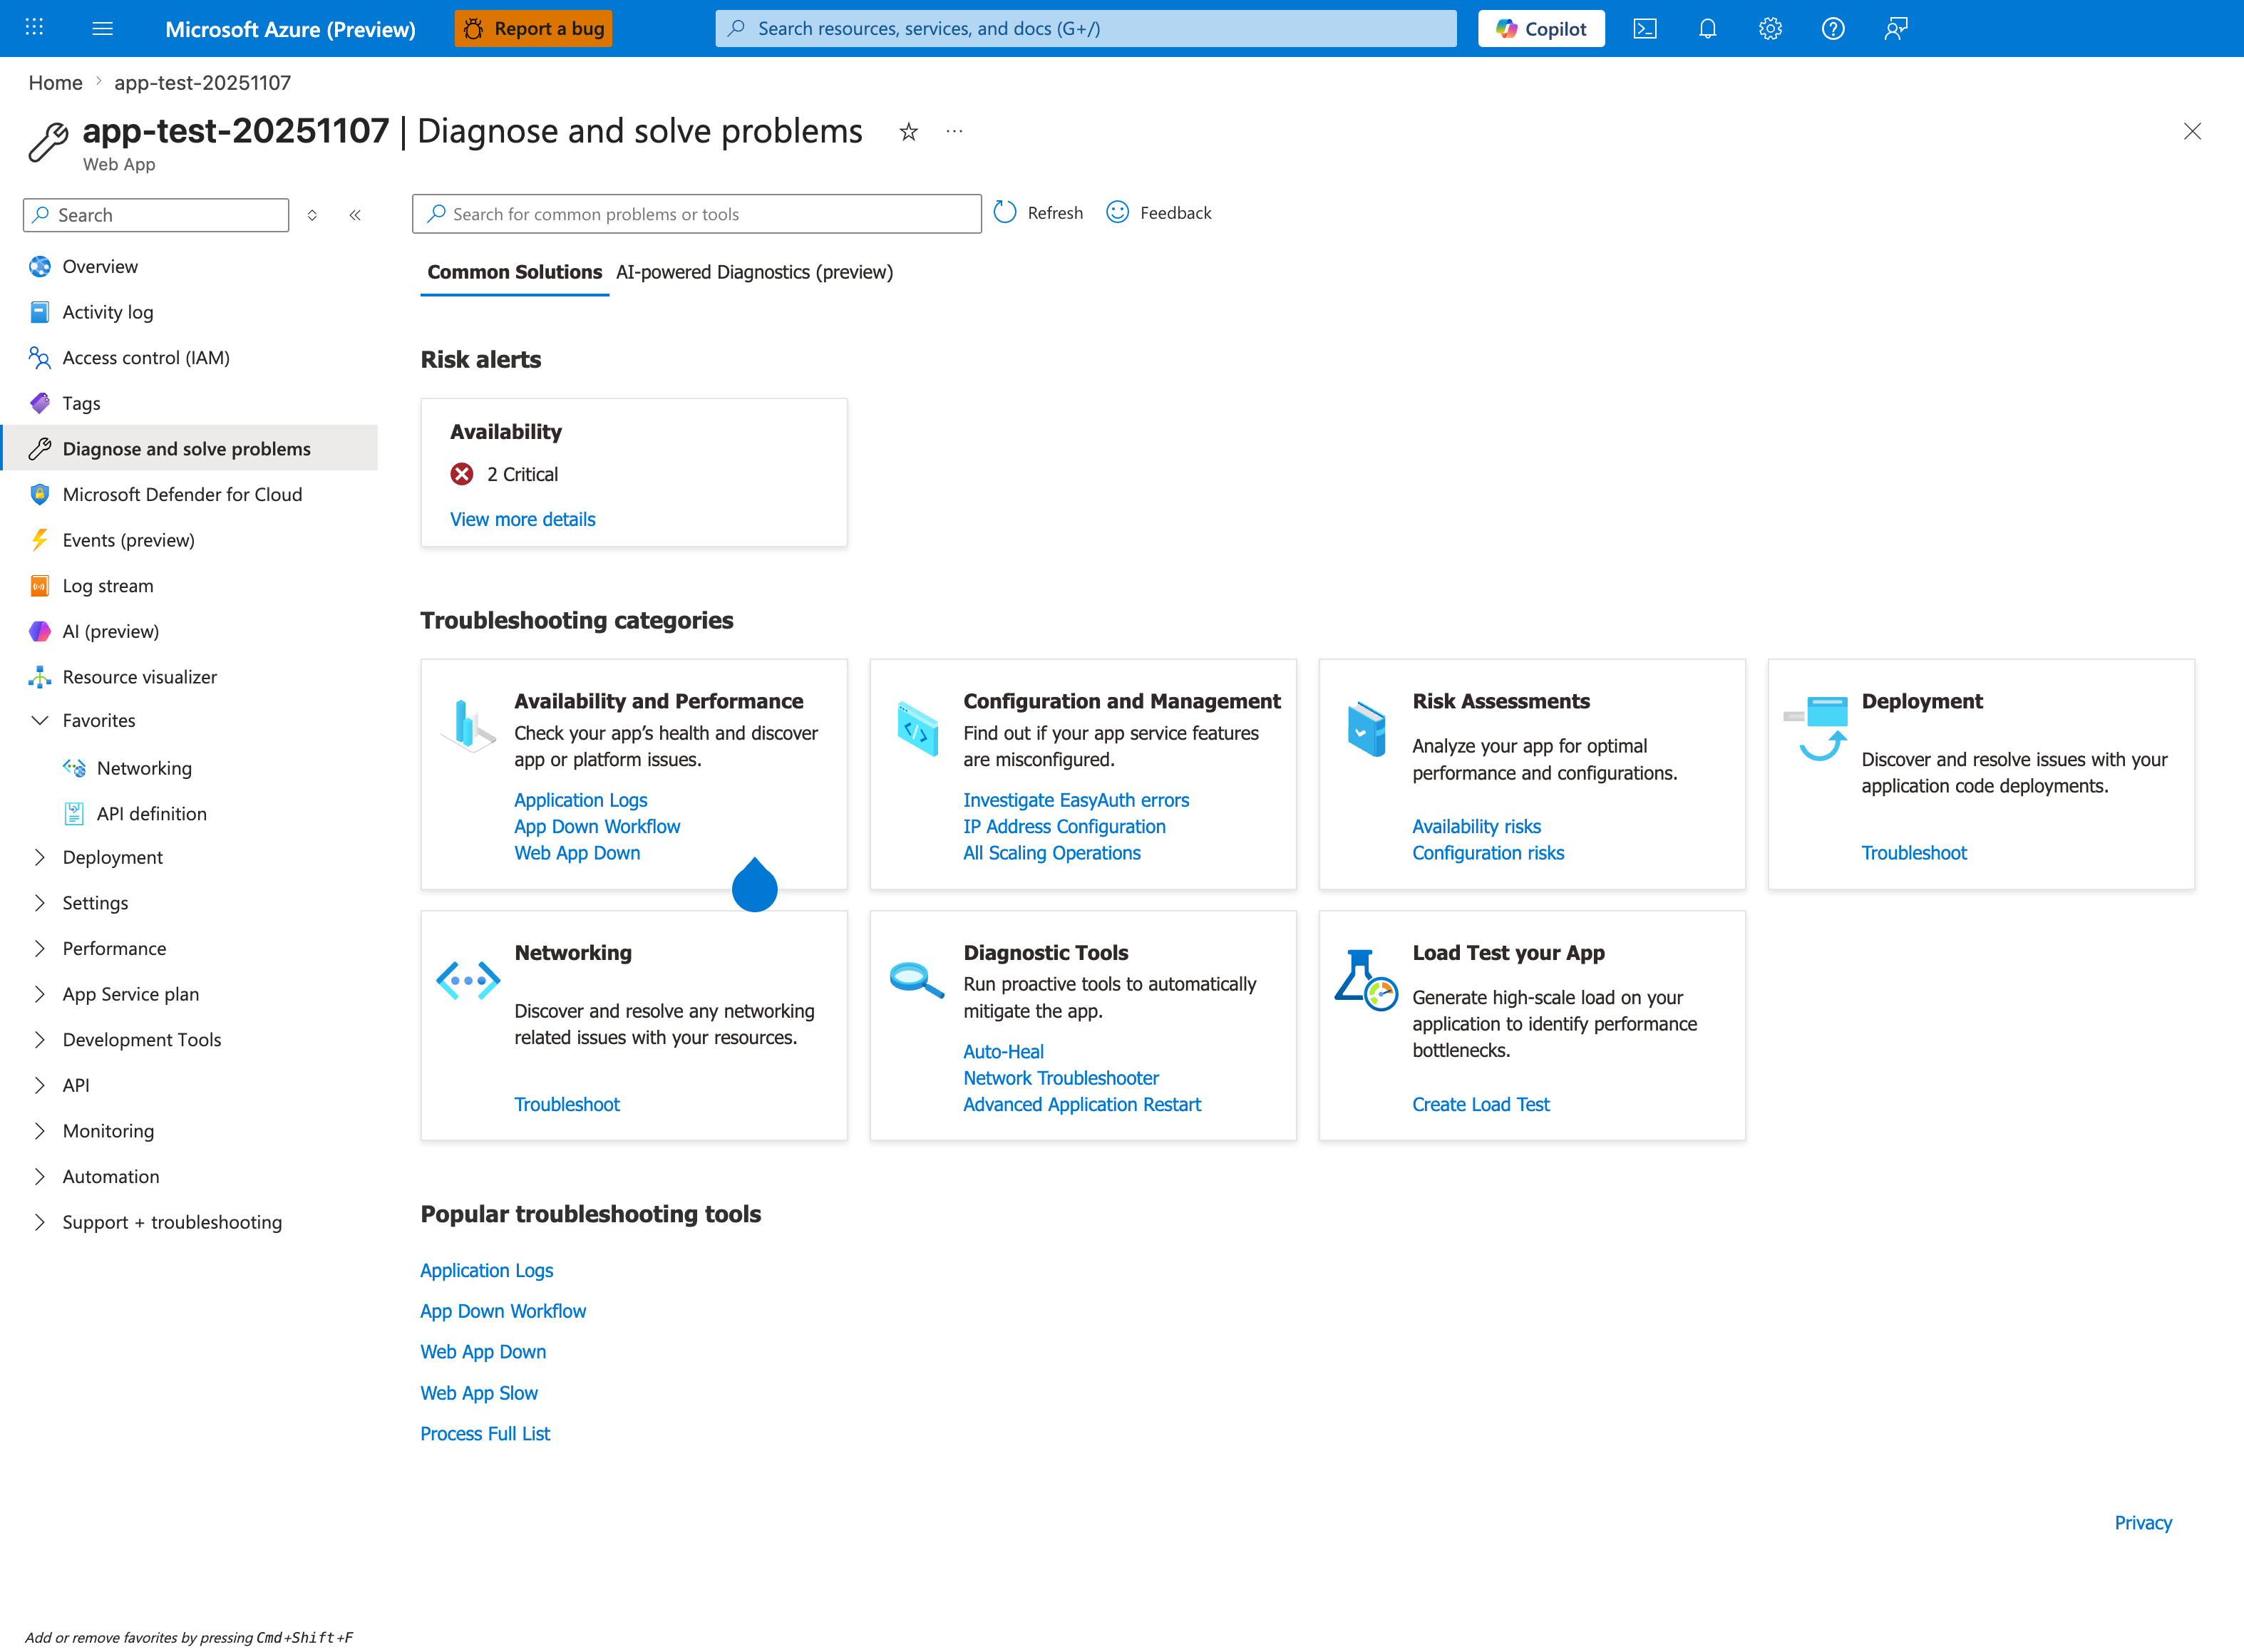
The Diagnose and solve problems hub is the Portal first-stop for SNAT investigations - the Networking troubleshoot card and the Network Troubleshooter link under Diagnostic Tools both pivot directly to detectors that surface SNAT port pressure and outbound IP saturation. The Availability and Performance card's Web App Slow detector also frequently lights up first under SNAT exhaustion because the worker queue fills with TCP-blocked requests. Click into Networking here to land on the same blade shown below, then verify the outbound IP list against the per-instance SNAT port budget referenced in section 1.3. After this top-down triage, the queries in section 3.9 quantify the 499/503 error rate the detector tiles only summarize.
Portal view: Networking blade (outbound IP context)
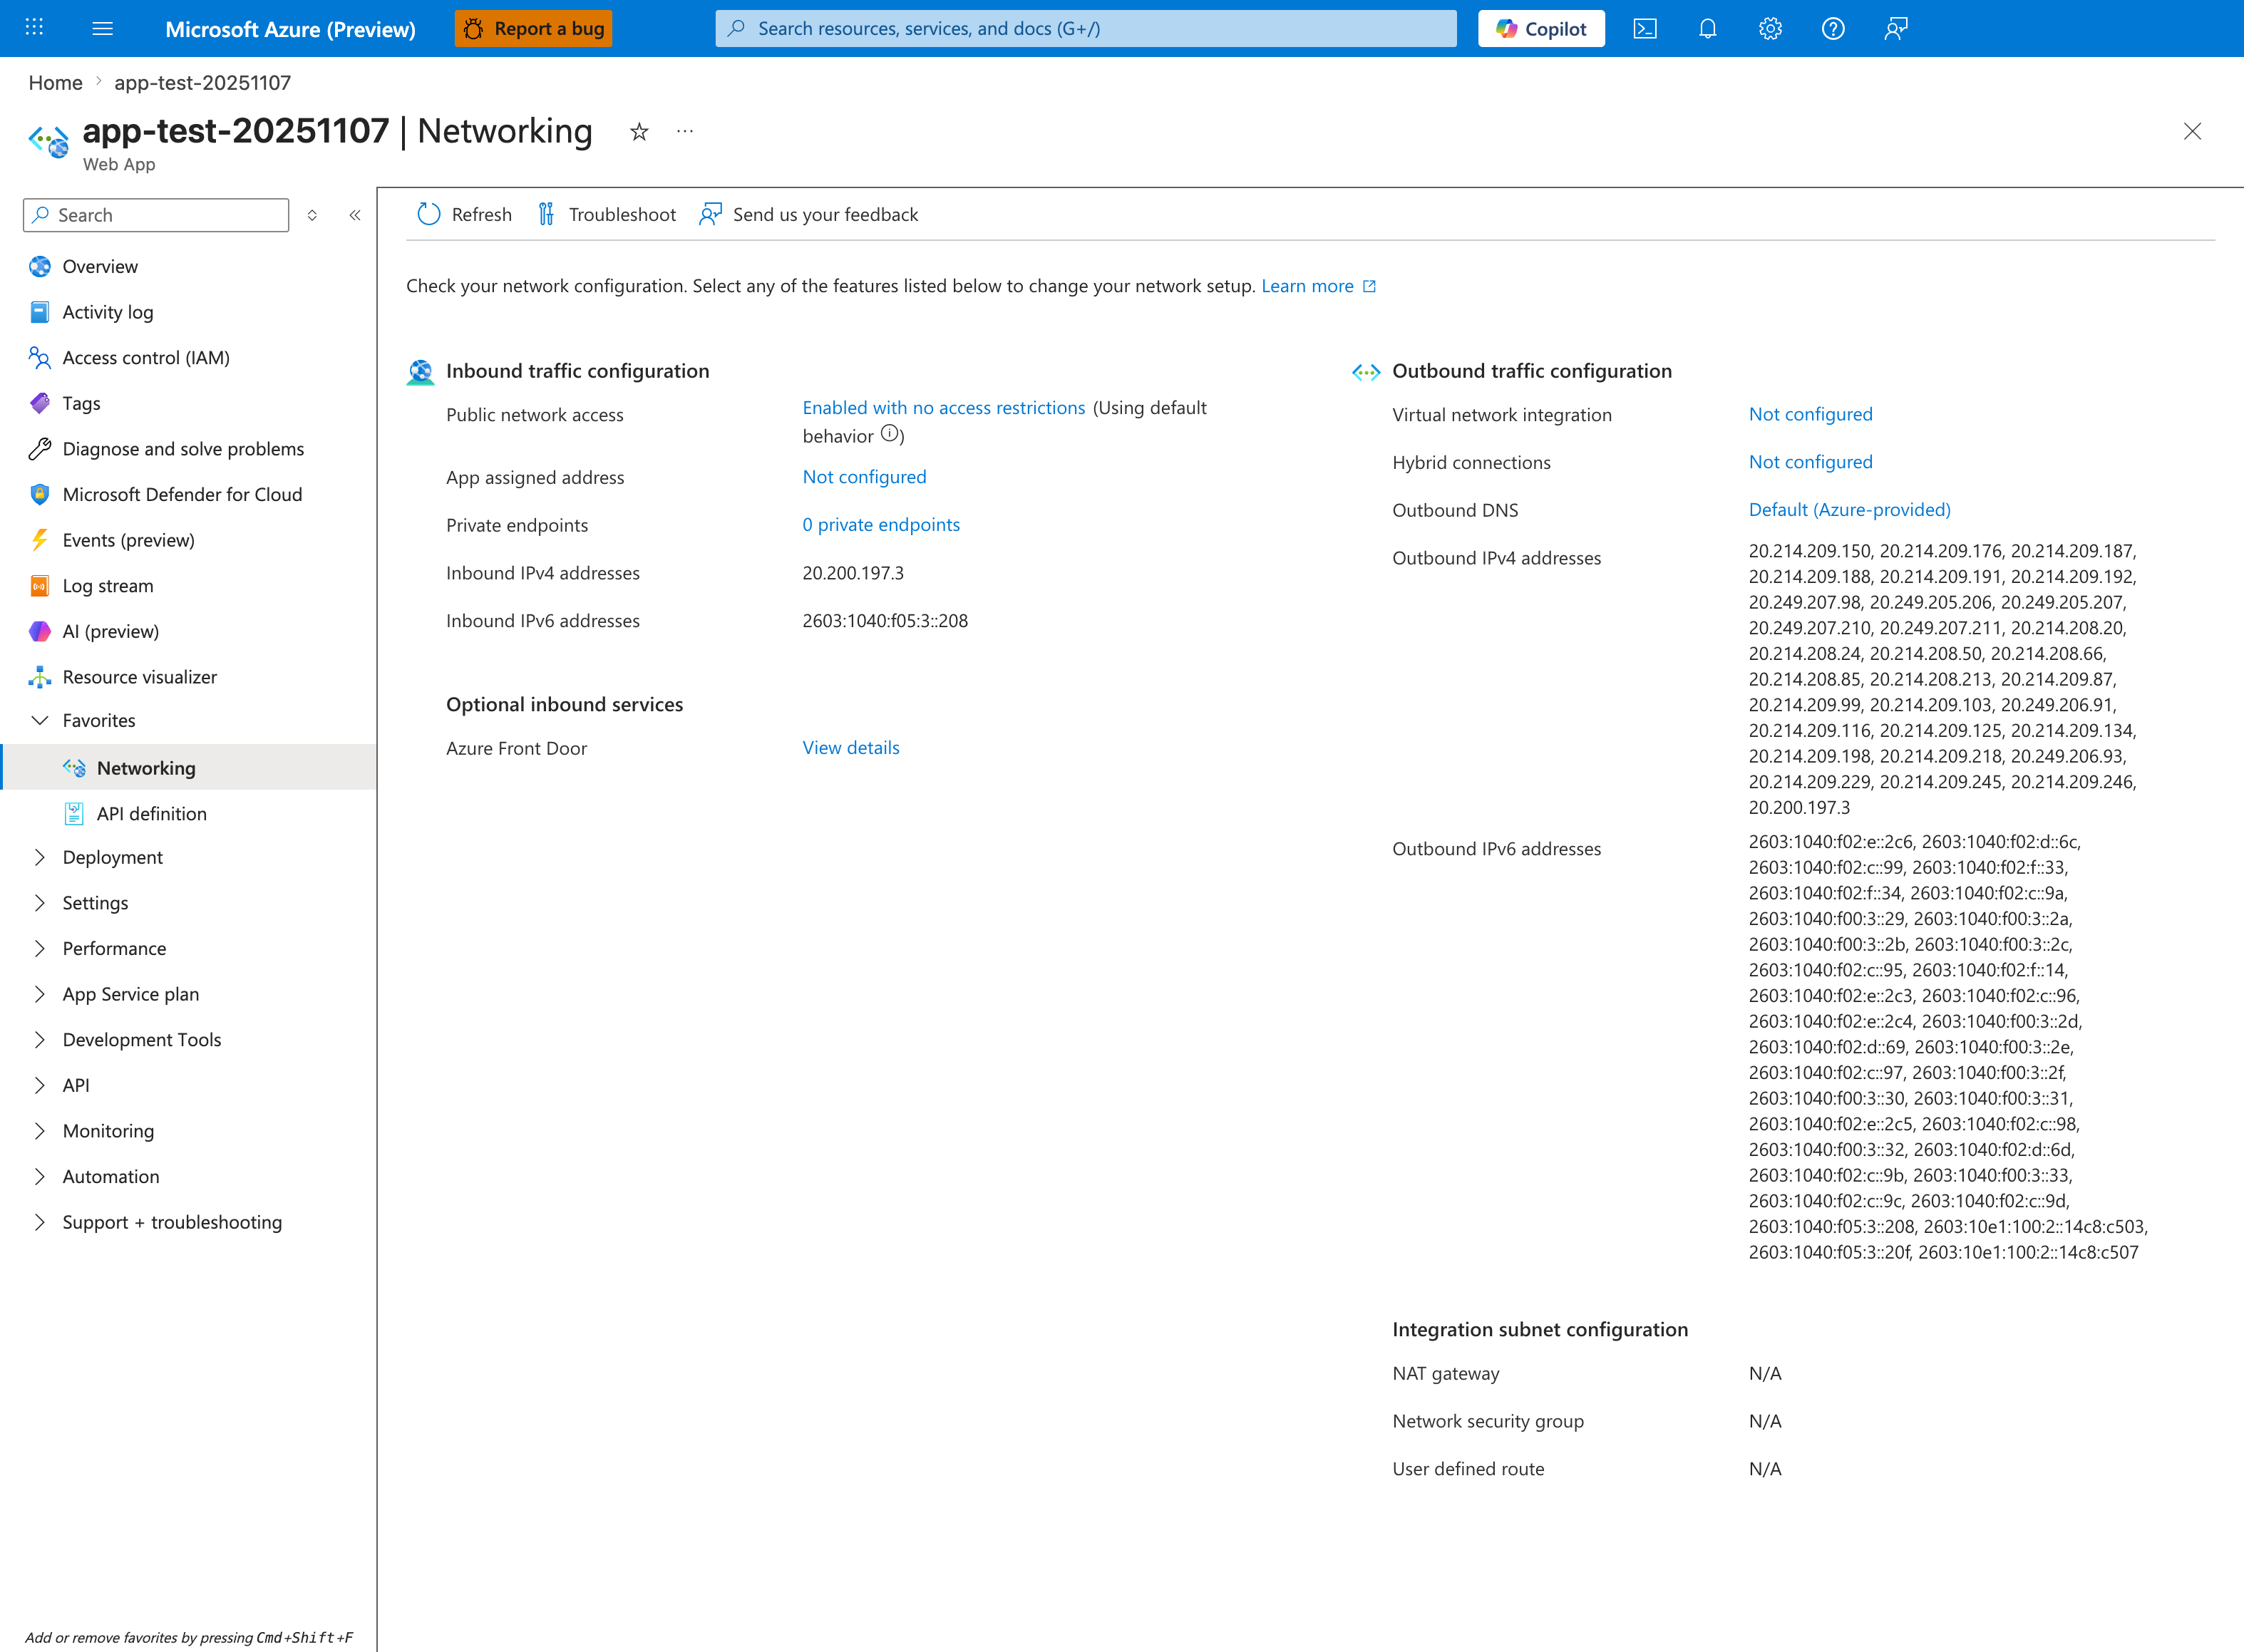
The Networking blade is the Portal counterpart to the SNAT KQL queries below. The Outbound traffic configuration column confirms Virtual network integration is Not configured and shows the ~30 shared platform-pool Outbound IPv4 addresses (20.214.209.150, 20.214.209.176, ...) that this app is multiplexing with other tenants - the exact root cause of SNAT port exhaustion under load. NAT gateway, Network security group, and User defined route all show N/A under Integration subnet configuration, which is the documented anti-pattern: a stateless outbound burst app has no dedicated SNAT pool and inherits the shared one. After confirming this state, run the queries below to quantify the resulting 499/503 errors.
HTTP signal query
AppServiceHTTPLogs
| where TimeGenerated > ago(2h)
| where CsHost has "azurewebsites"
| where CsUriStem in ("/outbound", "/outbound-fixed", "/diag/net", "/health")
| project TimeGenerated, CsUriStem, ScStatus, TimeTaken, CsHost
| order by TimeGenerated desc
Console signal query
AppServiceConsoleLogs
| where TimeGenerated > ago(2h)
| where ResultDescription has_any (
    "WORKER TIMEOUT",
    "SIGKILL",
    "timed out",
    "connection refused",
    "Cannot assign requested address",
    "EADDRNOTAVAIL"
)
| project TimeGenerated, ResultDescription
| order by TimeGenerated desc
Platform signal query
AppServicePlatformLogs
| where TimeGenerated > ago(2h)
| where Message has_any (
    "warmup",
    "Container",
    "startup",
    "timeout"
)
| project TimeGenerated, Level, Message
| order by TimeGenerated desc
3.9 Azure CLI-based KQL execution (optional automation)
export WORKSPACE_ID="<log-analytics-workspace-id>"

az monitor log-analytics query \
  --workspace "$WORKSPACE_ID" \
  --analytics-query "AppServiceHTTPLogs | where TimeGenerated > ago(2h) | where CsUriStem in ('/outbound','/outbound-fixed','/diag/net') | project TimeGenerated, CsUriStem, ScStatus, TimeTaken | order by TimeGenerated desc" \
  --output json
3.10 Validate recovery state
curl --silent --show-error "$APP_URL/diag/net"
curl --silent --show-error "$APP_URL/diag/stats"
curl --silent --show-error "$APP_URL/health"
If reachable and stable after pressure window, recovery evidence is present.
4) Experiment Log
This section is derived from actual sanitized lab artifacts:
labs/snat-exhaustion/artifacts-sanitized/
4.1 Artifact inventory used
| Category | File |
|---|---|
| Baseline | baseline/diag-stats.json |
| Baseline | baseline/diag-net.json |
| Baseline | baseline/diag-env.json |
| Baseline | baseline/app-config.json |
| Baseline | baseline/health.json |
| Trigger | trigger/outbound-targeted-20260404T055433Z.csv |
| Trigger | trigger/error-body-*_body-20260404T055433Z.txt |
| Trigger | trigger/diag-net-before-20260404T053447Z.json |
| Trigger | trigger/diag-net-posttrigger-20260404T054508Z.json |
| Trigger | trigger/diag-net-recovered-20260404T055433Z.json |
| Trigger | trigger/kql-http-20260404T060610Z.json |
| Trigger | trigger/kql-console-20260404T060610Z.json |
| Trigger | trigger/kql-platform-20260404T060610Z.json |
4.2 Baseline snapshot
4.2.1 /diag/stats baseline
Raw signal:
{"endpoint_counters":{"diag_stats":1},"outbound_call_counters":{"with-pooling":{"failures":0,"successes":0},"without-pooling":{"failures":0,"successes":0}},"pid":1907,"process_start_time":"2026-04-04T05:05:40.566103+00:00","request_count":1,"uptime_seconds":1642.522}
Interpretation:
- Process was long-lived before trigger.
- No outbound failures accumulated yet.
4.2.2 /diag/net baseline
Raw signal:
{"connection_count":10,"ip_local_port_range":{"end":"60999","start":"32768"},"sockstat":{"sockets":{"used":"10"},"tcp":{"alloc":"196","inuse":"5","mem":"18","orphan":"1","tw":"4"},"udp":{"inuse":"1","mem":"0"}}}
Interpretation:
- Low active pressure.
- Existing
tw=4confirms normal TCP post-close behavior.
4.3 Trigger output summary (targeted CSV)
Source: trigger/outbound-targeted-20260404T055433Z.csv
Derived summary:
| Metric | Value |
|---|---|
| Total requests | 30 |
Transport failures (000) | 22 |
| HTTP 200 | 8 |
| Requests at ~60s | 22 |
| Fastest successful request | 31.967409s |
| Slowest successful request | 57.227848s |
| Avg successful request time | 44.16s |
Selected rows:
| Row | Status | Elapsed (s) |
|---|---|---|
| 1 | 000 | 60.0002131 |
| 2 | 200 | 36.500380 |
| 3 | 200 | 53.071651 |
| 5 | 000 | 60.0000175 |
| 9 | 000 | 59.9991789 |
| 14 | 200 | 32.898595 |
| 20 | 000 | 60.0002442 |
| 30 | 000 | 60.0002993 |
4.4 Error-body sample evidence
Sources:
error-body-2_body-20260404T055433Z.txterror-body-3_body-20260404T055433Z.txterror-body-10_body-20260404T055433Z.txterror-body-11_body-20260404T055433Z.txterror-body-14_body-20260404T055433Z.txt
Aggregated findings:
| Metric | Value |
|---|---|
| Sample files analyzed | 5 |
| Files containing failures | 1 |
| Aggregate failures | 1 |
| Timeout text observed | The read operation timed out |
Representative payload with failure:
{"calls":20,"elapsedMs":35774,"failures":1,"mode":"without-pooling","sampleErrors":["The read operation timed out"],"successes":19,"target":"https://httpbin.org/get"}
4.5 Diag endpoint reachability during pressure
| Checkpoint | Artifact | Observed |
|---|---|---|
| Pre-trigger | diag-net-before-20260404T053447Z.json | normal JSON (connection_count=6, tw=0) |
| During/after pressure | diag-net-posttrigger-20260404T054508Z.json | 504.0 GatewayTimeout |
| Recovered | diag-net-recovered-20260404T055433Z.json | normal JSON (connection_count=7, tw=1) |
This confirms transient unreachability during the failure window.
4.6 HTTP KQL analysis
Source: kql-http-20260404T060610Z.json
Dataset size:
- Total rows: 195
Status distribution:
| Status | Count |
|---|---|
| 200 | 47 |
| 202 | 2 |
| 499 | 129 |
| 503 | 17 |
Endpoint-focused findings:
| Metric | Value |
|---|---|
/outbound total rows | 138 |
/outbound with 499 | 122 |
/outbound with 200 | 16 |
Rows with TimeTaken >= 59000ms | 123 |
/outbound rows with 499 and TimeTaken >= 59000ms | 118 |
Interpretation:
- HTTP telemetry matches timeout-dominated failure shape.
- The near-60s cluster strongly aligns with outbound wait/timeout behavior.
4.7 Console KQL analysis
Source: kql-console-20260404T060610Z.json
Dataset size and window:
| Metric | Value |
|---|---|
| Total rows | 500 |
| First row timestamp (oldest) | 2026-04-04T05:40:02.5061808Z |
| Last row timestamp (newest) | 2026-04-04T05:59:43.0881145Z |
Pattern counts:
| Signature | Count |
|---|---|
WORKER TIMEOUT | 18 |
SIGKILL | 14 |
Representative lines:
[2026-04-04 05:59:42 +0000] [1904] [CRITICAL] WORKER TIMEOUT (pid:1908)
[2026-04-04 05:59:43 +0000] [1904] [ERROR] Worker (pid:1908) was sent SIGKILL! Perhaps out of memory?
[2026-04-04 05:58:45 +0000] [1904] [CRITICAL] WORKER TIMEOUT (pid:1905)
[2026-04-04 05:58:46 +0000] [1904] [ERROR] Worker (pid:1905) was sent SIGKILL! Perhaps out of memory?
Interpretation:
- Strong process churn coincides with high outbound timeout phase.
- This supports cascading instability, not isolated request errors.
4.8 Platform KQL analysis
Source: kql-platform-20260404T060610Z.json
Rows sampled: 200
Dominant content:
- Container lifecycle messages.
- Startup/warmup informational traces.
- No contradictory signal that would independently explain the timeout burst.
4.9 PID rollover evidence
Compare baseline vs recovered diagnostics:
| Snapshot | PID | Process start time |
|---|---|---|
Baseline diag-stats.json | 1907 | 2026-04-04T05:05:40.566103+00:00 |
Recovered diag-stats-recovered...json | 1908 | 2026-04-04T05:52:07.242253+00:00 |
This indicates process turnover occurred during the trigger window.
4.10 Failure cascade timeline (reconstructed)
timeline
    title SNAT Lab Failure Cascade (artifact reconstruction)
    05:40:02 : Console window starts
    05:52:07 : New worker generation visible
    05:54-05:56 : Trigger pressure period
    05:56:00-05:57:26 : HTTP 499 near 59-60s dominates
    05:58-05:59 : Repeated WORKER TIMEOUT and SIGKILL events
    05:55+ : /diag endpoints eventually recover
4.11 Hypothesis verdict
| Criterion | Result | Evidence |
|---|---|---|
| Transport failures under load | ✅ Met | 22/30 probe rows = 000 |
| HTTP degradation with long times | ✅ Met | 129×499, 17×503, long TimeTaken cluster |
| Timeout body evidence | ✅ Met | The read operation timed out in sample |
| Worker churn evidence | ✅ Met | 18 WORKER TIMEOUT, 14 SIGKILL |
| Recovery after pressure | ✅ Met | diag-net recovers from 504 to JSON |
Final verdict: Hypothesis supported by artifacts.
4.12 Practical mitigation mapping
| Symptom | Mitigation |
|---|---|
| High churn outbound | Reuse sessions/connection pools |
| Timeout bursts | Reduce per-request outbound fan-out |
| Worker timeout/SIGKILL loops | Increase resiliency + reduce blocked call time |
| Recurrence under load | Scale out and validate outbound dependency behavior |
4.13 Recommended follow-up experiment
To make this lab even stronger, add a matched run against /outbound-fixed with the same trigger shape and log both runs side-by-side.
Suggested comparison table:
| Metric | No pooling | With pooling |
|---|---|---|
curl 000 ratio | expected high | expected low |
| 499 count | expected high | expected low |
| Worker timeout events | expected present | expected rare/none |
Expected Evidence
This section defines what you SHOULD observe at each phase of the lab. Use it to validate your investigation is on track.
Before Trigger (Baseline)
| Evidence Source | Expected State | What to Capture |
|---|---|---|
| AppServiceHTTPLogs | All 200s with low latency | Baseline query snapshot for /health, /diag/stats, /diag/net |
| AppServiceConsoleLogs | Normal Gunicorn startup behavior | Boot lines showing 4 sync workers |
| AppServicePlatformLogs | Standard startup lifecycle | Site start sequence without churn |
/diag/stats + /diag/net | Low outbound churn and stable socket counts | Baseline connection_count, sockstat, and endpoint counters |
During Incident
| Evidence Source | Expected State | Key Indicator |
|---|---|---|
AppServiceHTTPLogs (/outbound) | 499 dominates during burst | TimeTaken ~29786-29840 ms on timed-out outbound calls |
AppServiceHTTPLogs (/diag/stats) | Diagnostic endpoint can also time out | 499 with TimeTaken 59709 ms indicates full stall |
| Trigger CSV + app payloads | Mixed 000/499/503 and timeout text | Connection churn exceeds available SNAT mappings |
| Console logs | Worker timeout and kill churn | WORKER TIMEOUT and SIGKILL align with outbound pressure window |
After Recovery
| Evidence Source | Expected State | Key Indicator |
|---|---|---|
| AppServiceHTTPLogs | Timeout ratio drops when pressure is reduced | Fewer long-tail 499 events after concurrency reduction |
/diag/net + /diag/stats | Endpoints become reachable again | Diagnostic JSON resumes after stall period |
| Mitigation test | Connection pooling/reduced fan-out improves stability | Recovery requires reducing concurrent outbound calls or using service endpoints/private connectivity patterns |
| Incident interpretation | 499 remains key symptom | Front-end timeout waiting on blocked worker path, not immediate app-side 5xx |
Evidence Timeline
graph TD
    A[Baseline Capture] --> B[Trigger Fault]
    B --> C[During: Collect Evidence]
    C --> D[After: Compare to Baseline]
    D --> E[Verdict: Confirmed/Falsified]
Evidence Chain: Why This Proves the Hypothesis
Falsification Logic
If you observe long TimeTaken 499 patterns on /outbound and even /diag/stats, plus worker timeout/kill churn in the same window, the hypothesis is CONFIRMED because outbound connection churn is stalling request processing in a SNAT-pressure cascade.
If you do NOT observe timeout clustering, diagnostic endpoint stall, or worker churn under equivalent outbound concurrency, the hypothesis is FALSIFIED — consider upstream dependency outages or non-SNAT network constraints.