Lab Guide: Slow Start (Cold Start) vs Real Regression
This Level 3 lab guide reproduces a slow-start scenario on Azure App Service Linux and shows how to separate platform/container startup cost from steady-state request latency. The experiment uses a Python Flask app that intentionally sleeps for 30 seconds during startup and captures HTTP, platform, and app-level evidence.
Lab Metadata
| Attribute | Value |
|---|---|
| Difficulty | Intermediate |
| Estimated Duration | 45-60 minutes |
| Tier | Basic |
| Failure Mode | Slow startup initialization is mistaken for steady-state performance regression |
| Skills Practiced | Cold-start analysis, startup-vs-request latency separation, platform lifecycle interpretation, KQL timing correlation |
What this lab is designed to prove
This lab is intentionally built to challenge a common assumption: "slow first hit means app regression."
The artifact evidence shows a different outcome:
- Application startup takes ~31.3 seconds.
- HTTP first-request latency in this run is still sub-second (~0.8-0.9s).
- Most startup cost is absorbed before customer request timing starts.
1) Background
Cold start on App Service Linux is not one single operation. It is a multi-stage timeline that includes platform orchestration and application initialization.
For accurate troubleshooting, you must identify where time is spent:
- Platform work (worker assignment, network setup, volume mounts, image pull, container creation).
- Runtime boot work (Oryx startup script, Python/Gunicorn process boot).
- Application startup work (module import, global init, user startup logic).
- Warm-up probes and readiness transitions.
- First customer request routing.
1.1 Cold-start phase model
flowchart TD
    A[Trigger: deploy/restart/recycle/scale-out] --> B[Worker selected and site state enters Starting]
    B --> C[Platform actions: establish network + mount volumes]
    C --> D[Container image pull/check]
    D --> E[Container created and running]
    E --> F[Runtime startup script and process boot]
    F --> G[Application initialization]
    G --> H[Warm-up probe loop]
    H --> I[Warm-up probe success]
    I --> J[Site state Started]
    J --> K[Customer request served]
1.2 Platform cold start vs app cold start
Two different cold-start scopes matter operationally:
| Scope | What changed | Typical indicators | Common triggers |
|---|---|---|---|
| Platform cold start | New container lifecycle on worker (site not running) | AppServicePlatformLogs show PullingImage, CreatingContainer, WarmUpProbeSucceeded | Restart, scale-out, recycle, host movement |
| App cold start | App process restarts within an existing site context | New app process start timestamp, startup logs, changed PID | Code deploy, process crash, app recycle |
In incident response, teams often mix these two and over-attribute latency to application code. This lab separates them with multiple evidence channels.
1.3 App under test: why startup is intentionally slow
The lab app contains time.sleep(30) during module import:
INITIALIZATION_STARTED_AT = time.time()
...
time.sleep(30)
...
INITIALIZATION_COMPLETED_AT = time.time()
STARTUP_DURATION_SECONDS = INITIALIZATION_COMPLETED_AT - INITIALIZATION_STARTED_AT
The app then exposes startup telemetry via /timing and /diag/stats.
This makes the startup burden explicit and measurable.
1.4 Request-path and startup-path timing are not equivalent
A first customer request can be slow because:
- It waits behind startup completion.
- It hits a worker that has not completed warm-up.
- It reaches the app only after a platform probe success boundary.
But a first customer request can also be fast if startup cost was already paid during platform warm-up interval. That exact condition is demonstrated in this lab.
1.5 Timeline diagram: where cold-start latency can hide
sequenceDiagram
    participant Client as Client
    participant FrontEnd as App Service Front End
    participant Platform as Linux Worker Orchestrator
    participant Container as Site Container
    participant App as Gunicorn/Flask App

    Platform->>Container: Create + start container
    Container->>App: Runtime boot + app import
    Note over App: time.sleep(30) executes
    Platform->>App: Warm-up probe cycle
    App-->>Platform: Probe success
    Platform-->>FrontEnd: Site started and routable
    Client->>FrontEnd: First request /timing
    FrontEnd->>App: Forward request
    App-->>Client: HTTP 200 in ~0.8-0.9s
1.6 Warm-up and mitigation controls
App Service offers several warm-up and cold-start mitigation knobs. Their effect depends on plan tier, runtime, and deployment pattern.
| Control | Purpose | Lab relevance |
|---|---|---|
| Always On | Keep app active and reduce idle cold starts | Disabled in this lab by design |
| Health check | Keep only healthy instances in rotation | Not set in this lab (healthCheckPath: null) |
WEBSITE_SWAP_WARMUP_PING_PATH | Warm path for slot swap readiness | Not used in this single-slot lab |
| Slot warm-up and swap | Shift startup cost pre-cutover | Covered in companion slot-swap lab |
Tier behavior matters
On lower tiers, mitigation options may be limited or operationally different from Standard/Premium patterns. Always interpret cold-start behavior in context of App Service plan capability.
Portal view: General settings (Always on toggle)
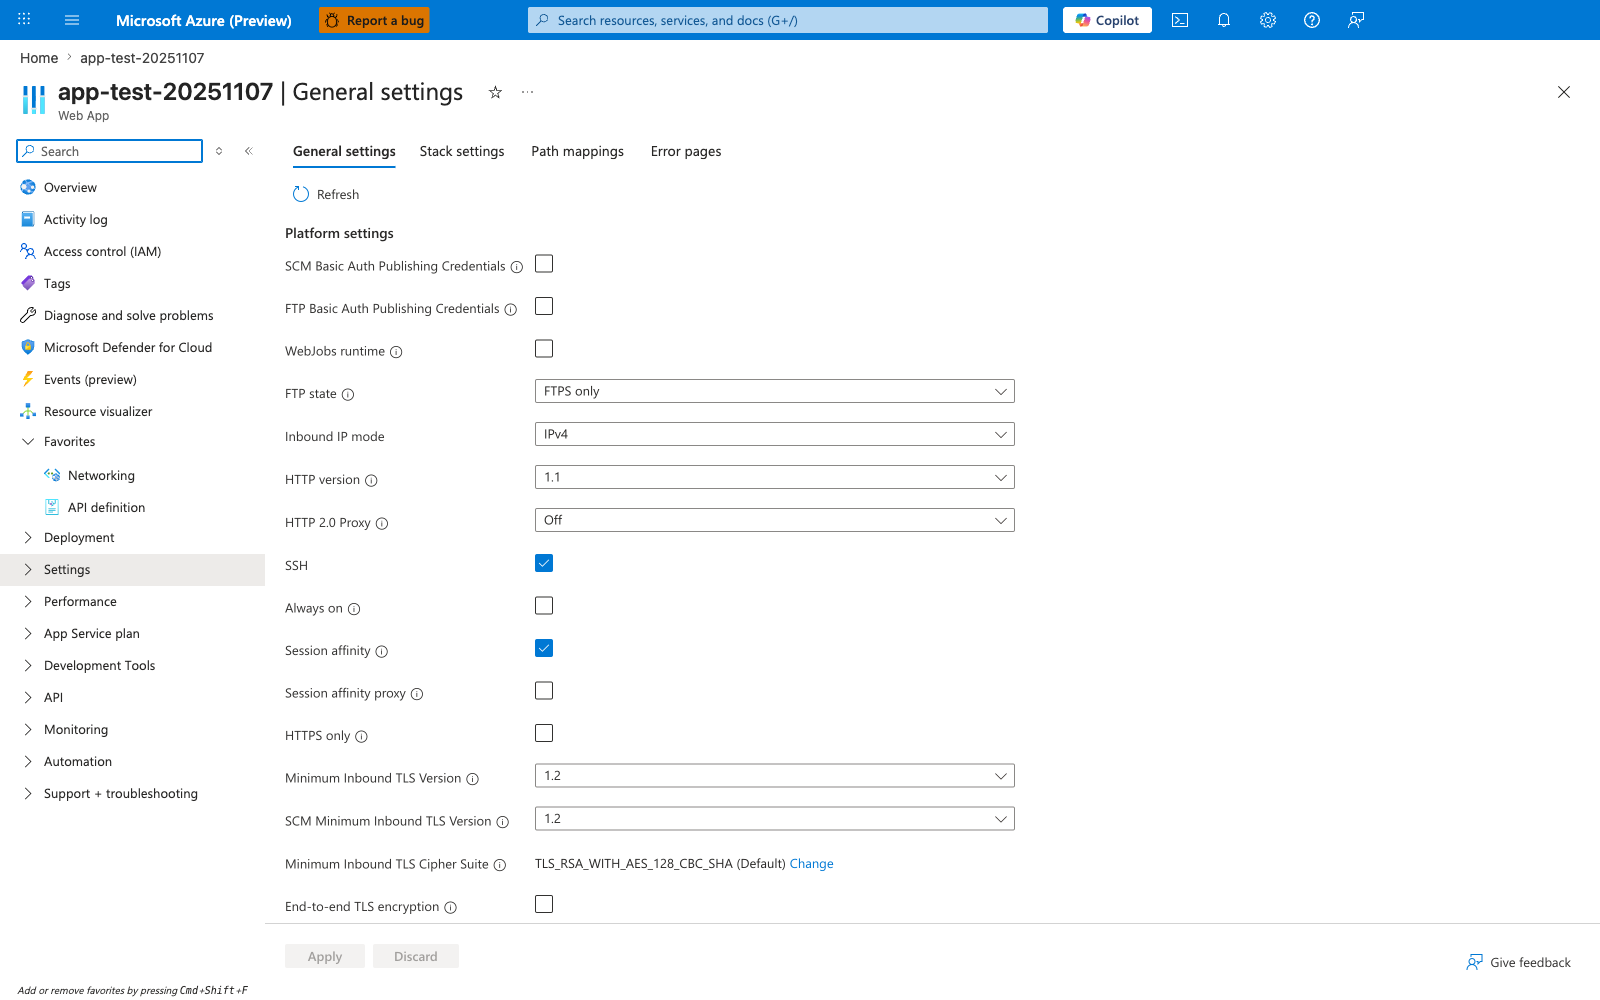
The Always on toggle lives under Settings > Configuration > General settings. In this capture it is disabled - the same configuration this lab deploys via Bicep so that the cold-start path is exercised on every restart. Toggle this on to keep the worker warm between requests, which prevents the platform from unloading the site after the default idle timeout and avoids paying the container plus runtime plus app-import cost on the next user hit. Note the tier and feature limitations from the warning above: Always on requires a Basic tier or higher (Free and Shared do not support it), so the mitigation you choose must match the plan you are running on. Use this blade to confirm Always on state before drawing conclusions about cold-start frequency or asking app teams to investigate "slow first hit" reports.
1.7 Why this matters for troubleshooting quality
Without phase-level attribution, teams may:
- Escalate false regressions to app teams.
- Roll back healthy releases.
- Miss platform lifecycle causes (restart/recycle/startup probe delays).
This guide aligns evidence from:
- App telemetry (
startup_duration, process timestamps). - HTTP logs (
TimeTaken, paths, status). - Platform logs (container lifecycle and warm-up transitions).
1.8 MS Learn grounding for startup behavior
Core conceptual docs used by this runbook:
- App configuration and app settings behavior.
- Diagnostics logging for App Service.
- Hosting plan tier behavior.
- Staging/slot warm-up concepts for production deployments.
Links are listed in Sources.
2) Hypothesis
2.1 Formal hypothesis statement
On a B1 Linux App Service plan, cold start adds measurable latency to lifecycle readiness after restart, with the majority of time spent in container/application initialization rather than in the first user HTTP request itself.
2.2 Causal chain
flowchart TD
    A[Restart or deployment trigger] --> B[Container lifecycle starts]
    B --> C[Runtime and app initialization]
    C --> D[Warm-up probe loop]
    D --> E[Site enters Started state]
    E --> F[First customer request]
    F --> G[Observed HTTP latency]

    C --> H["App startup_duration metric (~31s)"]
    D --> I[Platform warm-up success signal]
    G --> J[Request-level TimeTaken in HTTP logs]
2.3 Proof criteria
All of the following support the hypothesis:
- Startup telemetry (
/diag/stats,/timing) shows ~30+ second app initialization. - Platform logs include explicit startup lifecycle and probe success events.
- HTTP first-hit latency is not necessarily equal to startup duration.
- Steady-state warm requests remain in similar low range after startup.
- Evidence shows startup cost can be paid before first external request.
2.4 Disproof criteria
Any of these weakens the hypothesis:
- App startup telemetry is short (<2s), but first request repeatedly spikes high.
- Platform logs show no lifecycle transitions near slow periods.
- Warm requests remain persistently degraded after startup window.
- Latency increase correlates with sustained app-level regression signals (CPU, errors, dependency slowdowns) rather than startup transitions.
2.5 Expected outcomes for this specific lab build
Because startup has an intentional sleep(30), we expect:
- Startup metrics around ~31 seconds.
- Warm-up/probe lifecycle in platform logs.
- Warm and "cold-labeled" HTTP requests both in sub-second band for this run.
- Interpretation: startup delay is real, but not visible as a giant first HTTP spike.
2.6 Counter-hypothesis tested implicitly
Counter-hypothesis:
"If startup is 31 seconds, first HTTP request must also be ~31 seconds."
This lab disproves that simplification and demonstrates why startup-window timing and customer request timing can diverge.
3) Runbook
This section is execution-oriented and uses long-form Azure CLI flags only.
3.1 Prerequisites
| Tool | Check command |
|---|---|
| Azure CLI | az version |
| Bash | bash --version |
| Python 3 | python3 --version |
| Authenticated session | az account show |
3.2 Variables
Use these variables in subsequent commands:
3.3 Deploy infrastructure
az group create \
  --name "$RG" \
  --location "$LOCATION"

az deployment group create \
  --resource-group "$RG" \
  --template-file "labs/slow-start-cold-start/main.bicep" \
  --parameters "baseName=$BASE_NAME"
Capture app name:
APP_NAME=$(az webapp list \
  --resource-group "$RG" \
  --query "[0].name" \
  --output tsv)

APP_HOSTNAME=$(az webapp show \
  --resource-group "$RG" \
  --name "$APP_NAME" \
  --query "defaultHostName" \
  --output tsv)

APP_URL="https://$APP_HOSTNAME"
3.4 Verify baseline configuration
Run these before trigger to confirm plan behavior assumptions:
az webapp config show \
  --resource-group "$RG" \
  --name "$APP_NAME"

curl --silent --show-error "$APP_URL/health"
curl --silent --show-error "$APP_URL/diag/stats"
curl --silent --show-error "$APP_URL/timing"
Observed baseline artifact evidence (sanitized):
3.5 Trigger measurement workflow
Use the provided trigger script:
The script performs:
- Infra deployment and zip deploy.
- Initial request latency capture.
- Ten warm
/fastrequests. - App restart.
- Post-restart first request capture.
- Warm-post request series.
3.6 Manual fallback (if you do not use trigger.sh)
3.6.1 Deploy app package
az webapp deploy \
  --resource-group "$RG" \
  --name "$APP_NAME" \
  --src-path "labs/slow-start-cold-start/app.zip" \
  --type zip \
  --clean true \
  --restart true
3.6.2 Measure request latency
curl --silent --show-error --output /dev/null --write-out "%{time_total}\n" "$APP_URL/timing"
curl --silent --show-error --output /dev/null --write-out "%{time_total}\n" "$APP_URL/fast"
3.6.3 Force restart and re-measure
az webapp restart \
  --resource-group "$RG" \
  --name "$APP_NAME"

curl --silent --show-error --output /dev/null --write-out "%{time_total}\n" "$APP_URL/timing"
3.7 Collect KQL evidence
Portal view: Log stream (live startup tail)
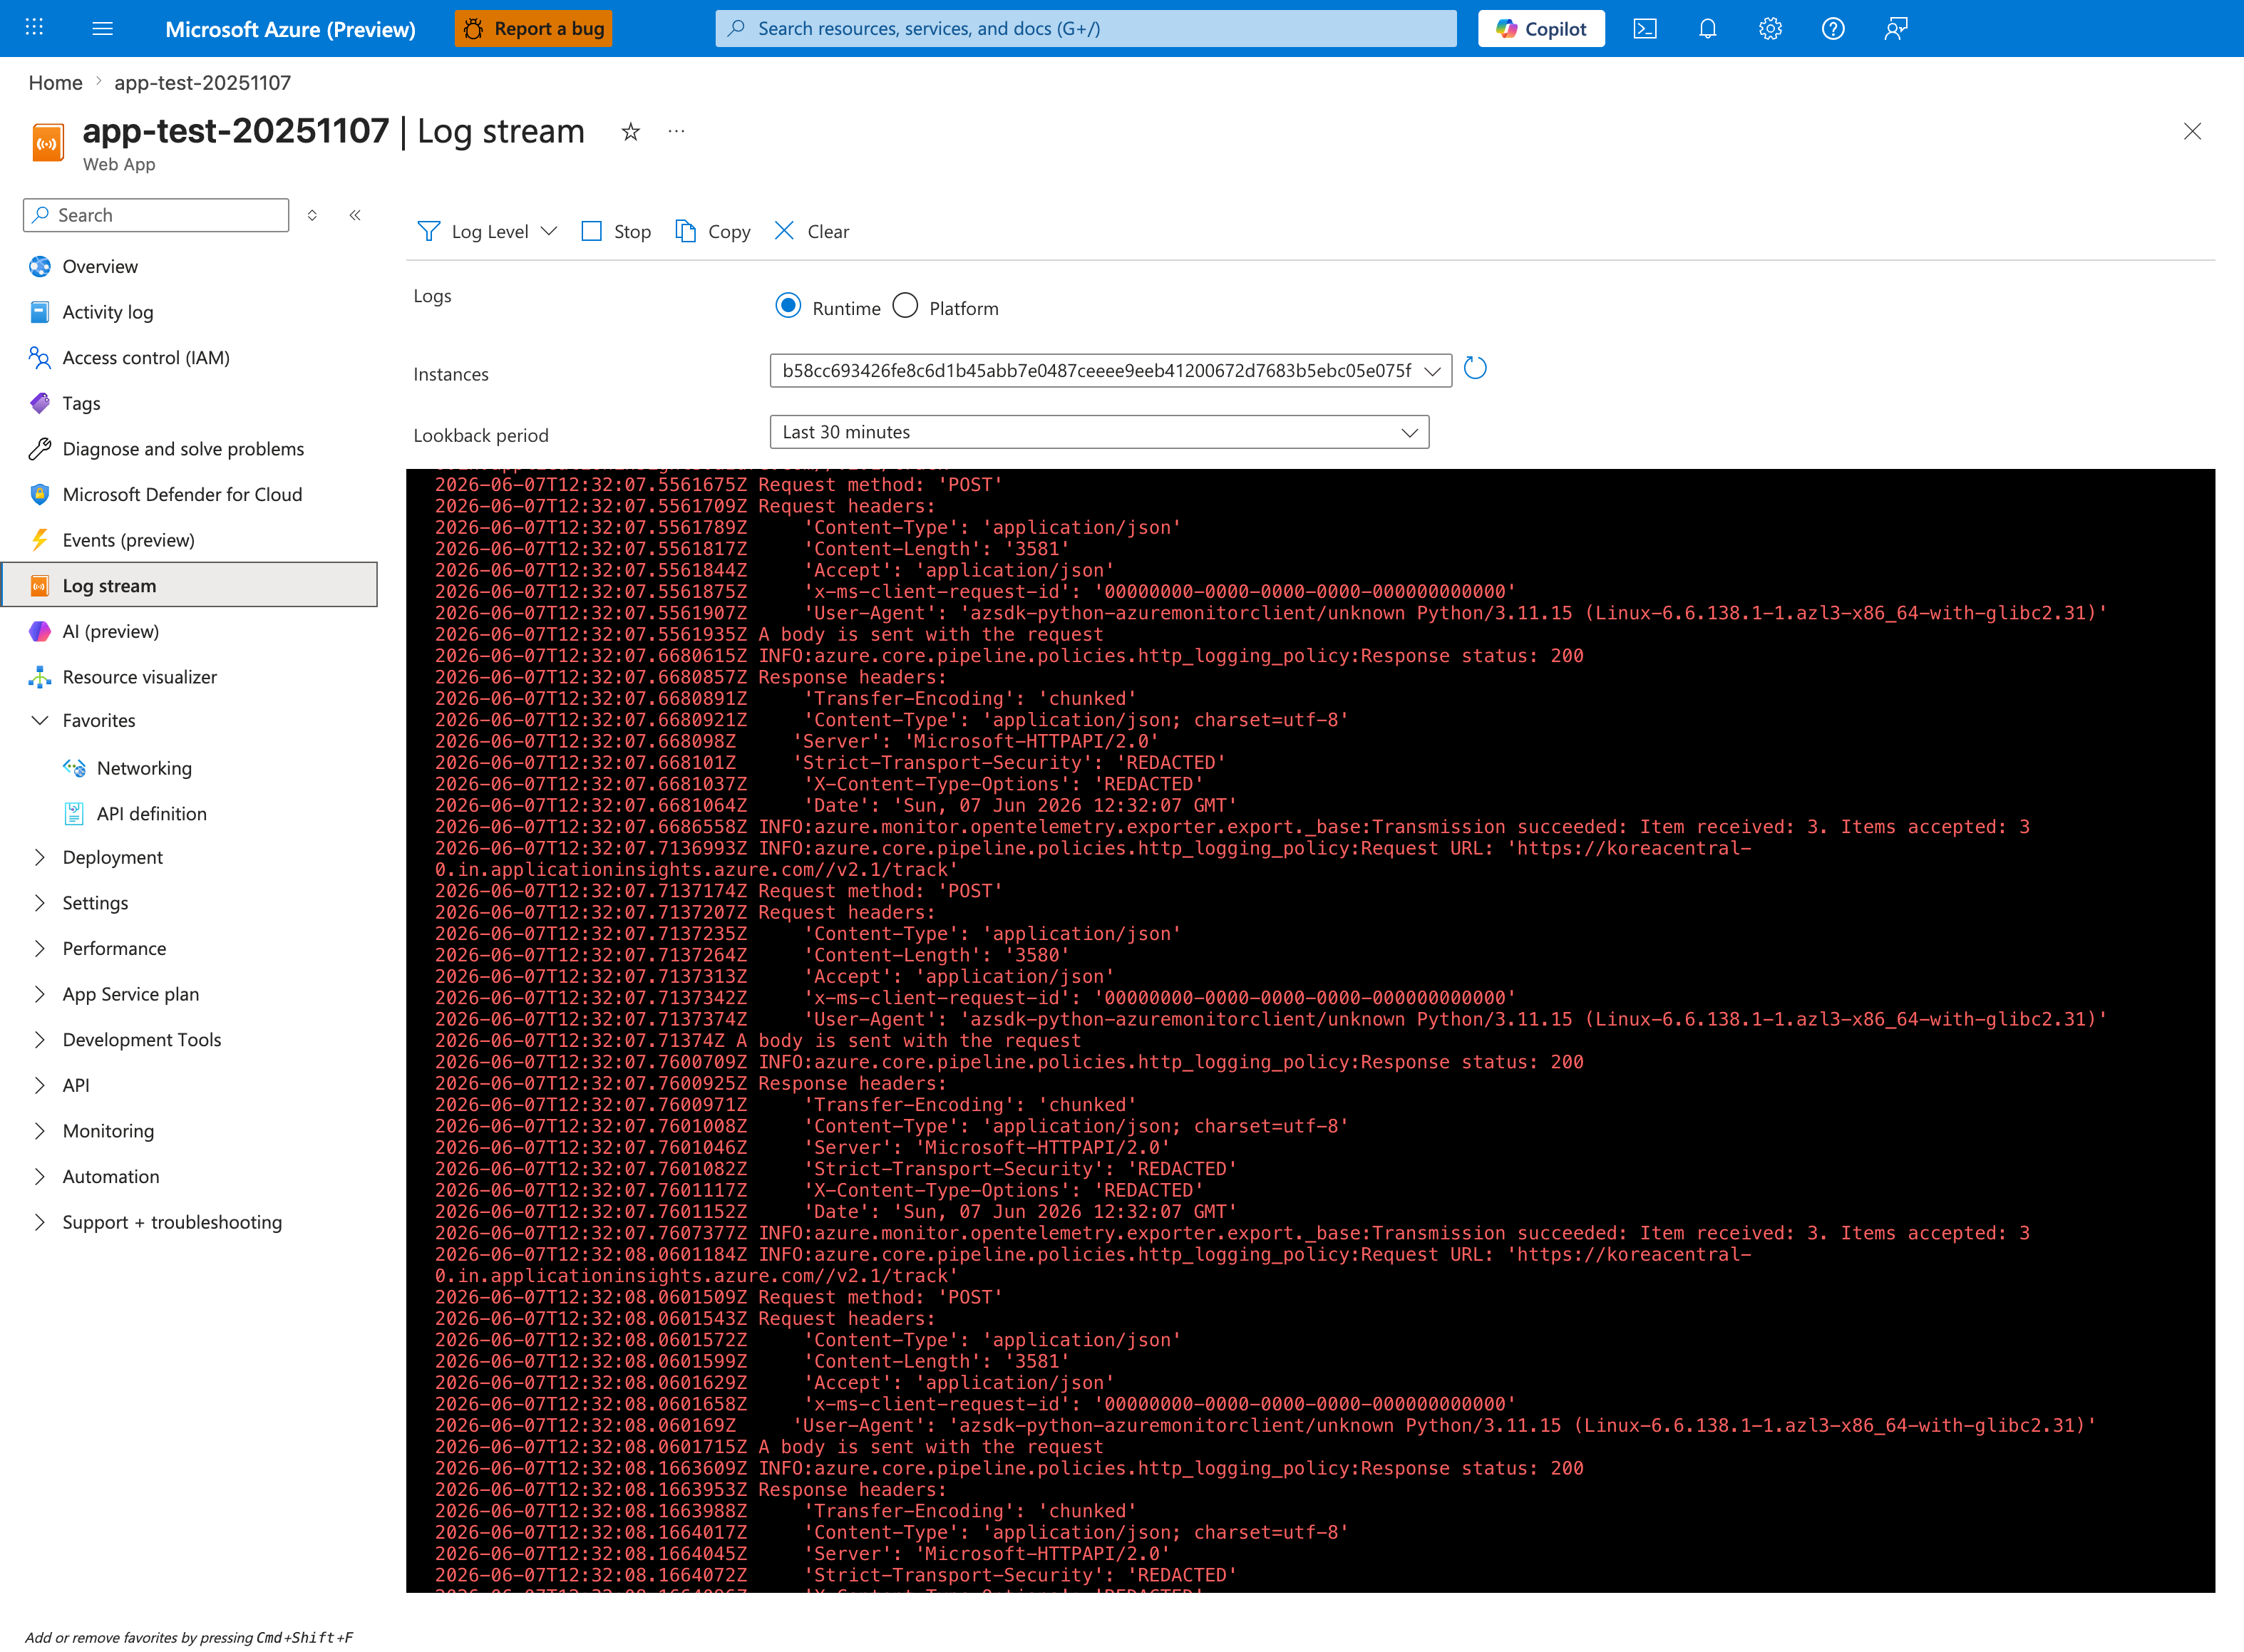
The Log stream blade gives you a live view of startup progress without ingestion delay, which is critical when measuring cold-start phases that are over in seconds. This capture shows the Runtime radio selected and the Instances dropdown pinned to a single worker hash (b58cc693...) - the correct posture for measuring one instance's cold-start timeline cleanly. Toggle to the Platform radio when you want container lifecycle events from the platform instead of application STDOUT; the Lookback period: Last 30 minutes setting is short enough to scope a single restart cycle and avoid noise from the previous instance. After capturing the live trace here, run the KQL queries below to aggregate the same signals across multiple restarts for trending.
Portal view: Metrics (Response Time, Avg, last 24 hours)
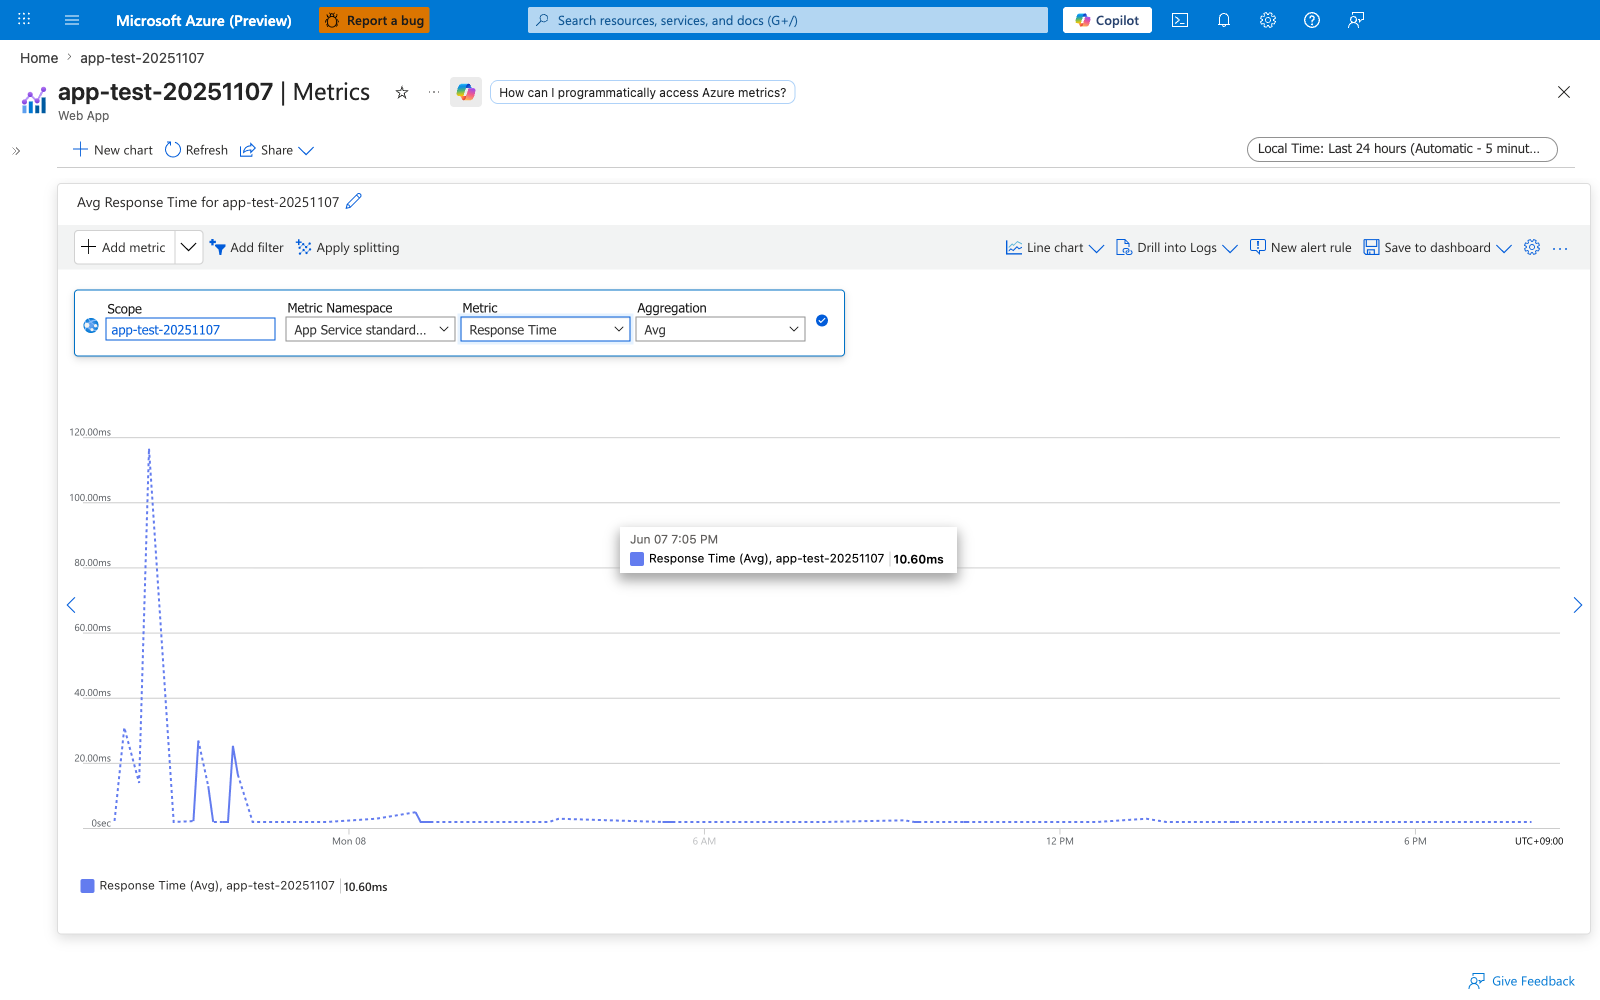
The Metrics blade is the second view to open during cold-start triage because it shows the platform-side measurement (Response Time) that is independent of any Application Insights instrumentation the app team may or may not have wired up. Set Metric Namespace to App Service standard metrics, pick Response Time for the Metric, and leave Aggregation at Avg for the first read; switch to Max later to expose worst-case cold-start hits that an average smooths away. The early spike approaching 120ms followed by a flat near-zero baseline in this capture is the visual signature of a single restart cycle paying the cold-start cost once at the top of the window, then handling warm traffic for the remainder of the day - the exact shape this lab is designed to reproduce. Save this chart to a dashboard once you have a known-good configuration so the next operator can open the same view without re-selecting metric, namespace, and aggregation.
Retrieve HTTP log evidence:
AppServiceHTTPLogs
| where TimeGenerated > ago(2h)
| where CsHost has "app-labcold"
| project TimeGenerated, CsUriStem, ScStatus, TimeTaken, CsHost
| order by TimeGenerated desc
Retrieve platform lifecycle evidence:
AppServicePlatformLogs
| where TimeGenerated > ago(2h)
| where Message has_any ("WarmUpProbeSucceeded", "Site startup probe succeeded", "CreatingContainer", "PullingImage", "Site started", "stopped")
| project TimeGenerated, Level, Message
| order by TimeGenerated desc
Retrieve console evidence:
AppServiceConsoleLogs
| where TimeGenerated > ago(2h)
| where ResultDescription has_any ("gunicorn", "Starting", "Booting worker", "ERROR")
| project TimeGenerated, ResultDescription
| order by TimeGenerated desc
3.8 Real output snippets (captured)
HTTP logs include sub-second request service times (TimeTaken is milliseconds):
2026-04-04T05:45:18.910231Z  /fast   200  332
2026-04-04T05:45:19.792462Z  /fast   200   67
2026-04-04T05:45:22.347736Z  /fast   200   17
2026-04-04T05:45:42.509783Z  /timing 200    8
2026-04-04T05:45:53.949776Z  /timing 200   21
Platform logs capture warm-up lifecycle transitions:
State: Starting, Action: WarmUpProbeSucceeded ... Site startup probe succeeded after 68.0508489 seconds.
Site startup probe succeeded after 68.0508489 seconds.
Site started.
App-level timing endpoint captures startup duration:
3.9 Interpretation checklist during execution
Use this table while running the lab:
| Check | Evidence source | Pass condition |
|---|---|---|
| Startup duration present | /timing, /diag/stats | ~31 seconds reported |
| First-hit latency measured | cold-latency-*.csv | Values captured for restart cycles |
| Warm baseline measured | warm-latencies-*.csv | 10 values captured |
| Post-restart warm measured | warm-post-latencies-*.csv | Additional warm values captured |
| Platform startup lifecycle present | kql-platform-*.json | Warm-up/probe/start events visible |
3.10 Decision logic during triage
flowchart TD
    A[Slow first-hit complaint] --> B{Startup lifecycle events near issue window?}
    B -->|Yes| C{Warm path also slow?}
    B -->|No| D[Investigate non-startup causes first]
    C -->|No| E[Classify as startup transient]
    C -->|Yes| F[Investigate sustained regression]
    E --> G[Consider warm-up mitigations]
    F --> H[Open app/dependency performance investigation]
4) Experiment Log
This section uses only captured data under:
labs/slow-start-cold-start/artifacts-sanitized/
4.1 Artifact inventory
| Category | Files |
|---|---|
| Baseline | diag-stats.json, app-config.json, health.json, timing.json, diag-env.json |
| Trigger latency | warm-latencies-20260404T054518Z.csv, cold-latency-20260404T054518Z.csv, warm-post-latencies-20260404T054518Z.csv |
| Trigger app telemetry | timing-response-20260404T054518Z.json, diag-stats-postcold-20260404T054518Z.json, diag-stats-final-20260404T054518Z.json |
| KQL exports | kql-http-20260404T060610Z.json, kql-console-20260404T060610Z.json, kql-platform-20260404T060610Z.json |
4.2 Baseline evidence snapshot
4.2.1 Baseline /diag/stats
{"endpoint_counters":{"<unknown>":1,"diag_stats":2,"index":1},"initialization_completed_at":"2026-04-04T05:14:38.440202+00:00","initialization_started_at":"2026-04-04T05:14:07.173440+00:00","pid":1896,"process_start_time":"2026-04-04T05:14:38.440202+00:00","request_count":4,"startup_duration_seconds":31.267,"uptime_seconds":1114.875}
4.2.2 Baseline /timing
{"current_time":"2026-04-04T05:33:14.856715+00:00","request_count":5,"startup_duration":31.267,"uptime_seconds":1116.417}
4.2.3 Baseline app config highlights
From baseline/app-config.json:
| Setting | Value |
|---|---|
alwaysOn | false |
linuxFxVersion | PYTHON|3.11 |
appCommandLine | gunicorn --bind=0.0.0.0 --timeout=180 --workers=2 app:app |
healthCheckPath | null |
ftpsState | Disabled |
4.3 Latency dataset (raw values)
4.3.1 Warm pre-restart (10 requests)
| Label | Request index | Seconds |
|---|---|---|
| warm | 1 | 1.074682 |
| warm | 2 | 0.885271 |
| warm | 3 | 0.907336 |
| warm | 4 | 0.781947 |
| warm | 5 | 0.897924 |
| warm | 6 | 0.912066 |
| warm | 7 | 0.955691 |
| warm | 8 | 0.828223 |
| warm | 9 | 0.962603 |
| warm | 10 | 0.750138 |
4.3.2 Cold-labeled measurements (restart cycles)
| Label | Restart cycle | Seconds |
|---|---|---|
| cold | 1 | 0.938001 |
| cold | 2 | 0.798990 |
4.3.3 Warm post-restart (5 requests)
| Label | Request index | Seconds |
|---|---|---|
| warm_post | 1 | 0.888190 |
| warm_post | 2 | 0.869994 |
| warm_post | 3 | 0.817254 |
| warm_post | 4 | 0.773853 |
| warm_post | 5 | 0.698639 |
4.4 Latency summary statistics
Computed from the CSV artifacts:
| Metric | Value |
|---|---|
| Warm average (10) | 0.895588 s |
| Warm minimum | 0.750138 s |
| Warm maximum | 1.074682 s |
| Cold average (2) | 0.868495 s |
| Cold minimum | 0.798990 s |
| Cold maximum | 0.938001 s |
| Warm-post average (5) | 0.809586 s |
| Warm-post minimum | 0.698639 s |
| Warm-post maximum | 0.888190 s |
Derived deltas:
| Comparison | Delta |
|---|---|
| Cold average - Warm average | -27.09 ms |
| Cold average - Warm-post average | +58.91 ms |
4.5 App startup telemetry consistency
4.5.1 Trigger timing response
{"current_time":"2026-04-04T05:45:42.507800+00:00","request_count":12,"startup_duration":31.305,"uptime_seconds":1864.177}
4.5.2 Trigger diag stats (post-cold capture)
4.5.3 Trigger diag stats (final capture)
Across captures, startup duration remains consistently near 31.3 seconds.
4.6 KQL export quantitative summary
| File | Row count |
|---|---|
kql-http-20260404T060610Z.json | 28 |
kql-console-20260404T060610Z.json | 0 |
kql-platform-20260404T060610Z.json | 127 |
4.7 HTTP log observations from export
Representative entries from kql-http-20260404T060610Z.json:
| TimeGenerated (UTC) | Path | Status | TimeTaken (ms) |
|---|---|---|---|
| 2026-04-04T05:45:18.910231Z | /fast | 200 | 332 |
| 2026-04-04T05:45:19.792462Z | /fast | 200 | 67 |
| 2026-04-04T05:45:20.730507Z | /fast | 200 | 17 |
| 2026-04-04T05:45:21.497297Z | /fast | 200 | 21 |
| 2026-04-04T05:45:42.509783Z | /timing | 200 | 8 |
| 2026-04-04T05:45:53.949776Z | /timing | 200 | 21 |
Observation: request execution times remain short while startup telemetry still indicates long initialization history.
4.8 Platform log observations from export
Representative lifecycle events:
| TimeGenerated (UTC) | Level | Message excerpt |
|---|---|---|
| 2026-04-04T05:13:27.5582572Z | Informational | Action: PullingImage |
| 2026-04-04T05:13:30.1113279Z | Informational | Action: CreatingContainer ... successfully created and is running |
| 2026-04-04T05:13:30.3607994Z | Informational | Container start method finished after 2764 ms |
| 2026-04-04T05:14:38.516515Z | Informational | Site startup probe succeeded after 68.0508489 seconds. |
| 2026-04-04T05:14:39.0727291Z | Informational | Site started. |
| 2026-04-04T05:45:52.5352677Z | Informational | Image ... is pulled from registry |
| 2026-04-04T05:45:54.5837782Z | Informational | Container start method finished after 6054 ms |
Interpretation:
- Platform-level startup timeline includes warm-up/probe duration significantly larger than per-request latency.
- This aligns with app-level startup-duration telemetry near 31 seconds.
4.9 Core finding and explanation
Key finding (validated)
Startup duration is ~31.3 seconds, but cold-vs-warm request latency difference is minimal in this run (both mostly ~0.8-1.0 seconds).
The startup penalty is primarily paid during container initialization and warm-up probe progression before customer request timing is observed.
This is exactly the analytical outcome this lab was designed to demonstrate.
4.10 Hypothesis verdict
| Criterion | Result | Evidence |
|---|---|---|
| Startup duration around 30+ seconds exists | Supported | /timing, /diag/stats (~31.267 to 31.305) |
| Platform startup lifecycle visible | Supported | kql-platform-20260404T060610Z.json |
| First HTTP request necessarily equals startup duration | Not supported (as expected) | cold-latency 0.799-0.938 s |
| Warm steady state remains similar band | Supported | warm and warm-post datasets |
Final verdict: Hypothesis supported, with nuanced interpretation that startup cost and request latency can be decoupled in observed telemetry windows.
4.11 Practical troubleshooting implications
- Do not classify startup-duration telemetry as app regression without warm-path comparison.
- Anchor triage on time-window correlation between platform lifecycle and HTTP latency.
- Maintain separate dashboards/queries for:
- startup lifecycle transitions,
- first-hit behavior,
- warm steady-state behavior.
- Use slot warm-up strategies for production rollout if startup is expensive.
4.12 Reproducibility notes
- All artifact values in this document were copied from sanitized files in the repository.
- Subscription IDs and host domains are redacted where present.
- No synthetic placeholder values were inserted into experiment tables.
Expected Evidence
This section defines what you SHOULD observe at each phase of the lab. Use it to validate your investigation is on track.
Before Trigger (Baseline)
| Evidence Source | Expected State | What to Capture |
|---|---|---|
| Site runtime state | App is stopped, restarted, or otherwise cold before first measurement | Resource state and trigger/restart timestamp |
Baseline endpoints (/health, /diag/stats) | App becomes healthy when started | Baseline health and startup telemetry snapshots |
| Plan/runtime context | Cold-start-prone configuration is present | B1 Linux context and AlwaysOn=false for this lab |
During Incident
| Evidence Source | Expected State | Key Indicator |
|---|---|---|
App timing endpoint (/timing) | First post-cold-start measurement reflects startup burden | startup_duration around 31.499s |
| AppServicePlatformLogs | Startup probe lifecycle explicitly recorded | Site startup probe succeeded after startup window |
| AppServiceHTTPLogs | Requests return 200 while warm-state calls are much faster | /timing 200 with TimeTaken=11ms after warmup |
After Recovery
| Evidence Source | Expected State | Key Indicator |
|---|---|---|
| Subsequent request timings | Warm requests remain low-latency | Repeated calls in ~11-41ms band |
| Worker/process telemetry | Startup cost is no longer paid per request | Stable PID/uptime and normal /diag/stats progression |
| Incident conclusion | Cold start explains initial delay, not steady-state regression | Warm traffic remains healthy and fast |
Evidence Timeline
graph TD
    A[Baseline Capture] --> B[Trigger Fault]
    B --> C[During: Collect Evidence]
    C --> D[After: Compare to Baseline]
    D --> E[Verdict: Confirmed/Falsified]
Evidence Chain: Why This Proves the Hypothesis
Falsification Logic
If you observe a long startup duration (~31.499s) during cold start, platform startup-probe success events, and then rapid warm-path request timings (for example 11-41ms), the hypothesis is CONFIRMED because initialization cost is front-loaded into container/runtime startup rather than persistent request execution.
If you do NOT observe warm-path recovery (for example requests remain slow after startup stabilizes), the hypothesis is FALSIFIED — consider alternatives such as real app regression, dependency latency, CPU pressure, or plan capacity limits.
Clean Up
Related Playbook
See Also
- Playbook: Slow Start (Cold Start)
- Playbook: Warm-up vs Health Check
- KQL: Restart Timing Correlation
- KQL: Slowest Requests by Path
- Troubleshooting Method