Lab: No Space Left on Device (Persistent /home Exhaustion vs Ephemeral /tmp Pressure)
This lab reproduces App Service Linux filesystem pressure and makes one critical diagnostic distinction:
/homeis persistent quota-backed storage./tmpis ephemeral worker-local storage.
In the captured experiment, /home reaches 100% utilization, write operations start failing with ENOSPC, but health probes still return HTTP 200.
That combination is the core troubleshooting lesson.
This guide helps you explain App Service Linux storage surfaces and quota behavior, differentiate persistent-storage exhaustion from runtime health failures, prove ENOSPC with application and telemetry evidence, validate that /health can remain 200 while business writes fail, and build a disk-pressure runbook.
Lab Metadata
| Attribute | Value |
|---|---|
| Difficulty | Intermediate |
| Estimated Duration | 45-60 minutes |
| Tier | Basic |
| Failure Mode | Persistent /home storage exhausts and write operations fail with ENOSPC while lightweight health probes stay healthy |
| Skills Practiced | Filesystem pressure analysis, health-vs-functional probe comparison, HTTP and console log correlation, remediation planning |
1) Background
1.1 Why this failure mode is often misdiagnosed
Teams often map “disk full” to “site down”.
But disk failures are frequently partial failures:
- read-only and lightweight endpoints still succeed,
- health probes remain green,
- write-heavy paths fail with
No space left on device.
This can create dangerous false confidence if monitoring relies only on /health.
1.2 App Service Linux storage model (practical view)
In a typical Linux app on App Service, you will observe:
- Application root filesystem overlay mounted at
/. - Persistent storage mounted under
/home. - Temporary scratch space under
/tmp.
/home/site/wwwroot is commonly used for app content and app-writable folders, depending on deployment style and runtime behavior.
1.3 Persistent vs ephemeral semantics
| Path | Typical use | Persistence | Quota behavior |
|---|---|---|---|
/home | App files, logs, writable app data | Persistent across restarts | Quota constrained (for this lab: 10 GB observed) |
/tmp | Temporary files, transient scratch | Ephemeral | Worker storage, not durable |
/ | Container overlay and system view | Runtime overlay | Not your persistent app data store |
1.4 Quota context for this lab
The user scenario asks to reason with Free vs Paid tier intuition:
- Free tier often has much smaller quota (commonly around 1 GB).
- Paid tiers provide larger persistent quota.
In this experiment’s artifacts, /home total bytes are exactly:
10,737,418,240 bytes (10 GB decimal-class quota representation at binary byte level).
Portal view: App Service Plan Overview blade (pricing tier and shared-storage context)
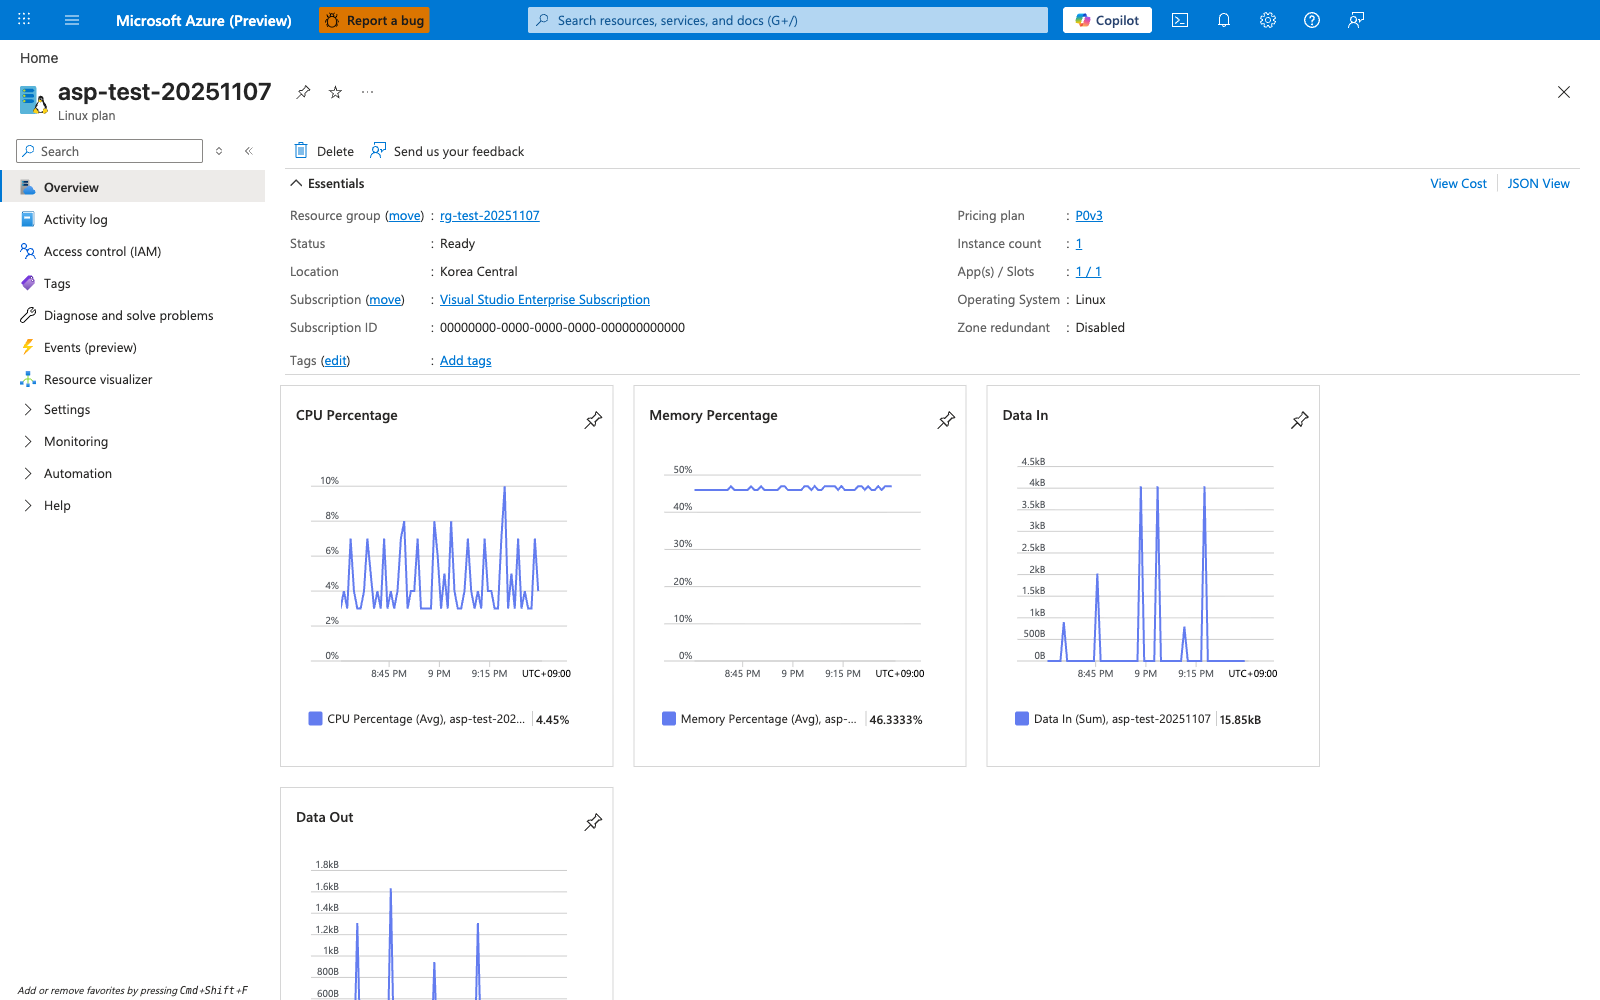
The App Service Plan Overview blade confirms three platform-side facts that anchor this lab's assumptions - the Pricing plan value (here P0v3) confirms the SKU tier that controls compute resources (CPU, memory, scale-up options), the Operating System: Linux field confirms which storage model from section 1.2 applies, and the App(s) / Slots: 1 / 1 field confirms that this plan currently hosts 1 app and 1 deployment slot. The App(s) / Slots field matters because /home storage is shared across every app and deployment slot bound to the same plan: a second app on the same plan would consume from the same pool described in section 1.3's persistent-vs-ephemeral semantics, which is the most common real-world source of "I didn't change anything and now I'm out of space". The 10,737,418,240 byte quota cited above comes from this lab's runtime artifacts (section 1.4) and from the official App Service limits documentation - this Overview blade does not surface that quota value as a field, so do not infer the quota directly from anything visible on this capture. Use this blade as your first stop when investigating "no space left on device" errors in production: confirm the SKU and OS first, click the Pricing plan link to reach the Scale up blade if compute starvation is in scope, or expand the left navigation to locate the plan's Apps blade and enumerate other apps that may be competing for the shared /home quota.
1.5 Why writes fail while health still succeeds
The lab app exposes:
/health(simple JSON response, no large disk write dependency),/fill-home(writes large files into/home/site/wwwroot/temp),/fill-tmp(writes large files into/tmp/no-space-lab).
If /home is exhausted:
/fill-homefails withOSError: [Errno 28] No space left on device./healthcan still return 200.
This is exactly what the artifact set shows.
1.6 Storage architecture diagram
flowchart TD
    A[Incoming HTTP Request] --> B{Endpoint type}
    B -->|/health| C[In-memory response path]
    B -->|/fill-home| D[Write payload to /home/site/wwwroot/temp]
    B -->|/fill-tmp| E[Write payload to /tmp/no-space-lab]

    D --> F{Persistent /home has free space?}
    F -->|Yes| G[Write succeeds 200]
    F -->|No| H[ENOSPC -> app returns 507]

    E --> I{Ephemeral /tmp has free space?}
    I -->|Yes| J[Write succeeds 200]
    I -->|No| K[ENOSPC -> app returns 507]

    C --> L[Health remains 200]

    style L fill:#c8e6c9
    style H fill:#ffcdd2
    style K fill:#ffcdd2
1.7 Lifecycle of disk pressure in this lab
sequenceDiagram
    participant Operator
    participant App as Flask App
    participant Home as /home storage
    participant Tmp as /tmp storage
    participant Logs as Log Analytics

    Operator->>App: GET /disk-status (baseline)
    App-->>Operator: /home ~0.53% used
    Operator->>App: Repeat GET /fill-home?size_mb=100
    App->>Home: create diskfill files
    Home-->>App: writes succeed
    Operator->>App: Repeat GET /fill-tmp?size_mb=100
    App->>Tmp: create diskfill files
    Tmp-->>App: writes succeed
    Operator->>App: Aggressive GET /fill-home?size_mb=500
    App->>Home: write until quota edge
    Home-->>App: ENOSPC
    App-->>Operator: HTTP 507
    App->>Logs: emit OSError Errno 28
    Operator->>App: GET /health
    App-->>Operator: HTTP 200
1.8 Isolation misconception to avoid
A common misconception:
“If
/homeis full, the whole app must crash immediately.”
Reality:
- Failures are path-dependent.
- Endpoints that allocate large files fail first.
- Lightweight endpoints may continue serving.
1.9 Diagram: symptom matrix by endpoint behavior
graph TD
    A[/health/] --> A1[No large write]
    A1 --> A2[200 OK]

    B[/fill-home/] --> B1[Write to /home]
    B1 --> B2{/home free bytes > 0?}
    B2 -->|Yes| B3[200 written]
    B2 -->|No| B4[507 ENOSPC]

    C[/fill-tmp/] --> C1[Write to /tmp]
    C1 --> C2{/tmp free bytes > 0?}
    C2 -->|Yes| C3[200 written]
    C2 -->|No| C4[507 ENOSPC]

    style A2 fill:#c8e6c9
    style B4 fill:#ffcdd2
    style C4 fill:#ffcdd2
1.10 Filesystem metrics used in this guide
| Metric | Source | Meaning |
|---|---|---|
total_bytes | /disk-status or /diag/disk | Filesystem capacity |
used_bytes | /disk-status or /diag/disk | Bytes consumed |
free_bytes | /disk-status or /diag/disk | Remaining writable bytes |
used_percent | /disk-status or /diag/disk | Utilization percentage |
status | endpoint payload | Endpoint-reported state |
1.11 Diagnostic endpoints in the lab app
| Endpoint | Function |
|---|---|
/health | Basic health response |
/disk-status | Returns summary for home temp directory and tmp temp directory |
/fill-home?size_mb=N | Writes N MB to persistent home temp directory |
/fill-tmp?size_mb=N | Writes N MB to tmp temp directory |
/diag/disk | Expanded filesystem diagnostics and mount metadata |
/diag/stats | Runtime counters (total_bytes_written, endpoint counts) |
/cleanup | Deletes generated files from lab directories |
1.12 Background takeaway
Disk-pressure incidents require endpoint-level behavioral validation, not only app-level up/down checks.
2) Hypothesis
2.1 Primary hypothesis (this lab)
When application code writes large files to /home until the persistent quota is exhausted, subsequent write operations fail with ENOSPC, while health probes can continue returning 200 because they do not require disk writes.
2.2 Causal chain
1. App exposes write endpoints and health endpoint
      ↓
2. Repeated /fill-home writes consume /home persistent quota
      ↓
3. /home free bytes approach zero
      ↓
4. Kernel returns OSError Errno 28 (No space left on device)
      ↓
5. /fill-home endpoint returns HTTP 507 with ENOSPC payload
      ↓
6. /health endpoint still returns HTTP 200
      ↓
7. Incident appears as partial degradation, not full outage
2.3 Proof criteria
All criteria below must be satisfied:
- Baseline
/homehas high free space and low used percent. - Repeated
/fill-homecalls increase/homeusage significantly. - At high utilization,
/fill-homereturns statuserrorwithErrno 28. - HTTP telemetry records at least one
507for/fill-home. - Console logs include
No space left on device. /healthremains 200 during or after ENOSPC event.
2.4 Disproof criteria
Any one condition disproves the hypothesis:
/fill-homenever fails despite verified/homeexhaustion.ENOSPCdoes not appear in either app payloads or console logs./healthfails for unrelated reasons before storage quota is reached.- Failures occur only in
/tmpwhile/homeremains largely free.
2.5 Controlled and observed variables
| Type | Variable |
|---|---|
| Controlled | Runtime Python 3.11 |
| Controlled | App startup command (gunicorn --bind=0.0.0.0:8000 --timeout=120 --workers=2 app:app) |
| Controlled | Write APIs using MB-sized chunk writes |
| Independent | Number and size of /fill-home requests |
| Independent | Number and size of /fill-tmp requests |
| Dependent | /home and /tmp used percent |
| Dependent | HTTP status of /fill-home, /fill-tmp, /health |
| Dependent | Console log presence of Errno 28 |
2.6 Expected observation matrix
| Observation point | Expected if true |
|---|---|
Baseline /home | ~0-1% used |
Mid-fill /home | Noticeable increase (single-digit to double-digit %) |
Final /home | ~100% used |
/fill-home response at exhaustion | HTTP 507 + error payload |
/health near exhaustion | HTTP 200 |
| Console logs | No space left on device lines |
3) Runbook
This runbook maps directly to artifacts in:
labs/no-space-left-on-device/artifacts-sanitized/
3.1 Prerequisites
| Requirement | Command |
|---|---|
| Azure CLI authenticated | az account show |
| Resource group permissions | az group list --output table |
| Bash | bash --version |
| jq (recommended) | jq --version |
3.2 Environment variables
Convention reminder:
- Documentation uses
$RG,$APP_NAMEnaming style.
Operational shell form:
3.3 Deploy infrastructure
az group create \
  --name "$RG" \
  --location "$LOCATION"

az deployment group create \
  --resource-group "$RG" \
  --template-file "labs/no-space-left-on-device/main.bicep" \
  --parameters "baseName=labnospace"
Resolve app name from deployment outputs or app list:
3.4 Deploy lab app code
az webapp deploy \
  --resource-group "$RG" \
  --name "$APP_NAME" \
  --src-path "labs/no-space-left-on-device/app" \
  --type startup
If your CLI version requires explicit ZIP packaging for directory deploy, package and deploy with ZIP:
python3 -m zipfile -c "/tmp/no-space-lab.zip" "labs/no-space-left-on-device/app"

az webapp deploy \
  --resource-group "$RG" \
  --name "$APP_NAME" \
  --src-path "/tmp/no-space-lab.zip" \
  --type zip
3.5 Resolve app URL
APP_HOST_NAME=$(az webapp show \
  --resource-group "$RG" \
  --name "$APP_NAME" \
  --query "defaultHostName" \
  --output tsv)

APP_URL="https://$APP_HOST_NAME"
3.6 Baseline checks
curl --silent --show-error "$APP_URL/health"
curl --silent --show-error "$APP_URL/disk-status"
curl --silent --show-error "$APP_URL/diag/disk"
curl --silent --show-error "$APP_URL/diag/stats"
Artifact-backed baseline /disk-status value:
{"home":{"free_bytes":10680426496,"path":"/home/site/wwwroot/temp","total_bytes":10737418240,"used_bytes":56991744,"used_percent":0.53},"status":"ok","tmp":{"free_bytes":15628582912,"path":"/tmp/no-space-lab","total_bytes":36670308352,"used_bytes":21024948224,"used_percent":57.34}}
3.7 Trigger moderate fill (scripted)
The script performs:
- Baseline
/disk-status. 8 x/fill-home?size_mb=100.5 x/fill-tmp?size_mb=100.- Post-fill
/disk-status. /healthprobe.
3.8 Trigger aggressive /home fill (manual)
To reproduce the 500 MB chunk behavior seen in artifacts:
for chunk_index in $(seq 1 11); do
  curl \
    --silent \
    --show-error \
    "$APP_URL/fill-home?size_mb=500"
  printf "\n"
done
Expected sequence from artifacts:
- Chunks 1-10:
status=written - Chunk 11:
status=error,Errno 28
3.9 Verify final disk state
Artifact-backed final /disk-status:
{"home":{"free_bytes":0,"path":"/home/site/wwwroot/temp","total_bytes":10737418240,"used_bytes":10737418240,"used_percent":100.0},"status":"ok","tmp":{"free_bytes":15103889408,"path":"/tmp/no-space-lab","total_bytes":36670308352,"used_bytes":21549641728,"used_percent":58.77}}
3.10 Confirm health behavior under disk exhaustion
Expected from artifacts:
3.11 KQL queries for evidence capture
Portal view: Log stream (live ENOSPC tail)
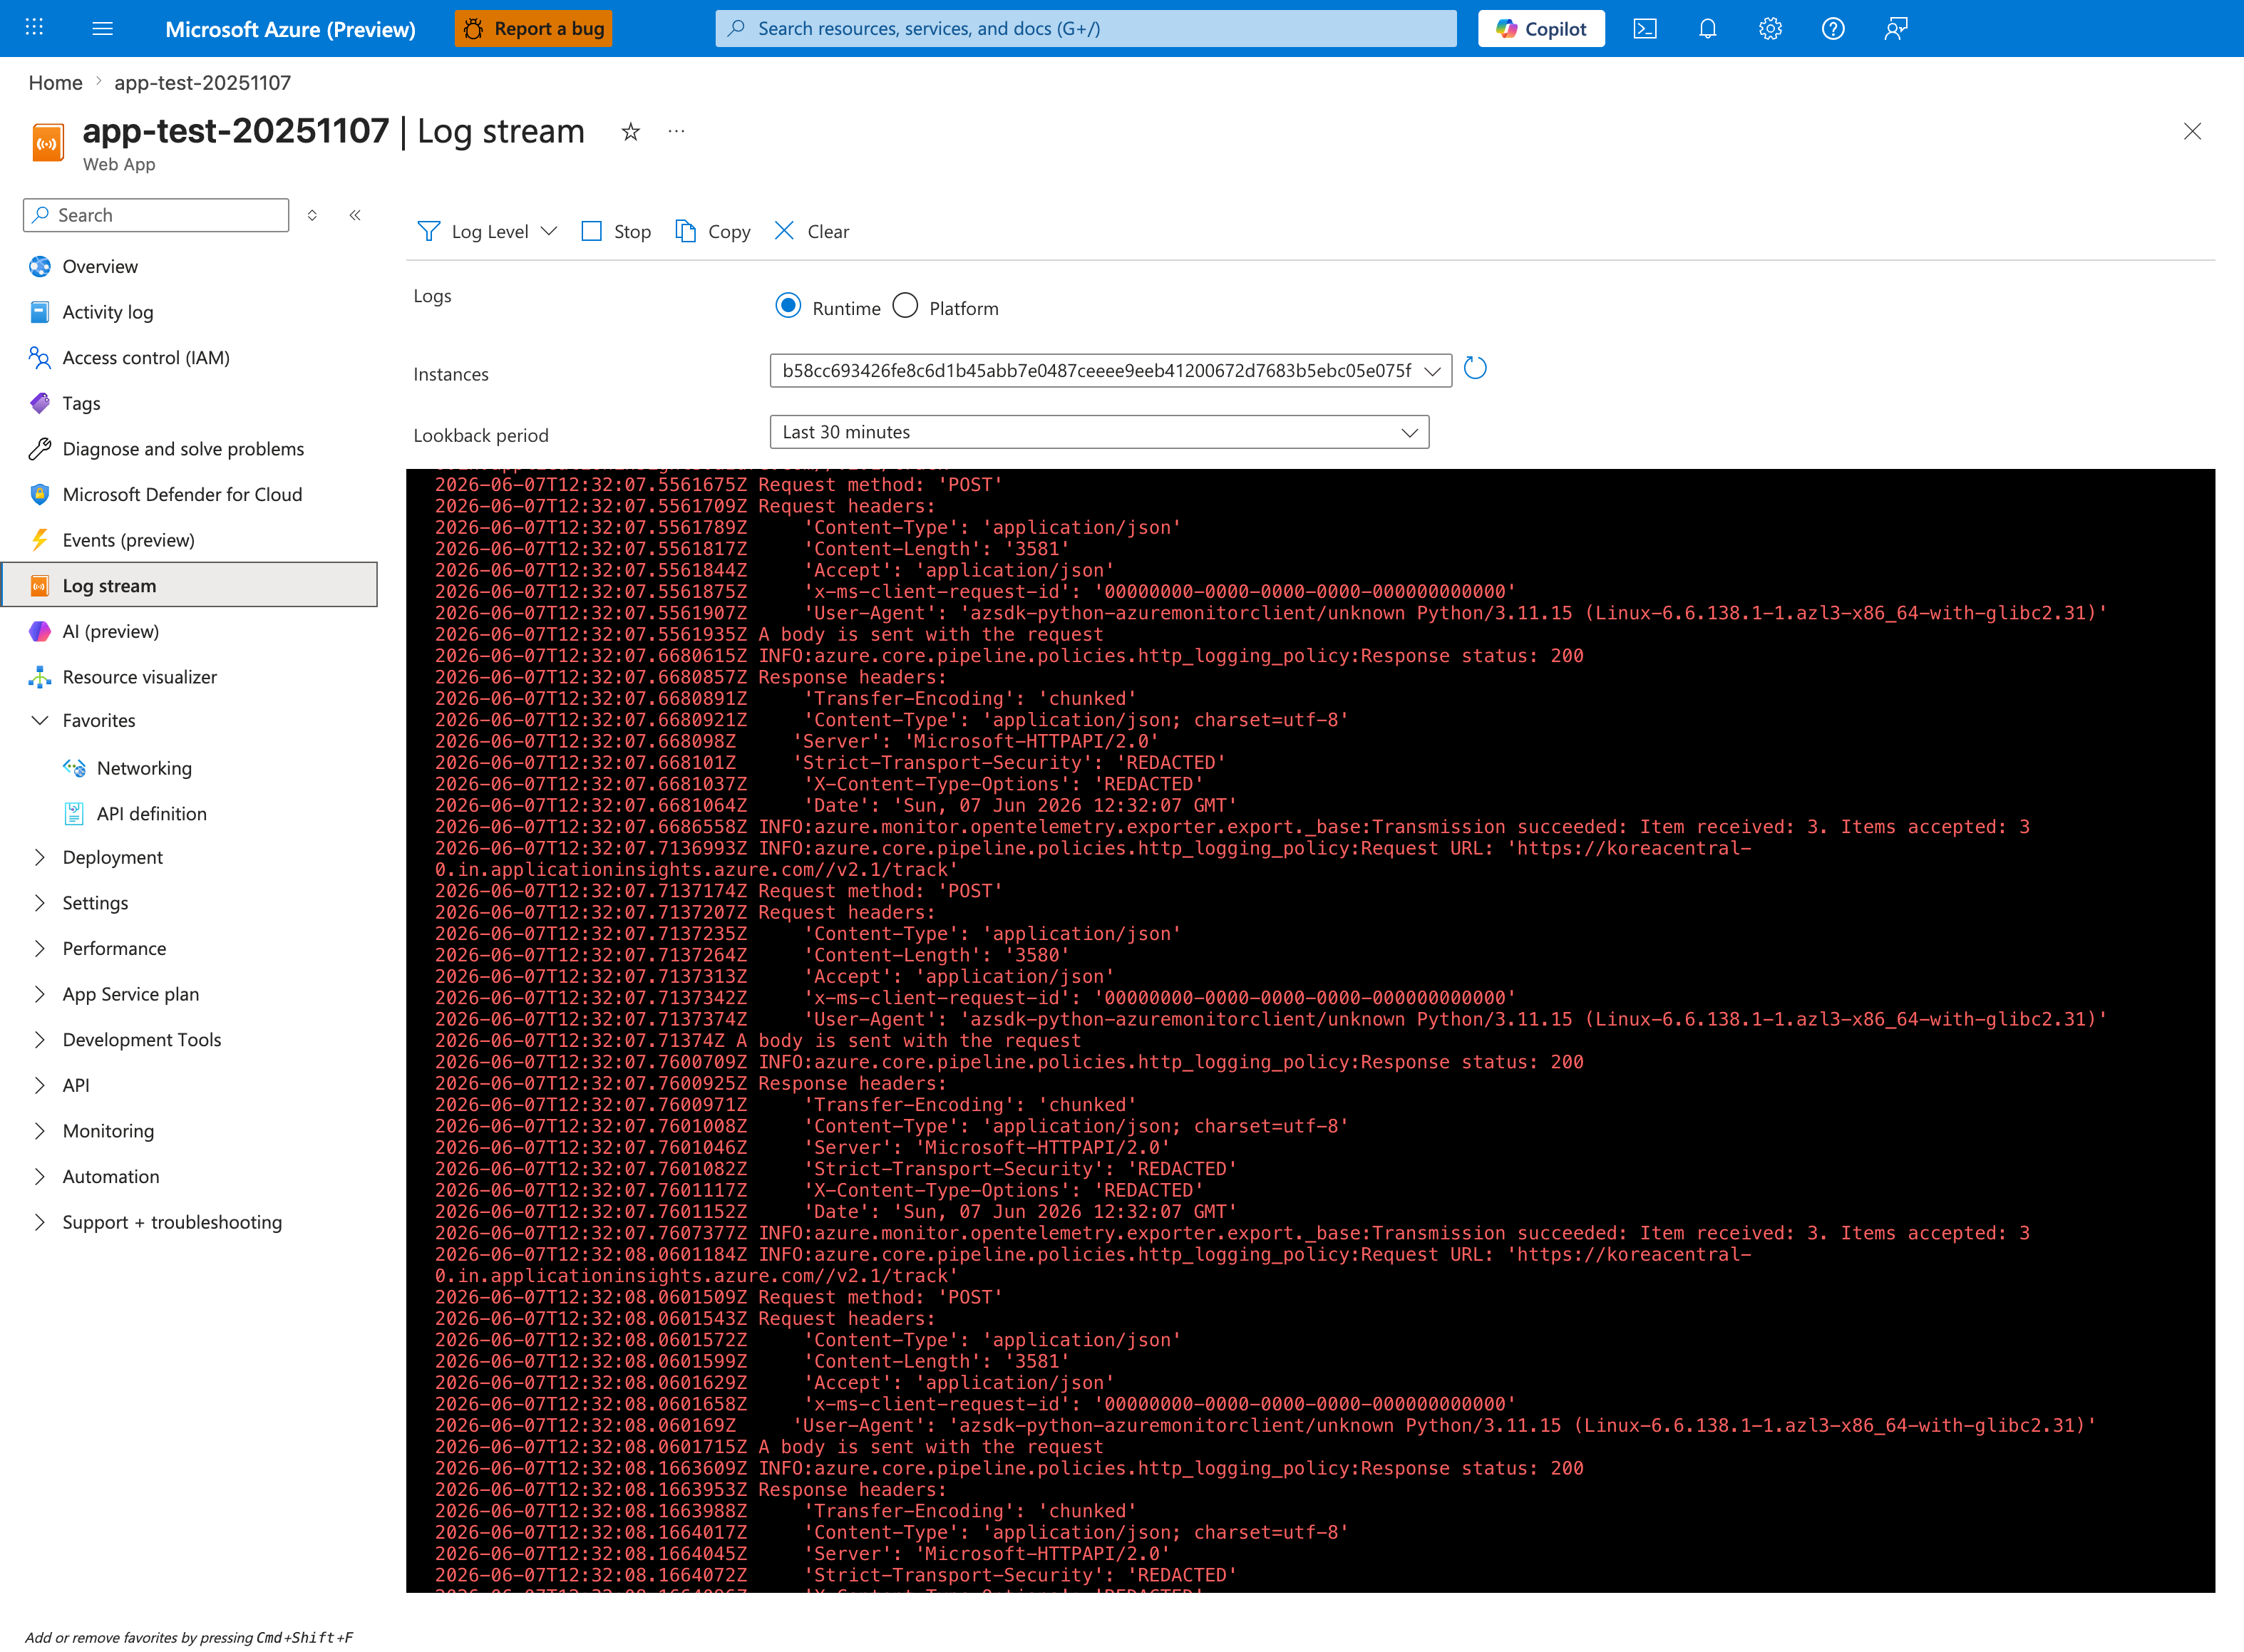
The Log stream blade is the live counterpart to the KQL queries below - it streams the same Python/Gunicorn STDOUT/STDERR that lands in AppServiceConsoleLogs minutes later, with no ingestion delay. In this capture the Runtime radio is selected and the Instances dropdown is pinned to a single worker hash (b58cc693...), which is the correct posture for catching write-side errors on one instance without log interleaving. The streaming pane currently shows healthy OpenTelemetry exporter POSTs to applicationinsights.azure.com/v2.1/track with Response status 200 - the same pane will surface ENOSPC / No space left on device lines the instant the kernel emits them after you run the /fill-home trigger from section 3.7 or 3.8. Use the Stop / Clear toolbar to capture a clean tail, then switch to the queries below for after-the-fact analysis and 507 status correlation.
HTTP outcomes
AppServiceHTTPLogs
| where TimeGenerated > ago(6h)
| where CsUriStem in ("/fill-home", "/fill-tmp", "/health", "/disk-status", "/diag/disk")
| project TimeGenerated, CsUriStem, ScStatus, TimeTaken, CsHost
| order by TimeGenerated desc
Console ENOSPC signatures
AppServiceConsoleLogs
| where TimeGenerated > ago(6h)
| where ResultDescription has_any ("No space left on device", "ENOSPC", "Errno 28")
| project TimeGenerated, ResultDescription
| order by TimeGenerated desc
Platform activity context
AppServicePlatformLogs
| where TimeGenerated > ago(6h)
| where Message has_any ("Starting container", "stopped", "Container did not start")
| project TimeGenerated, Level, Message
| order by TimeGenerated desc
3.12 Recovery actions
For rapid remediation after reproduction:
Operational options in real incidents:
- Delete stale files under
/home. - Move temp write patterns from
/hometo/tmpwhere appropriate. - Stream data to external durable storage (Blob Storage) instead of local disk.
- Add app-level write guards and quota telemetry alerts.
4) Experiment Log
All findings in this section come from:
labs/no-space-left-on-device/artifacts-sanitized/
4.1 Artifact inventory summary
This is one of the richest labs in the repository, with many phase snapshots and per-request payload captures.
| Category | Example files | Purpose |
|---|---|---|
| Baseline | baseline/diag-stats.json | Startup counters before pressure |
| Baseline | baseline/diag-disk.json | Filesystem baseline |
| Baseline | baseline/disk-status.json | Endpoint-level baseline |
| Trigger | trigger/fill-home-*.json | 100 MB write sequence |
| Trigger | trigger/fill-home-big-*.json | 200 MB write sequence |
| Trigger | trigger/fill-home-500mb-*.json | 500 MB aggressive sequence |
| Trigger | trigger/fill-tmp-*.json | /tmp write sequence |
| Trigger | trigger/diag-disk-midfill-*.json | Midpoint disk state |
| Trigger | trigger/diag-disk-after-*.json | Post moderate fill state |
| Trigger | trigger/diag-disk-aggressive-*.json | During aggressive fill |
| Trigger | trigger/diag-disk-final-*.json | Near exhausted final state |
| Trigger | trigger/kql-http-*.json | HTTP status evidence |
| Trigger | trigger/kql-console-*.json | ENOSPC console proof |
| Trigger | trigger/kql-platform-*.json | Platform context logs |
4.2 Baseline state
4.2.1 Baseline runtime counters
File: baseline/diag-stats.json
{"endpoint_counters":{"<unknown>":1,"index":2},"pid":1898,"process_start_time":"2026-04-04T05:30:21.367012+00:00","request_count":4,"total_bytes_written":0,"uptime_seconds":169.694}
Initial interpretation:
- Process healthy and serving.
- No write payload generated yet.
4.2.2 Baseline disk usage snapshot
File: baseline/disk-status.json
| Path key | total_bytes | used_bytes | free_bytes | used_percent |
|---|---|---|---|---|
home (/home/site/wwwroot/temp) | 10737418240 | 56991744 | 10680426496 | 0.53 |
tmp (/tmp/no-space-lab) | 36670308352 | 21024948224 | 15628582912 | 57.34 |
Important baseline fact:
/homestarts almost empty.
4.2.3 Baseline extended diagnostics
File: baseline/diag-disk.json
Key values:
| Mount | total_bytes | used_percent |
|---|---|---|
/home | 10737418240 | 0.53 |
/home/site/wwwroot | 10737418240 | 0.53 |
/tmp | 36670308352 | 57.34 |
/ | 36670308352 | 57.34 |
4.3 Moderate fill phase (8 x 100 MB home + 5 x 100 MB tmp)
4.3.1 Before and after endpoint snapshots
Before (disk-status-before-20260404T053504Z.json):
| Path | used_percent | free_bytes |
|---|---|---|
/home/site/wwwroot/temp | 0.53 | 10680426496 |
/tmp/no-space-lab | 57.34 | 15628578816 |
After (disk-status-after-20260404T053504Z.json):
| Path | used_percent | free_bytes |
|---|---|---|
/home/site/wwwroot/temp | 8.34 | 9841557504 |
/tmp/no-space-lab | 58.76 | 15104290816 |
Observation:
- Moderate fill increases
/homeusage, but still far from quota limit.
4.3.2 Midfill diagnostic snapshot
File: diag-disk-midfill-20260404T053504Z.json
| Path | used_percent | free_bytes |
|---|---|---|
/home | 8.58 | 9816391680 |
/tmp | 57.34 | 15628578816 |
4.4 Aggressive fill phase details
The aggressive phase combines multiple series:
- 20 writes of 200 MB (
fill-home-big-*) = 4,000 MB - 11 writes of 500 MB (
fill-home-500mb-*) where chunk 11 fails
Additionally, earlier 100 MB sequences are present.
4.4.1 Aggregate write statistics from artifacts
Computed from sanitized trigger files:
| Prefix | Files | Success | Error | Total written MB |
|---|---|---|---|---|
fill-home-*.json (all home series combined) | 39 | 38 | 1 | 9800 |
fill-home-big-*.json | 20 | 20 | 0 | 4000 |
fill-home-500mb-*.json | 11 | 10 | 1 | 5000 |
fill-tmp-*.json | 5 | 5 | 0 | 500 |
Critical error file:
fill-home-500mb-11-20260404T055739Z.json
Payload:
4.4.2 500 MB chunk series timeline
| Chunk | Artifact | Status | requested_mb | written_bytes | Notes |
|---|---|---|---|---|---|
| 1 | fill-home-500mb-1-20260404T055739Z.json | written | 500 | 524288000 | success |
| 2 | fill-home-500mb-2-20260404T055739Z.json | written | 500 | 524288000 | success |
| 3 | fill-home-500mb-3-20260404T055739Z.json | written | 500 | 524288000 | success |
| 4 | fill-home-500mb-4-20260404T055739Z.json | written | 500 | 524288000 | success |
| 5 | fill-home-500mb-5-20260404T055739Z.json | written | 500 | 524288000 | success |
| 6 | fill-home-500mb-6-20260404T055739Z.json | written | 500 | 524288000 | success |
| 7 | fill-home-500mb-7-20260404T055739Z.json | written | 500 | 524288000 | success |
| 8 | fill-home-500mb-8-20260404T055739Z.json | written | 500 | 524288000 | success |
| 9 | fill-home-500mb-9-20260404T055739Z.json | written | 500 | 524288000 | success |
| 10 | fill-home-500mb-10-20260404T055739Z.json | written | 500 | 524288000 | success |
| 11 | fill-home-500mb-11-20260404T055739Z.json | error | 500 | n/a | Errno 28 |
This is direct proof of quota edge behavior.
4.5 Disk state progression
4.5.1 Key snapshots table
| Snapshot file | /home used_percent | /home free_bytes | /tmp used_percent | /tmp free_bytes |
|---|---|---|---|---|
baseline/diag-disk.json | 0.53 | 10680430592 | 57.34 | 15628587008 |
trigger/diag-disk-midfill-20260404T053504Z.json | 8.58 | 9816391680 | 57.34 | 15628578816 |
trigger/diag-disk-after-20260404T053504Z.json | 8.34 | 9841557504 | 58.76 | 15104290816 |
trigger/diag-disk-aggressive-20260404T055432Z.json | 47.41 | 5647134720 | 58.77 | 15103889408 |
trigger/diag-disk-final-20260404T055739Z.json | 99.98 | 1691648 | 58.77 | 15103889408 |
trigger/disk-status-final-20260404T055739Z.json | 100.00 | 0 | 58.77 | 15103889408 |
Key insight:
/tmpremained with substantial free bytes, while/homeexhausted to zero.
4.6 HTTP telemetry evidence
Artifact: trigger/kql-http-20260404T060610Z.json
Summary status counts:
| Status | Count |
|---|---|
| 200 | 79 |
| 507 | 1 |
| 202 | 4 |
| 503 | 3 |
Representative rows:
| TimeGenerated (UTC) | Path | Status | TimeTaken(ms) |
|---|---|---|---|
| 2026-04-04T05:59:56.645602Z | /health | 200 | 4 |
| 2026-04-04T05:59:53.502472Z | /fill-home | 507 | 9658 |
| 2026-04-04T05:59:42.94003Z | /fill-home | 200 | 11435 |
| 2026-04-04T05:58:16.855703Z | /fill-home | 200 | 11978 |
| 2026-04-04T05:56:10.183689Z | /fill-home | 200 | 5002 |
Interpretation:
- Write endpoint failure appears as 507 at quota edge.
- Health endpoint still returns 200.
4.7 Console telemetry evidence
Artifact: trigger/kql-console-20260404T060610Z.json
Rows containing ENOSPC indicators:
| TimeGenerated (UTC) | ResultDescription excerpt |
|---|---|
| 2026-04-04T05:59:53.5240524Z | OSError: [Errno 28] No space left on device |
| 2026-04-04T05:59:53.4968911Z | fill-home failed with disk error: [Errno 28] No space left on device |
This confirms application-level exception path, not only HTTP status symptom.
4.8 Platform telemetry context
Artifact: trigger/kql-platform-20260404T060610Z.json
Representative rows include startup and stop events, plus timeout history strings.
Important for this lab:
- Platform logs provide lifecycle context.
- Root-cause storage evidence still comes from app and console layers.
4.9 App config and startup context
Artifact: baseline/app-config.json
Key field:
Meaning:
- Startup command is valid.
- This incident is not module-resolution failure.
- Failure is induced by storage pressure from write endpoints.
4.10 Health vs write behavior proof table
| Checkpoint | /health | /fill-home | /home free bytes | Conclusion |
|---|---|---|---|---|
| Baseline | 200 | 200 | ~10.68 GB | Normal |
| Moderate fill | 200 | 200 | ~9.84 GB | Degraded capacity only |
| Aggressive pre-edge | 200 | 200 | decreasing rapidly | Risk zone |
| Quota edge | 200 | 507 (Errno 28) | 0 to ~1.6 MB | Partial outage |
4.11 Timeline reconstruction
| Approx UTC | Event | Evidence |
|---|---|---|
| 05:30 | Process started | process_start_time in baseline stats |
| 05:35 | Baseline disk snapshot | disk-status-before-* |
| 05:35 | 8x100MB home writes and 5x100MB tmp writes | fill-home-*, fill-tmp-* |
| 05:35 | Mid and post fill diagnostics | diag-disk-midfill-*, diag-disk-after-* |
| 05:54-05:59 | Aggressive home fill with large chunks | fill-home-big-*, fill-home-500mb-* |
| 05:59:53 | ENOSPC logged | KQL console rows |
| 05:59:56 | /health still 200 | KQL HTTP row |
| 05:57+ | Final disk snapshot near 100% home usage | diag-disk-final-*, disk-status-final-* |
4.12 Hypothesis verdict
Verdict: Supported.
Evidence chain:
/homeincreased from ~0.53% to 100% used./fill-homefailed withErrno 28at high utilization.- KQL HTTP captured a 507 for
/fill-home. - KQL console captured explicit
No space left on device. /healthremained 200 during the failure window.
4.13 Operational recommendations from this experiment
-
Add dedicated synthetic probes for write paths, not only
/health. -
Alert on
/homefree space thresholds (for example <15%, <5%). - Store large generated files outside local persistent quota when possible.
- Implement app-level graceful fallback on
OSErrorfor disk writes. - Add periodic cleanup jobs for temporary artifacts in
/home.
4.14 Suggested SLO instrumentation
| Signal class | Metric candidate | Trigger suggestion |
|---|---|---|
| Storage capacity | /home used_percent | Warn at 85%, critical at 95% |
| Write operation success | % successful /fill-home (or business write endpoint) | Alert on sustained non-2xx |
| Exception telemetry | Errno 28 log count | Alert if >0 in rolling 5 minutes |
| Availability | /health status | Keep as coarse availability, not full correctness |
4.15 Reusable KQL snippets
4.15.1 ENOSPC in console
AppServiceConsoleLogs
| where TimeGenerated > ago(24h)
| where ResultDescription has_any (
    "No space left on device",
    "ENOSPC",
    "Errno 28"
)
| project TimeGenerated, ResultDescription
| order by TimeGenerated desc
4.15.2 HTTP write failure profile
AppServiceHTTPLogs
| where TimeGenerated > ago(24h)
| where CsUriStem in ("/fill-home", "/fill-tmp", "/health")
| summarize count() by CsUriStem, ScStatus
| order by CsUriStem asc, ScStatus asc
4.15.3 Disk pressure and endpoint latency
AppServiceHTTPLogs
| where TimeGenerated > ago(24h)
| where CsUriStem in ("/fill-home", "/health")
| summarize
    requests=count(),
    avg_time_ms=avg(TimeTaken),
    p95_time_ms=percentile(TimeTaken, 95)
  by CsUriStem, ScStatus
| order by CsUriStem asc, ScStatus asc
4.16 Known limitations of this experiment
-
Synthetic workload writes deterministic binary payloads, not production data patterns.
-
Timing and status distributions are specific to this run and SKU.
-
/tmpwas not driven to exhaustion in this dataset, so/tmpENOSPC behavior is inferred from architecture and app logic, not observed as terminal failure in this run. -
Platform logs include startup lifecycle noise; root-cause proof relied on app and console evidence.
4.17 Experiment closure statement
This experiment demonstrates a production-relevant anti-pattern:
Green health checks can coexist with failed business writes under persistent storage exhaustion.
Therefore, incident playbooks must include storage-aware functional probes and log correlation, not only endpoint-level liveness.
Expected Evidence
This section defines what you SHOULD observe at each phase of the lab. Use it to validate your investigation is on track.
Before Trigger (Baseline)
| Evidence Source | Expected State | What to Capture |
|---|---|---|
| AppServiceHTTPLogs | All 200s with low latency | Baseline query snapshot for /health, /disk-status, and diagnostics |
| AppServiceConsoleLogs | Normal Gunicorn startup | Worker startup lines and no Errno 28 entries |
| AppServicePlatformLogs | Normal site lifecycle events | Site start records without storage-related restarts |
/disk-status | Low persistent and tmp utilization | Baseline /home and /tmp usage percentages |
During Incident
| Evidence Source | Expected State | Key Indicator |
|---|---|---|
/fill-home + /fill-tmp responses | 100 MB write operations complete but slow | Fill operations show TimeTaken in 6131-11360 ms range |
/disk-status | Utilization rises measurably | /home 5.65% used and /tmp 58.76% used in captured phase |
| AppServiceHTTPLogs | Mixed healthy and write-stress behavior | /health stays 200 while fill endpoints absorb write cost |
| Console logs | Disk-write pressure signatures appear as usage grows | Watch for No space left on device when threshold is crossed |
After Recovery
| Evidence Source | Expected State | Key Indicator |
|---|---|---|
/disk-status and app behavior | Files remain until explicit cleanup or recycle | Persistent files under /home continue consuming quota |
| Restart behavior | /tmp clears on restart, /home persists | Confirms ephemeral vs persistent storage semantics |
| AppServiceHTTPLogs | Health endpoint may remain 200 through partial degradation | Availability checks alone can miss storage incidents |
| Operational remediation | Manual cleanup required for persistent path | Use /cleanup or file removal workflow to reclaim /home |
Evidence Timeline
graph TD
    A[Baseline Capture] --> B[Trigger Fault]
    B --> C[During: Collect Evidence]
    C --> D[After: Compare to Baseline]
    D --> E[Verdict: Confirmed/Falsified]
Evidence Chain: Why This Proves the Hypothesis
Falsification Logic
If you observe rising /home and /tmp usage during fill operations, slower write endpoints, and persistence differences after restart (/tmp clears, /home persists), the hypothesis is CONFIRMED because the incident is storage-surface behavior, not generic app unavailability.
If you do NOT observe usage growth or persistence differences across restart boundaries, the hypothesis is FALSIFIED — consider non-storage latency sources or incorrect write-path targeting.
Clean Up
Related Playbook
See Also
- Playbook: No Space Left on Device / Ephemeral Storage Pressure
- Playbook: Memory Pressure and Worker Degradation
- Lab: Memory Pressure
- Lab: Slow Start / Cold Start