Lab: Memory Pressure and Worker Degradation
This lab reproduces memory pressure behavior on Azure App Service (Linux, B1) using a Python Flask app that intentionally grows heap allocations (/leak) and triggers CPU/memory-intensive work (/heavy).
The goal is not only to "cause load," but to understand the full chain from user traffic to Gunicorn process behavior to Linux memory reclaim and App Service platform signals.
graph TD
    A[Deploy B1 Linux App Service] --> B[Deploy Flask memory-lab app]
    B --> C[Trigger /leak 100x]
    C --> D[Trigger /heavy burst]
    D --> E[Capture /diag/stats and /diag/proc]
    E --> F[Query AppServiceHTTPLogs AppServiceConsoleLogs AppServicePlatformLogs]
    F --> G[Compare against falsifiable hypothesis]
Lab Metadata
| Field | Value |
|---|---|
| Lab name | memory-pressure |
| Platform | Azure App Service (Linux, B1) |
| Runtime | Python 3.11 + Gunicorn |
| App path | labs/memory-pressure/app |
| Trigger script | labs/memory-pressure/trigger.sh |
| Artifact root | labs/memory-pressure/artifacts-sanitized/ |
| Focus | Memory pressure and worker degradation under leak + heavy workload |
| Expected anti-pattern | Retained heap growth with constrained memory headroom across multiple sync workers |
| Expected symptom family | Low MemAvailable, reclaim/swap growth, latency tail expansion before potential hard failures |
What this lab demonstrates
This run captured strong memory pressure signals and reclaim activity, but did not produce 5xx during the observed window.
That is still valuable troubleshooting evidence: you can prove a memory-stress mechanism is active before user-visible failure occurs.
1) Background
1.1 Why this failure mode happens
Memory-pressure incidents in App Service are usually multi-layer issues:
- Application layer allocates memory over time (intentional leak in this lab).
- Worker process layer (Gunicorn) competes for RSS across multiple workers.
- Linux kernel layer starts reclaim/scanning under pressure.
- Platform layer may still report mostly healthy requests until pressure crosses a tipping point.
In short: rising memory pressure can be present long before obvious 5xx appears.
1.2 App Service Linux execution model in this lab
From the deployed app configuration artifact:
| Setting | Value (artifact) | Impact |
|---|---|---|
linuxFxVersion | PYTHON|3.11 | Linux Python runtime image |
appCommandLine | gunicorn --bind=0.0.0.0 --timeout=120 --workers=4 app:app | Four sync workers share limited memory |
alwaysOn | false | Worker can cold-start, not central to this test |
numberOfWorkers | 1 | Single App Service instance |
Because B1 is constrained and this app uses --workers=4, memory fragmentation and worker-level RSS contention become visible faster under leak growth.
1.3 Failure progression model
flowchart TD
    A[/leak requests append large lists/] --> B[Per-worker RSS rises]
    B --> C[MemAvailable drops]
    C --> D[Kernel reclaim intensifies]
    D --> E[pgscan and allocstall counters rise]
    E --> F[Latency volatility increases]
    F --> G{Further pressure?}
    G -->|Yes| H[Worker timeout or recycle risk]
    G -->|No| I[Temporary steady state]

    style A fill:#1565c0,color:#fff
    style C fill:#ef6c00,color:#fff
    style D fill:#c62828,color:#fff
    style H fill:#b71c1c,color:#fff
    style I fill:#2e7d32,color:#fff
1.4 Request path and where memory accumulates
sequenceDiagram
    participant Client
    participant FrontEnd as App Service Front End
    participant Worker as Linux Worker
    participant Gunicorn as Gunicorn Master/Workers
    participant Flask as Flask App
    participant Kernel as Linux Kernel

    Client->>FrontEnd: HTTPS request /leak
    FrontEnd->>Worker: Route request
    Worker->>Gunicorn: Dispatch to sync worker
    Gunicorn->>Flask: Execute leak() (allocate list)
    Flask-->>Gunicorn: JSON 200 with block count
    Gunicorn-->>Worker: Response
    Worker-->>FrontEnd: Response
    FrontEnd-->>Client: 200 OK
    Note over Kernel: MemAvailable drops, reclaim activity rises
1.5 Why /leak + /heavy is a useful pair
/leakstresses persistent memory growth (retained list inLEAK_BUCKET)./heavystresses CPU + transient allocations (500k list creation + sort).- Combined workload reveals whether the system is:
- still handling requests,
- but already paying increasing reclaim cost.
1.6 Signals used in this lab
| Signal Source | Endpoint / Table | What it indicates |
|---|---|---|
| App self-observation | /diag/stats | request count, leak block count, endpoint distribution |
| OS memory and reclaim | /diag/proc | meminfo, vmstat, pressure_memory, loadavg |
| HTTP pipeline | AppServiceHTTPLogs | status code, endpoint, server-side TimeTaken |
| App console | AppServiceConsoleLogs | runtime warnings/timeouts (none in this run) |
| Platform events | AppServicePlatformLogs | startup/restart/platform lifecycle events |
1.7 Linux counters that matter most here
From the app code (/diag/proc) and artifacts:
| Counter | Meaning | Why it matters |
|---|---|---|
MemAvailable | Est. readily usable memory | Earliest practical low-memory signal |
SwapFree | Available swap | Falling trend shows memory spillover |
pgscan_kswapd | Background page scans | Reclaim pressure intensity |
pgscan_direct | Direct reclaim scans | Allocation stress spilling into request path |
allocstall_normal / allocstall_movable | Allocation stalls | Thread-level blocking pressure |
pswpin / pswpout | Swap read/write events | Active swap churn |
PSI (some, full) | Stall pressure averages | Direct pressure severity signal |
1.8 Architectural context diagram
graph TD
    subgraph Azure
        FE[App Service Front End]
        W[Linux Worker VM]
        LA[Log Analytics Workspace]
    end

    subgraph SiteContainer[Web App Site Container]
        G[Gunicorn workers=4 timeout=120]
        F[Flask routes /leak /heavy /diag/*]
    end

    FE --> W
    W --> SiteContainer
    F --> G
    SiteContainer --> LA
1.9 Practical troubleshooting interpretation
Memory-pressure troubleshooting should not depend on a single symptom (for example, only 5xx rate).
Use a stacked interpretation:
- Pressure trend (MemAvailable, SwapFree, reclaim counters)
- Latency trend (
TimeTaken, trigger timings) - Error trend (5xx, 499)
- Lifecycle trend (restart/recycle events)
This lab gives a full chain for (1) and (2), with a "no 5xx yet" outcome for (3).
2) Hypothesis
2.1 Falsifiable hypothesis statement
If repeated /leak requests are used to consume memory on a B1 Linux App Service with 4 Gunicorn workers, then:
MemAvailablewill drop materially,- reclaim/swap counters will increase,
- latency variance will rise,
even if HTTP 5xx does not immediately appear.
2.2 Causal chain
/leakappends large lists toLEAK_BUCKET.- Process RSS grows and available memory shrinks.
- Kernel reclaim mechanisms intensify (
pgscan_*, allocstall, swap churn). /heavyruns under less headroom and produces longer tail latency.- Platform may still return mostly HTTP 200 during this intermediate state.
flowchart TD
    A[/leak accumulation/] --> B[Low headroom]
    B --> C[Reclaim and swap activity]
    C --> D[Request latency tail growth]
    D --> E{Observed window}
    E -->|Early| F[No 5xx, risk building]
    E -->|Late| G[Possible timeout/recycle/5xx]
2.3 Proof criteria
All criteria below should be met to support the hypothesis:
| Criterion | Threshold | Artifact Evidence |
|---|---|---|
| Memory headroom collapse | MemAvailable large drop from baseline | baseline vs mid/post /diag/proc |
| Reclaim growth | pgscan_* and allocstall increase | baseline vs mid/post /diag/proc |
| Swap activity growth | pswp* increases and SwapFree decreases | baseline vs mid/post /diag/proc |
| App-level leak progression | leak_block_count grows | /diag/stats mid/post |
| Requests still mostly succeed | HTTP 200 dominant | trigger CSV + KQL HTTP logs |
2.4 Disproof criteria
Any one of the following would weaken/disprove this hypothesis:
MemAvailablestays near baseline despite/leakvolume.- Reclaim counters stay flat while leak count grows.
- Swap does not change at all and no reclaim counters move.
- No measurable latency impact in trigger/KQL while pressure counters remain flat.
2.5 Variables
Independent variables (controlled)
| Variable | Value in this run |
|---|---|
| App plan SKU | B1 Linux |
| Gunicorn worker count | 4 |
| Gunicorn timeout | 120 seconds |
| Leak trigger volume | 100 sequential /leak requests |
| Heavy trigger volume | 50 concurrent /heavy requests (script target) |
Dependent variables (measured)
| Variable | Source |
|---|---|
MemAvailable, SwapFree, vmstat, PSI | /diag/proc artifacts |
leak_block_count, endpoint counters | /diag/stats artifacts |
| Endpoint status and duration | Trigger CSV + AppServiceHTTPLogs export |
| Runtime/platform error records | Console and platform KQL exports |
Controlled conditions
| Control | Value |
|---|---|
| Region | Korea Central |
| Runtime family | Python 3.11 |
| App shape | Same Flask routes and trigger scripts |
| Diagnostics destination | Single Log Analytics workspace |
2.6 Confounders and caveats
- KQL export windows may include extra baseline requests.
- Concurrent requests can be load-balanced across Gunicorn workers; one worker's leak count does not represent all workers.
- The
heavy-responsesartifact format is concatenated in one line; status extraction is still possible, and KQL cross-check is used for latency analysis.
Interpretation boundary
This run demonstrates active memory stress and reclaim but not final outage.
Treat this as a pre-failure signature reference, not a complete outage profile.
3) Runbook
3.1 Prerequisite checks
Use these commands before deployment.
Expected checks:
- Azure CLI installed and authenticated
- Bicep available via Azure CLI
- Correct subscription context selected
3.2 Set standard variables
Use repository variable conventions.
export RG="rg-lab-memory"
export LOCATION="koreacentral"
export BASE_NAME="labmem"
export APP_PACKAGE_PATH="/tmp/memory-pressure-app.zip"
3.3 Create resource group
Example output:
{
  "location": "koreacentral",
  "name": "rg-lab-memory",
  "properties": {
    "provisioningState": "Succeeded"
  }
}
3.4 Deploy the lab infrastructure (actual Bicep path)
az deployment group create \
  --resource-group "$RG" \
  --template-file "labs/memory-pressure/main.bicep" \
  --parameters baseName="$BASE_NAME" location="$LOCATION"
Capture outputs:
export APP_NAME=$(az deployment group show \
  --resource-group "$RG" \
  --name "main" \
  --query "properties.outputs.webAppName.value" \
  --output tsv)

export APP_HOSTNAME=$(az deployment group show \
  --resource-group "$RG" \
  --name "main" \
  --query "properties.outputs.webAppDefaultHostName.value" \
  --output tsv)

export APP_URL="https://${APP_HOSTNAME}"
3.5 Package and deploy the lab app code
cd "labs/memory-pressure/app"
zip --recurse-paths "$APP_PACKAGE_PATH" .

az webapp deploy \
  --resource-group "$RG" \
  --name "$APP_NAME" \
  --src-path "$APP_PACKAGE_PATH" \
  --type zip
Restart app after deployment:
3.6 Verify baseline endpoints
curl --silent "$APP_URL/"
curl --silent "$APP_URL/health"
curl --silent "$APP_URL/diag/stats"
curl --silent "$APP_URL/diag/proc"
Baseline artifact snapshot from this run:
| Artifact | Key values |
|---|---|
baseline/diag-stats.json | request_count=4, leak_block_count=0, pid=1901 |
baseline/diag-proc.json | MemTotal=1955532 kB, MemAvailable=523896 kB, SwapFree=3809772 kB |
baseline/app-config.json | gunicorn --timeout=120 --workers=4 |
3.7 Confirm App Service runtime configuration
Look specifically for:
linuxFxVersionappCommandLinealwaysOnnumberOfWorkers
3.8 Trigger memory pressure (actual trigger script)
Script behavior:
- Sends 100 sequential
/leakrequests. - Sends 50 concurrent
/heavyrequests with max 10 concurrent curl jobs. - Prints 5xx failure counts for each phase.
3.9 Mid-run diagnostic capture
During the leak phase, capture diagnostics:
curl --silent "$APP_URL/diag/stats" > /tmp/memory-mid-diag-stats.json
curl --silent "$APP_URL/diag/proc" > /tmp/memory-mid-diag-proc.json
After heavy phase:
curl --silent "$APP_URL/diag/stats" > /tmp/memory-post-diag-stats.json
curl --silent "$APP_URL/diag/proc" > /tmp/memory-post-diag-proc.json
3.10 Query Log Analytics workspace
Resolve workspace name from deployment output or resource query:
export LOG_WORKSPACE_NAME=$(az deployment group show \
  --resource-group "$RG" \
  --name "main" \
  --query "properties.outputs.logAnalyticsWorkspaceName.value" \
  --output tsv)

export LOG_WORKSPACE_ID=$(az monitor log-analytics workspace show \
  --resource-group "$RG" \
  --workspace-name "$LOG_WORKSPACE_NAME" \
  --query "customerId" \
  --output tsv)
HTTP logs query
az monitor log-analytics query \
  --workspace "$LOG_WORKSPACE_ID" \
  --analytics-query "AppServiceHTTPLogs | where TimeGenerated > ago(2h) | where CsHost has 'app-' | project TimeGenerated, CsUriStem, ScStatus, TimeTaken, CsHost | order by TimeGenerated desc" \
  --output json
Console logs query
az monitor log-analytics query \
  --workspace "$LOG_WORKSPACE_ID" \
  --analytics-query "AppServiceConsoleLogs | where TimeGenerated > ago(2h) | where ResultDescription has_any ('OutOfMemory','OOM','Killed','WORKER TIMEOUT','memory') | project TimeGenerated, ResultDescription | order by TimeGenerated desc" \
  --output json
Platform logs query
az monitor log-analytics query \
  --workspace "$LOG_WORKSPACE_ID" \
  --analytics-query "AppServicePlatformLogs | where TimeGenerated > ago(2h) | project TimeGenerated, Level, Message | order by TimeGenerated desc" \
  --output json
3.11 KQL query snippets for portal use
Portal view: Diagnose and solve problems blade (memory triage entry point)
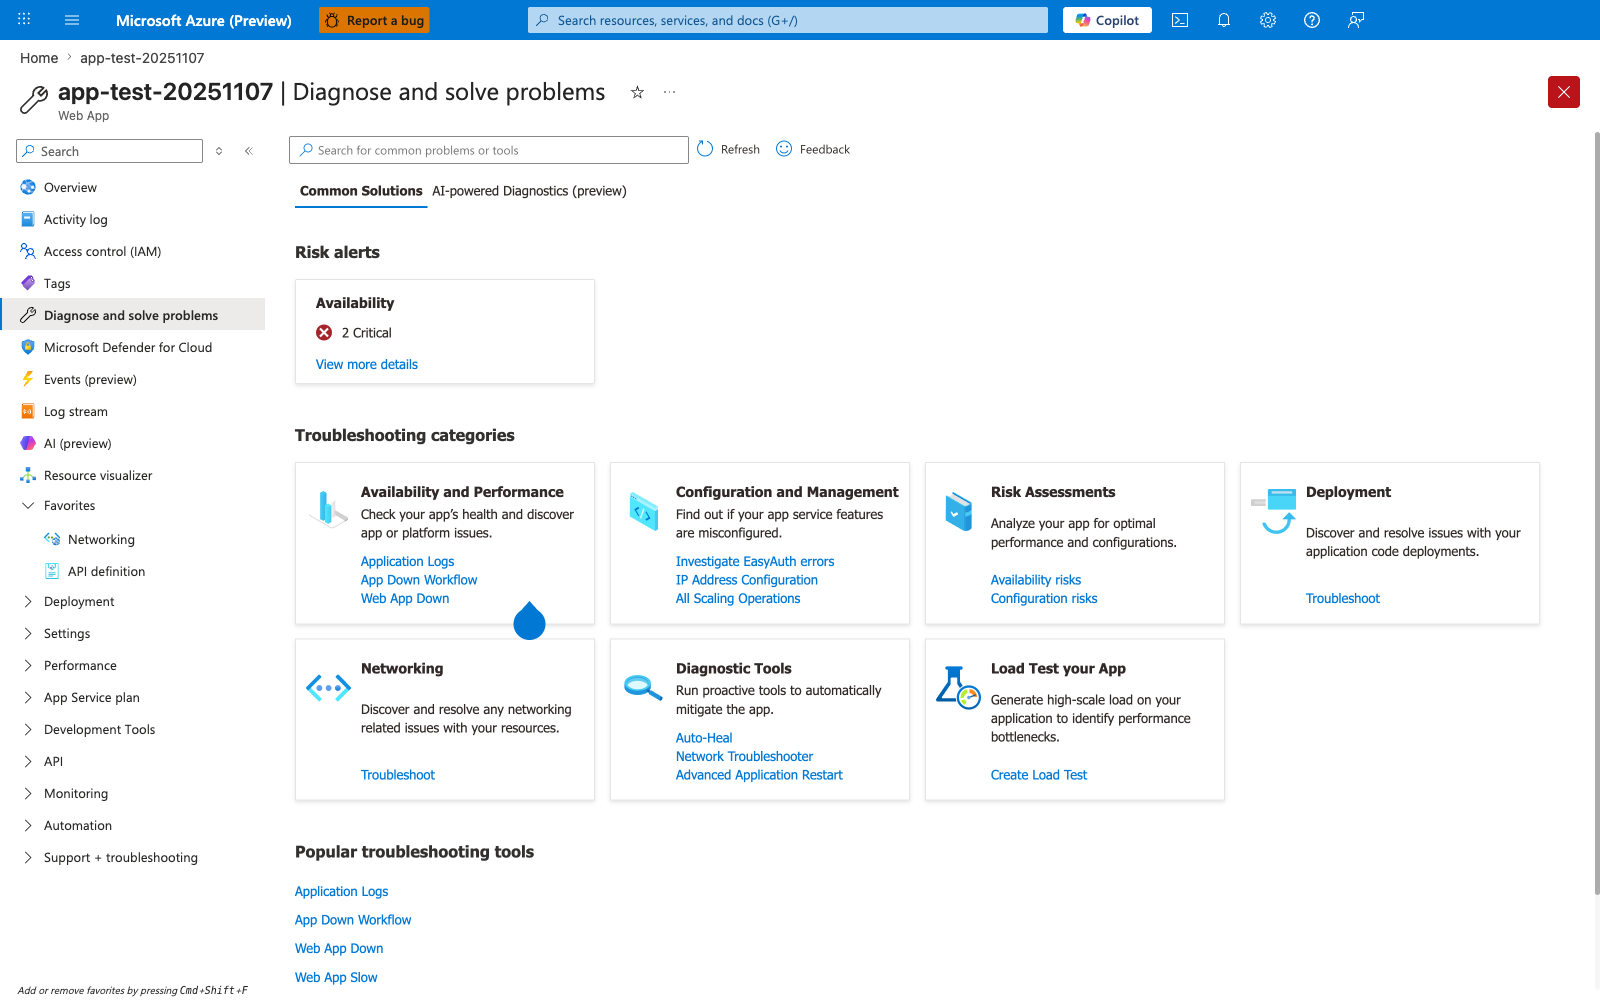
The Diagnose and solve problems blade is the Portal entry point that surfaces App Service's pre-built performance detectors before you reach the metric-by-metric exploration in the Metrics blade embed shown next - the Web App Slow link under Popular troubleshooting tools is a direct quick-access path to a curated detector that App Service correlates from platform-side signals (response times, worker recycles, memory percentages) without requiring you to write the KQL queries shown in section 3.10. The Risk alerts card at the top is the fastest signal that App Service has already flagged your app: in this capture, Availability 2 Critical means the platform's continuous diagnostic engine has detected availability degradation, which often correlates with the worker recycle risk path shown in section 1.3's failure progression diagram. For deeper categorical drill-downs, the Availability and Performance tile leads to detectors organized by symptom (Application Logs, App Down Workflow, Web App Down), and the Diagnostic Tools tile exposes Auto-Heal where you can verify whether memory-based recycle rules are active and matching the worker-recycle predictions in section 1.3. This blade sits one layer above the Metrics blade shown next: use this hub first to confirm the platform agrees a problem exists, then drill into specific MemAvailable and worker-RSS metrics via the chart configuration in the next H4.
Portal view: Metrics blade (memory pressure anchor)
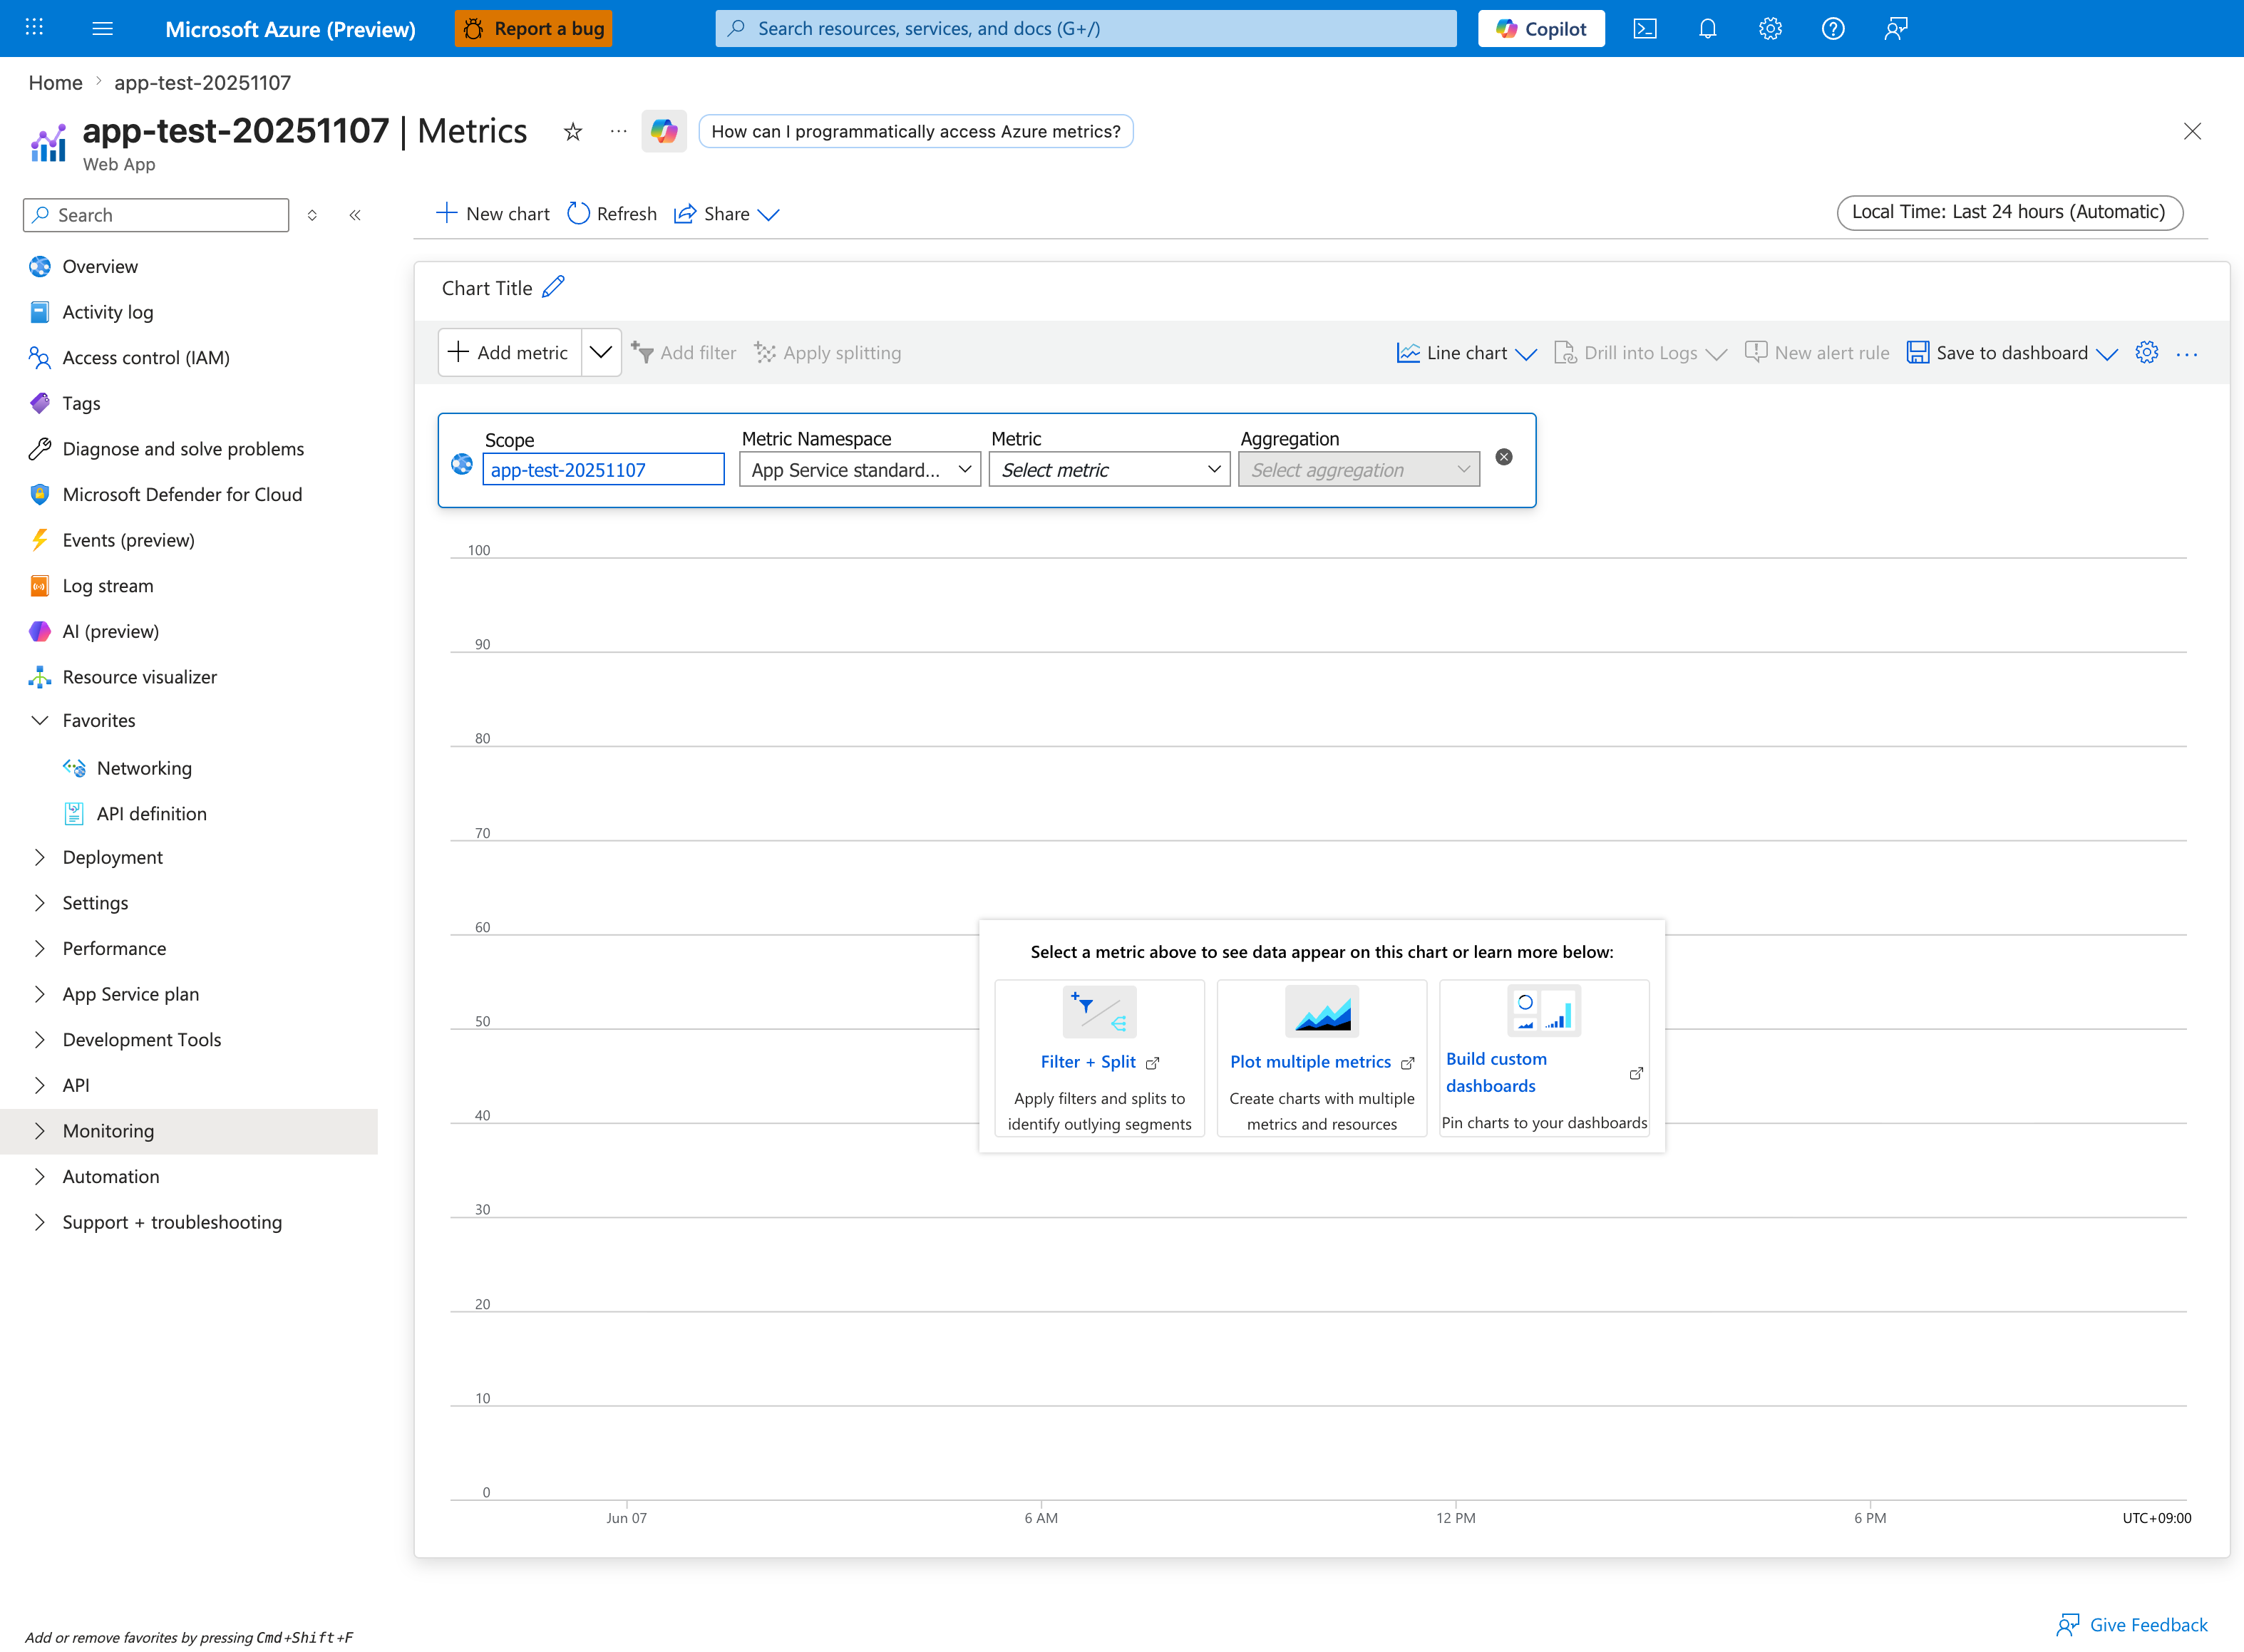
The Metrics blade is the Portal entry point for the memory-pressure KQL queries below. Click Add metric in the chart command bar and choose a memory or response-time signal from the App Service standard metric namespace shown in the configuration row - this surfaces the same dimensions the KQL snippets aggregate from AppServiceHTTPLogs. The Drill into Logs button on the same toolbar pivots from a metric spike directly into a Log Analytics query, which is faster than typing the queries below from scratch. The chart in this capture is empty (no metric selected yet), and the Sample data help cards Filter + Split, Plot multiple metrics, and Build custom dashboards walk you through the standard setup for ongoing memory-pressure monitoring.
AppServiceHTTPLogs
| where TimeGenerated > ago(2h)
| summarize total=count(), errors5xx=countif(ScStatus >= 500) by CsUriStem
| order by total desc
AppServiceHTTPLogs
| where TimeGenerated > ago(2h)
| summarize avgMs=avg(TimeTaken), p95Ms=percentile(TimeTaken, 95), maxMs=max(TimeTaken) by CsUriStem, ScStatus
| order by p95Ms desc
AppServiceConsoleLogs
| where TimeGenerated > ago(2h)
| where ResultDescription has_any ("WORKER TIMEOUT", "OutOfMemory", "OOM", "Killed")
| project TimeGenerated, ResultDescription
| order by TimeGenerated desc
AppServicePlatformLogs
| where TimeGenerated > ago(2h)
| project TimeGenerated, Level, Message
| order by TimeGenerated desc
3.12 Verification checklist
Use this checklist to determine whether the lab produced useful memory-pressure evidence:
- [ ] Leak endpoint count increased significantly.
- [ ]
MemAvailabledropped materially from baseline. - [ ]
pgscan_kswapdand/orpgscan_directincreased. - [ ] Swap counters changed (
SwapFree,pswp*). - [ ] KQL HTTP data shows endpoint timing under pressure.
- [ ] Console/platform logs captured (even if no errors).
3.13 Common execution pitfalls
| Pitfall | Symptom | Fix |
|---|---|---|
| Wrong template path | Deployment fails | Use labs/memory-pressure/main.bicep |
| App not deployed | /leak returns 404 | Re-run az webapp deploy and restart |
| Workspace query empty | No logs returned | Confirm diagnostic settings attached to web app |
| Trigger URL includes trailing slash mismatch | malformed URL | Script already normalizes trailing slash |
3.14 Runbook decision tree
flowchart TD
    A[Run trigger.sh] --> B{Did /leak and /heavy return 200 mostly?}
    B -->|No| C[Investigate immediate app/runtime issue]
    B -->|Yes| D[Collect /diag/proc snapshots]
    D --> E{Did MemAvailable drop and vmstat rise?}
    E -->|No| F[Pressure not reproduced, increase trigger or validate deploy]
    E -->|Yes| G[Query HTTP/Console/Platform logs]
    G --> H[Record experiment log and verdict]
4) Experiment Log
4.1 Artifact inventory used
All values below are taken directly from sanitized artifacts:
labs/memory-pressure/artifacts-sanitized/
| Category | Files used |
|---|---|
| Baseline | baseline/diag-stats.json, baseline/diag-proc.json, baseline/app-config.json |
| Trigger responses | trigger/leak-responses-20260404T053438Z.csv, trigger/heavy-responses-20260404T053438Z.csv |
| Mid/Post diagnostics | trigger/diag-stats-midleak-20260404T053438Z.json, trigger/diag-proc-midleak-20260404T053438Z.json, trigger/diag-stats-postheavy-20260404T053438Z.json, trigger/diag-proc-postheavy-20260404T053438Z.json |
| KQL exports | trigger/kql-http-20260404T060610Z.json, trigger/kql-console-20260404T060610Z.json, trigger/kql-platform-20260404T060610Z.json |
4.2 Baseline measurements
From baseline/diag-proc.json and baseline/diag-stats.json:
| Metric | Baseline value |
|---|---|
MemTotal | 1955532 kB |
MemFree | 102240 kB |
MemAvailable | 523896 kB |
Cached | 486820 kB |
SwapTotal | 4194300 kB |
SwapFree | 3809772 kB |
pgscan_kswapd | 6114788 |
pgscan_direct | 214825 |
pgsteal_kswapd | 2839945 |
pswpin | 163021 |
pswpout | 223248 |
allocstall_normal | 1122 |
allocstall_movable | 867 |
| PSI some | avg10=0.02 avg60=0.72 avg300=0.69 |
| PSI full | avg10=0.01 avg60=0.58 avg300=0.56 |
| Load average | 0.10 0.20 0.35 3/751 1941 |
App request_count | 4 |
App leak_block_count | 0 |
4.3 Mid-leak snapshot
From trigger/diag-proc-midleak-20260404T053438Z.json and trigger/diag-stats-midleak-20260404T053438Z.json:
| Metric | Mid-leak value |
|---|---|
MemFree | 35660 kB |
MemAvailable | 44760 kB |
Cached | 160384 kB |
SwapFree | 2459256 kB |
pgscan_kswapd | 7789786 |
pgscan_direct | 544771 |
pgsteal_kswapd | 3466908 |
pswpin | 248242 |
pswpout | 615703 |
allocstall_normal | 1214 |
allocstall_movable | 2195 |
| PSI some | avg10=72.06 avg60=38.69 avg300=11.36 |
| PSI full | avg10=60.77 avg60=33.35 avg300=9.79 |
| Load average | 5.33 1.48 0.75 2/756 1945 |
request_count | 32 |
leak_block_count | 30 |
4.4 Post-heavy snapshot
From trigger/diag-proc-postheavy-20260404T053438Z.json and trigger/diag-stats-postheavy-20260404T053438Z.json:
| Metric | Post-heavy value |
|---|---|
MemFree | 36576 kB |
MemAvailable | 63376 kB |
Cached | 187956 kB |
SwapFree | 2376396 kB |
pgscan_kswapd | 7890915 |
pgscan_direct | 613993 |
pgsteal_kswapd | 3508482 |
pswpin | 274069 |
pswpout | 651775 |
allocstall_normal | 1234 |
allocstall_movable | 2461 |
| PSI some | avg10=59.70 avg60=41.37 avg300=13.06 |
| PSI full | avg10=48.58 avg60=35.00 avg300=11.11 |
| Load average | 6.35 1.83 0.87 1/762 1945 |
request_count | 47 |
leak_block_count | 30 |
heavy endpoint count (single worker) | 14 |
4.5 Delta analysis: baseline → mid-leak
| Metric | Baseline | Mid-leak | Delta | Interpretation |
|---|---|---|---|---|
MemAvailable (kB) | 523,896 | 44,760 | -479,136 | Major headroom collapse |
SwapFree (kB) | 3,809,772 | 2,459,256 | -1,350,516 | Active swap consumption |
pgscan_kswapd | 6,114,788 | 7,789,786 | +1,674,998 | Background reclaim intensified |
pgscan_direct | 214,825 | 544,771 | +329,946 | Direct reclaim pressure rose |
pswpout | 223,248 | 615,703 | +392,455 | Swap-out acceleration |
allocstall_movable | 867 | 2,195 | +1,328 | Allocation stalls increased |
4.6 Delta analysis: baseline → post-heavy
| Metric | Baseline | Post-heavy | Delta | Interpretation |
|---|---|---|---|---|
MemAvailable (kB) | 523,896 | 63,376 | -460,520 | Sustained low headroom |
SwapFree (kB) | 3,809,772 | 2,376,396 | -1,433,376 | Continued swap usage |
pgscan_kswapd | 6,114,788 | 7,890,915 | +1,776,127 | Reclaim still elevated |
pgscan_direct | 214,825 | 613,993 | +399,168 | Direct reclaim remained high |
pswpin | 163,021 | 274,069 | +111,048 | Swap-in activity increased |
pswpout | 223,248 | 651,775 | +428,527 | Swap-out sustained high |
allocstall_movable | 867 | 2,461 | +1,594 | Ongoing allocation pressure |
4.7 Trigger response evidence
Leak phase CSV (100 rows)
From leak-responses-20260404T053438Z.csv:
| Metric | Value |
|---|---|
| Requests | 100 |
| HTTP 5xx | 0 |
| Avg latency (s) | 1.010 |
| p95 latency (s) | 1.784 |
| Max latency (s) | 3.317 |
Sample rows:
| Request | Status | Time (s) |
|---|---|---|
| 1 | 200 | 0.783594 |
| 48 | 200 | 1.366292 |
| 71 | 200 | 1.999072 |
| 94 | 200 | 3.010348 |
| 96 | 200 | 3.317367 |
Heavy phase evidence
The artifact heavy-responses-20260404T053438Z.csv is captured as a concatenated one-line stream. Status entries remain 200 in parsed segments, and KQL HTTP export is used as primary timing source.
From KQL HTTP export (/heavy endpoint rows):
| Metric | Value |
|---|---|
/heavy rows in export window | 100 |
| HTTP status | all 200 |
Avg TimeTaken (ms) | 4,983.5 |
p95 TimeTaken (ms) | 14,815 |
Max TimeTaken (ms) | 15,630 |
4.8 KQL HTTP summary (real export)
From kql-http-20260404T060610Z.json:
| Endpoint | Status distribution |
|---|---|
/leak | 200: 200 |
/heavy | 200: 100 |
/diag/stats | 200: 6 |
/diag/proc | 200: 4 |
/health | 200: 2 |
/diag/env | 200: 1 |
/ | 200: 1 |
Total rows: 314, all status 200.
4.9 KQL console and platform evidence
Console logs
From kql-console-20260404T060610Z.json:
rows: []- No
WORKER TIMEOUT,OOM, or kill signature during this window.
Platform logs
From kql-platform-20260404T060610Z.json:
- Site/container startup lifecycle entries present.
- No restart/failure event in observed window.
Representative platform rows:
| TimeGenerated | Level | Message |
|---|---|---|
2026-04-04T05:04:41.3166132Z | Informational | Site started. |
2026-04-04T05:04:41.0395645Z | Informational | Site startup probe succeeded after 8.7320828 seconds. |
2026-04-04T05:04:32.099382Z | Informational | Container is running. |
4.10 Raw KQL output sample (sanitized)
Representative rows from HTTP export:
| TimeGenerated | CsUriStem | ScStatus | TimeTaken |
|---|---|---|---|
2026-04-04T05:36:33.614669Z | /diag/stats | 200 | 11 |
2026-04-04T05:36:32.83155Z | /diag/proc | 200 | 205 |
2026-04-04T05:36:31.823068Z | /heavy | 200 | 1393 |
2026-04-04T05:36:27.173104Z | /heavy | 200 | 4962 |
2026-04-04T05:36:29.576105Z | /heavy | 200 | 1540 |
4.11 Hypothesis verdict
Result: Supported (pre-failure stage)
Evidence that supports hypothesis:
MemAvailabledropped from523896 kBto44760 kBmid-leak.pgscan_kswapdandpgscan_directrose substantially.SwapFreedropped by ~1.4 GB from baseline to post-heavy.- PSI memory pressure moved from near-zero avg10 to very high values.
/heavylatency tail in KQL reached 15+ seconds while status remained 200.
Evidence against immediate outage:
- No 5xx in trigger/KQL window.
- No console timeout/OOM records.
- No platform restart event in sampled interval.
Interpretation:
This run captured a high-risk intermediate state where memory pressure and reclaim were demonstrably active, but failure thresholds were not yet crossed.
4.12 Recommendations
- Treat low
MemAvailable+ risingpgscan_directas an early warning signal. - Reduce worker count or cap per-request memory growth before user-visible errors appear.
- Add periodic
/diag/proctelemetry in non-production labs for trend baselining. - Correlate HTTP latency tail with reclaim counters, not only with 5xx rate.
- If this pattern appears in production, scale up plan memory or split workloads.
4.13 Reproducibility notes
- Trigger volume and timing are deterministic in script structure but still subject to worker scheduling variance.
- HTTP log windows can include extra baseline requests; always correlate by endpoint and timestamp.
- For strict phase accounting, export logs immediately after each phase boundary.
Expected Evidence
This section defines what you SHOULD observe at each phase of the lab. Use it to validate your investigation is on track.
Before Trigger (Baseline)
| Evidence Source | Expected State | What to Capture |
|---|---|---|
| AppServiceHTTPLogs | All 200s, low TimeTaken | Baseline query snapshot for /health, /diag/stats, and light traffic |
| AppServiceConsoleLogs | Normal Gunicorn boot lines with 4 workers | Worker PIDs 1892-1895 and startup timestamps |
| AppServicePlatformLogs | Site startup lifecycle only | "Site started" sequence and probe timing |
/diag/stats | Low request volume and low leak counters | Baseline leak_block_count, endpoint counts, process counters |
During Incident
| Evidence Source | Expected State | Key Indicator |
|---|---|---|
/leak responses | HTTP 200 with steadily increasing block count | Leak progression confirms retained allocations are accumulating |
AppServiceHTTPLogs (/heavy) | HTTP 200 with elevated TimeTaken | 920-1384 ms baseline heavy tail, with outliers into multi-second range |
/diag/proc | RSS growth across workers and lower memory headroom | MemAvailable falls while per-worker RSS rises |
/diag/proc vmstat counters | Reclaim pressure rises | pgscan_* and allocstall_* counters increase materially |
After Recovery
| Evidence Source | Expected State | Key Indicator |
|---|---|---|
| AppServiceHTTPLogs | No 5xx required for hypothesis support | Pressure evidence can exist even with 200-dominant responses |
/diag/stats | Leak counters remain elevated until recycle/reset | Accumulated leak state persists after trigger burst |
/diag/proc | Pressure can ease, but counters remain advanced | Reclaim counters do not roll back, proving pressure occurred |
| Console/Platform logs | No mandatory crash signatures in this run | Absence of restart does not disprove memory pressure |
Evidence Timeline
graph TD
    A[Baseline Capture] --> B[Trigger Fault]
    B --> C[During: Collect Evidence]
    C --> D[After: Compare to Baseline]
    D --> E[Verdict: Confirmed/Falsified]
Evidence Chain: Why This Proves the Hypothesis
Falsification Logic
If you observe rising /leak block counts, falling MemAvailable, and increasing pgscan/allocstall counters while /heavy latency expands, the hypothesis is CONFIRMED because memory pressure is demonstrably active before hard failure.
If you do NOT observe memory-headroom collapse or reclaim-counter growth under the same trigger volume, the hypothesis is FALSIFIED — consider CPU-only saturation, dependency latency, or trigger-shape mismatch.