Lab: Intermittent 5xx Under Load
This lab reproduces intermittent request failures caused by sync worker starvation on Azure App Service Linux.
The app intentionally mixes slow and fast endpoints:
/slowsleeps 5-15 seconds./fastreturns immediately.
When a burst of concurrent slow requests occupies the limited Gunicorn sync workers, fast requests queue behind them and start timing out.
graph TD
    A[Deploy B1 Linux app with 2 sync workers] --> B[Launch 20 concurrent /slow requests]
    B --> C[Immediately call /fast 10 times]
    C --> D[Observe queued fast requests]
    D --> E[Collect trigger CSV + /diag/stats]
    E --> F[Query AppServiceHTTPLogs for 200 vs 499 pattern]
    F --> G[Confirm worker starvation causal chain]
This guide is designed to diagnose intermittent 5xx-like customer symptoms where the root cause is worker pool saturation and request queueing rather than random platform instability, using a B1 Linux Python 3.11 app with Gunicorn sync, --workers 2, --timeout 30, a trigger of 20 concurrent /slow requests followed by 10 /fast requests, and sanitized artifacts from a real run.
Lab Metadata
| Attribute | Value |
|---|---|
| Difficulty | Intermediate |
| Estimated Duration | 45-60 minutes |
| Tier | Basic |
| Failure Mode | Intermittent request failures caused by sync-worker starvation and request queueing under mixed slow and fast load |
| Skills Practiced | Load-pattern analysis, worker-model troubleshooting, HTTP log interpretation, queueing correlation |
Status code interpretation
The artifact run primarily shows HTTP 499 in App Service HTTP logs for timed-out client-side requests.
In customer incidents this usually appears as intermittent "5xx/unavailable" behavior from the caller perspective, even when backend logs include 499 rather than 500.
1) Background
1.1 Mechanism overview
This failure mode is a queueing problem:
- A small sync worker pool accepts work.
- Long-running requests occupy workers.
- New requests cannot execute until a worker is free.
- Waiting clients hit timeout thresholds.
- Logs show a mixed pattern of successes and timeouts.
1.2 App and process model in this lab
From baseline/app-config.json:
| Setting | Value | Why it matters |
|---|---|---|
linuxFxVersion | PYTHON|3.11 | Linux Python runtime |
appCommandLine | gunicorn --bind 0.0.0.0:8000 --workers 2 --worker-class sync --timeout 30 app:app | Hard cap of 2 concurrent request executions |
alwaysOn | false | Startup behavior not primary in this run |
numberOfWorkers | 1 | Single app instance for deterministic load |
With sync workers, a worker handles one request at a time. If two workers are blocked on /slow, /fast waits in queue.
1.3 Request starvation diagram
flowchart TD
    A[20 concurrent /slow requests] --> B[Worker 1 busy]
    A --> C[Worker 2 busy]
    D[/fast requests arrive/] --> E[Queue behind /slow]
    E --> F{Client timeout reached?}
    F -->|Yes| G[Client abort / 499 in logs]
    F -->|No| H[Eventually 200]

    style B fill:#ef6c00,color:#fff
    style C fill:#ef6c00,color:#fff
    style G fill:#c62828,color:#fff
    style H fill:#2e7d32,color:#fff
1.4 Endpoint behavior from app code
| Endpoint | Behavior | Typical duration |
|---|---|---|
/slow | Random sleep between 5 and 15 seconds | seconds to tens of seconds when queued |
/fast | Immediate JSON response | milliseconds when not queued |
/diag/stats | Process and endpoint counters | milliseconds |
Because /slow blocks worker threads in sync mode, it is an ideal lab endpoint to reproduce starvation.
1.5 Why this resembles intermittent 5xx incidents
In real systems, users often report:
- Some requests succeed.
- Some requests fail with gateway/service-unavailable messages.
- Failures are clustered during brief load bursts.
That pattern matches this lab's mixed-success output under constrained workers.
1.6 Internal queueing timeline
sequenceDiagram
    participant ClientA as Slow Clients (x20)
    participant ClientB as Fast Clients (x10)
    participant FE as App Service Front End
    participant Gunicorn as Gunicorn sync workers=2
    participant App as Flask app

    ClientA->>FE: Burst /slow
    FE->>Gunicorn: Dispatch first two /slow
    Gunicorn->>App: worker 1 executes /slow
    Gunicorn->>App: worker 2 executes /slow
    ClientB->>FE: /fast requests
    FE->>Gunicorn: Queue /fast (no free worker)
    Note over Gunicorn: queue wait grows
    alt Client timeout reached
        FE-->>ClientB: timeout/aborted (logged as 499)
    else Worker frees up in time
        Gunicorn->>App: execute /fast
        FE-->>ClientB: 200
    end
1.7 Signal map for this failure mode
| Signal | Expected direction under starvation |
|---|---|
/slow request durations | high (often near timeout bounds) |
/fast request durations | bimodal (very fast or near timeout) |
/fast timeout count | increases during slow burst |
| HTTP status mix | 200 mixed with timeout-like statuses (499 in this run) |
| Console worker timeout entries | possible but not guaranteed in short runs |
1.8 Distinguishing from other incident classes
| Incident class | Primary signal | How this lab differs |
|---|---|---|
| Dependency outage | external dependency errors | Here, failure appears even without dependency calls |
| CPU saturation | high CPU, slow compute everywhere | Here, queueing from sync workers dominates |
| Memory pressure | reclaim/swap trends | Here, fast endpoint fails due queue delay, not low memory |
| Platform restart | platform lifecycle errors | Here, platform logs mainly startup informational events |
1.9 Practical troubleshooting takeaway
If fast endpoints fail only when slow endpoints are concurrent, investigate worker model first:
- Worker class (
syncvs async/threaded) - Worker count
- Timeout alignment between client and server
- Concurrency profile of requests
2) Hypothesis
2.1 Falsifiable hypothesis statement
If we run 20 concurrent /slow requests against a Gunicorn app configured with only 2 sync workers and then send 10 /fast requests, then:
- a significant share of
/fastwill time out, /slowwill also partially time out,- HTTP logs will show mixed 200/499 pattern,
which confirms worker starvation and queueing.
2.2 Causal chain
SLOW_CONCURRENCY=20saturates the two sync workers./fastrequests queue behind/slow.- Client-side timeout thresholds are reached (
15sfor fast,45sfor slow in trigger artifacts). - Timed-out requests surface as status
000in trigger output and499in App Service HTTP logs.
flowchart TD
    A[Limited sync workers=2] --> B[Concurrent /slow saturates workers]
    B --> C[/fast cannot start promptly]
    C --> D[Queue wait increases]
    D --> E[Client timeout threshold exceeded]
    E --> F[499 in HTTP logs and timeout at caller]
2.3 Proof criteria
| Proof criterion | Threshold | Evidence source |
|---|---|---|
| Slow endpoint stress is real | At least 20 slow attempts with multiple long durations | slow-responses-*.csv |
| Fast endpoint starvation | At least 50% fast timeout rate during slow burst | fast-responses-*.csv |
| Mixed status pattern | Both success and timeout-like statuses in same run | Trigger CSV + KQL HTTP |
| Queueing signature | Fast endpoint durations include near-timeout values | Trigger CSV + KQL TimeTaken |
| No mandatory platform crash | Platform logs can remain informational | KQL platform export |
2.4 Disproof criteria
Any of these weaken/disprove starvation hypothesis:
- Fast requests remain consistently low-latency under slow concurrency burst.
- Slow requests do not occupy workers long enough to cause queueing.
- Timeouts occur without corresponding slow burst.
- Failures align with platform restarts instead of queueing behavior.
2.5 Variables
Independent variables
| Variable | Value in this run |
|---|---|
| Gunicorn worker count | 2 |
| Worker class | sync |
| Gunicorn timeout | 30 seconds |
| Slow concurrency burst | 20 requests |
| Fast request volume | 10 requests |
| Client max-time used by trigger | 45 seconds (for both endpoints in script) |
Dependent variables
| Variable | Source |
|---|---|
| Per-request status and latency | trigger CSV artifacts |
| Endpoint status distribution | KQL HTTP export |
Endpoint TimeTaken | KQL HTTP export |
| Endpoint hit counters | /diag/stats artifacts |
| Runtime/platform error messages | KQL console/platform exports |
Controlled conditions
| Control | Value |
|---|---|
| SKU | B1 |
| Region | Korea Central |
| Runtime | Python 3.11 |
| App version | same Flask code and trigger |
2.6 Causal validation matrix
| Observation | Expected if hypothesis true | Actual artifact result |
|---|---|---|
| Slow request long tails | Yes | Yes (~45s timeouts present) |
| Fast requests time out under slow load | Yes | Yes (6/10 timeout in fast CSV) |
| Status mix in logs | Yes | Yes (200 and 499 both present) |
| Clear platform crash required | No | No (platform logs informational) |
2.7 Confounders and boundaries
- Trigger script captures one burst window; repeated runs can vary slightly.
- App Service HTTP status
499indicates client abort/timeouts; external monitoring may categorize this as availability impact akin to intermittent 5xx symptoms. - Console timeout logs may be absent for short windows even when queueing is evident.
Do not overfit on one status code
For this incident class, causal interpretation should prioritize timing and queueing behavior over a single status code family.
3) Runbook
3.1 Prerequisites
3.2 Set standard variables
export RG="rg-lab-5xx"
export LOCATION="koreacentral"
export BASE_NAME="lab5xx"
export APP_PACKAGE_PATH="/tmp/intermittent-5xx-app.zip"
3.3 Create resource group
3.4 Deploy Bicep (actual lab template path)
az deployment group create \
  --resource-group "$RG" \
  --template-file "labs/intermittent-5xx/main.bicep" \
  --parameters baseName="$BASE_NAME" location="$LOCATION"
Extract deployment outputs:
export APP_NAME=$(az deployment group show \
  --resource-group "$RG" \
  --name "main" \
  --query "properties.outputs.appName.value" \
  --output tsv)

export APP_HOSTNAME=$(az deployment group show \
  --resource-group "$RG" \
  --name "main" \
  --query "properties.outputs.defaultHostName.value" \
  --output tsv)

export APP_URL="https://${APP_HOSTNAME}"
3.5 Deploy application package
cd "labs/intermittent-5xx/app"
zip --recurse-paths "$APP_PACKAGE_PATH" .

az webapp deploy \
  --resource-group "$RG" \
  --name "$APP_NAME" \
  --src-path "$APP_PACKAGE_PATH" \
  --type zip
Restart app for clean test state:
3.6 Baseline health checks
curl --silent "$APP_URL/"
curl --silent "$APP_URL/health"
curl --silent "$APP_URL/fast"
curl --silent "$APP_URL/diag/stats"
Baseline artifact values from this run:
| Artifact | Key values |
|---|---|
baseline/diag-stats.json | request_count=3, active_slow_requests=0, endpoint_counters={diag_stats:2, root:1} |
baseline/app-config.json | gunicorn --workers 2 --worker-class sync --timeout 30 |
3.7 Trigger starvation workload (actual trigger script)
Script behavior:
- Launches 20 concurrent
/slowrequests. - Immediately sends 10
/fastrequests. - Prints per-request status and elapsed time.
3.8 Capture post-trigger diagnostics
curl --silent "$APP_URL/diag/stats" > /tmp/intermittent-5xx-diag-stats-after.json
curl --silent "$APP_URL/diag/env" > /tmp/intermittent-5xx-diag-env-after.json
Portal view: Application Insights overview (post-trigger triage anchor)
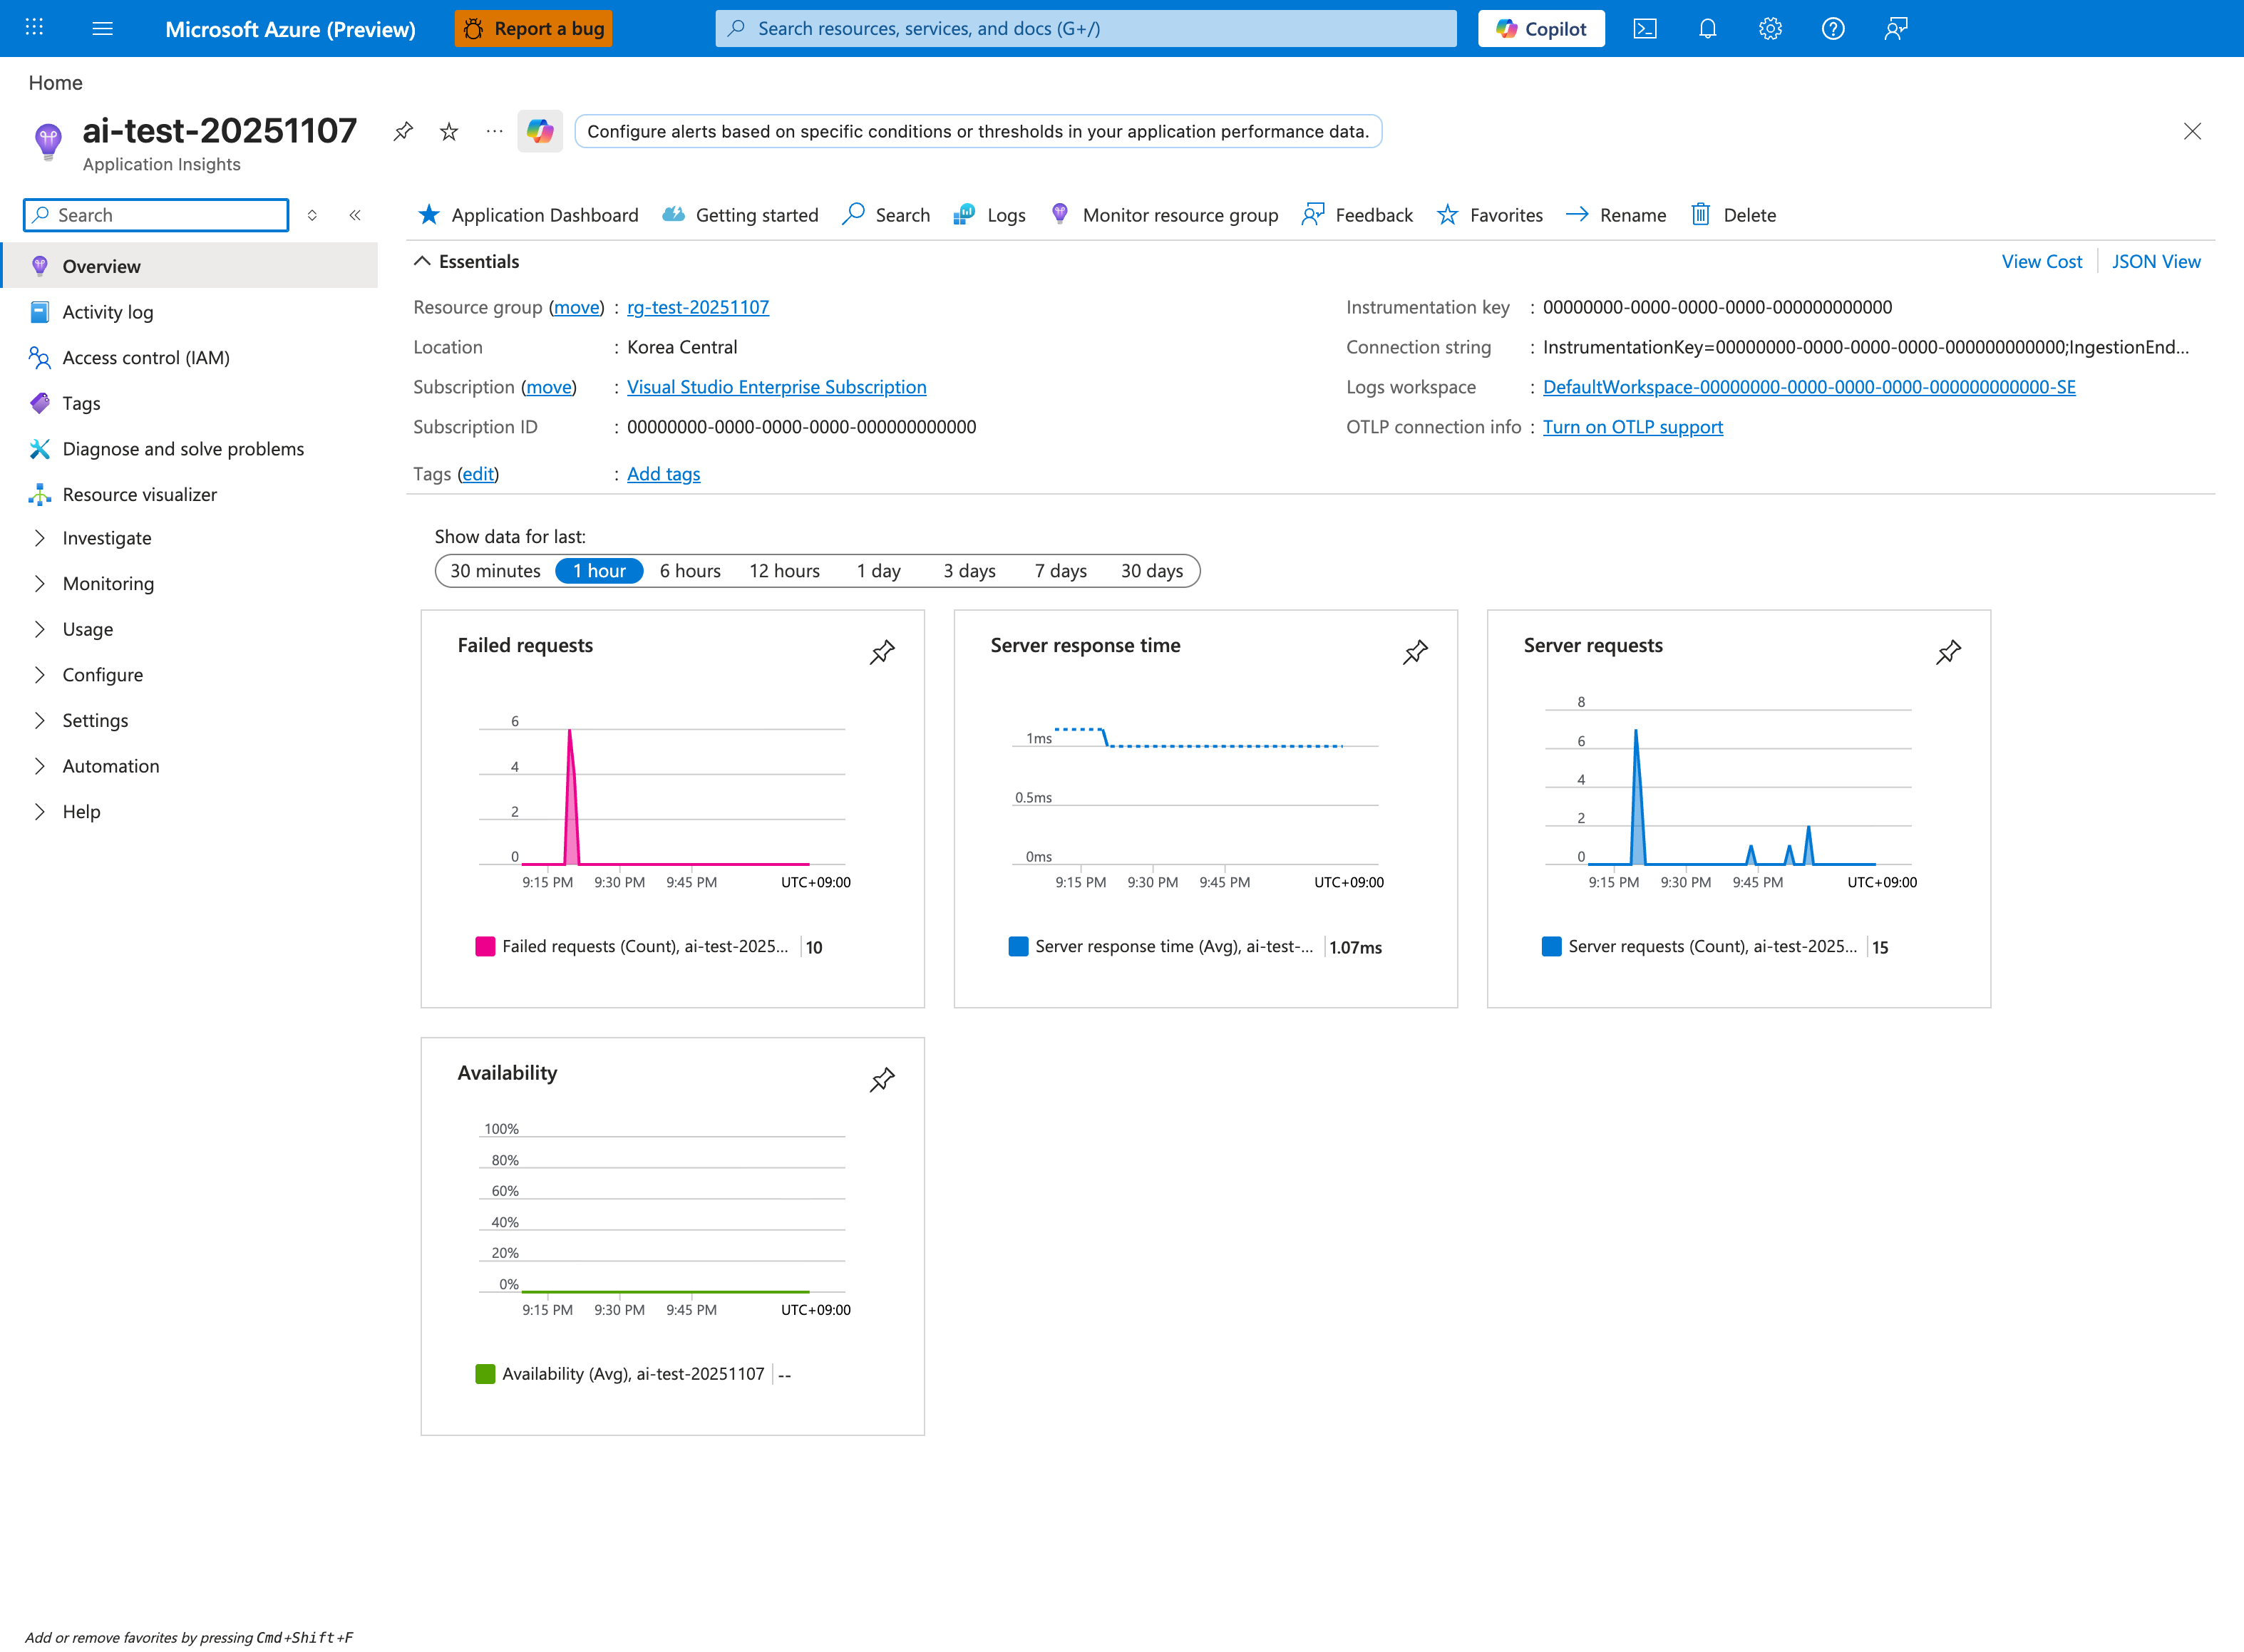
The Application Insights overview is the highest-signal Portal view to open immediately after the trigger script in section 3.7 finishes. The Failed requests tile (10 here) is the primary failure-burst indicator, Server response time separates fast-path latency from slow-endpoint queueing, and Server requests lets you visually correlate the failure burst with the request volume burst from /slow. The Show data for last 1 hour tab keeps the window tight enough that the starvation pattern is not smoothed away by older traffic - widen it to 24 hours only after the immediate-window signal is validated. From here, click the Failed requests tile to drill into the App Insights requests failure telemetry for the same failure window the platform AppServiceHTTPLogs queries in section 3.10 aggregate from a different angle.
3.9 Query Log Analytics
Resolve workspace identifiers:
export LOG_WORKSPACE_NAME=$(az deployment group show \
  --resource-group "$RG" \
  --name "main" \
  --query "properties.outputs.logAnalyticsWorkspaceName.value" \
  --output tsv)

export LOG_WORKSPACE_ID=$(az monitor log-analytics workspace show \
  --resource-group "$RG" \
  --workspace-name "$LOG_WORKSPACE_NAME" \
  --query "customerId" \
  --output tsv)
HTTP detail query
az monitor log-analytics query \
  --workspace "$LOG_WORKSPACE_ID" \
  --analytics-query "AppServiceHTTPLogs | where TimeGenerated > ago(2h) | project TimeGenerated, CsUriStem, ScStatus, TimeTaken, CsHost | order by TimeGenerated desc" \
  --output json
Status by endpoint query
az monitor log-analytics query \
  --workspace "$LOG_WORKSPACE_ID" \
  --analytics-query "AppServiceHTTPLogs | where TimeGenerated > ago(2h) | summarize total=count(), s200=countif(ScStatus==200), s499=countif(ScStatus==499), s5xx=countif(ScStatus>=500) by CsUriStem | order by total desc" \
  --output json
Endpoint latency profile query
az monitor log-analytics query \
  --workspace "$LOG_WORKSPACE_ID" \
  --analytics-query "AppServiceHTTPLogs | where TimeGenerated > ago(2h) | summarize avgMs=avg(TimeTaken), p95Ms=percentile(TimeTaken,95), maxMs=max(TimeTaken) by CsUriStem | order by p95Ms desc" \
  --output json
Console and platform query
az monitor log-analytics query \
  --workspace "$LOG_WORKSPACE_ID" \
  --analytics-query "AppServiceConsoleLogs | where TimeGenerated > ago(2h) | project TimeGenerated, ResultDescription | order by TimeGenerated desc" \
  --output json

az monitor log-analytics query \
  --workspace "$LOG_WORKSPACE_ID" \
  --analytics-query "AppServicePlatformLogs | where TimeGenerated > ago(2h) | project TimeGenerated, Level, Message | order by TimeGenerated desc" \
  --output json
3.10 KQL snippets for portal troubleshooting
Portal view: Logs blade (Log Analytics query editor)
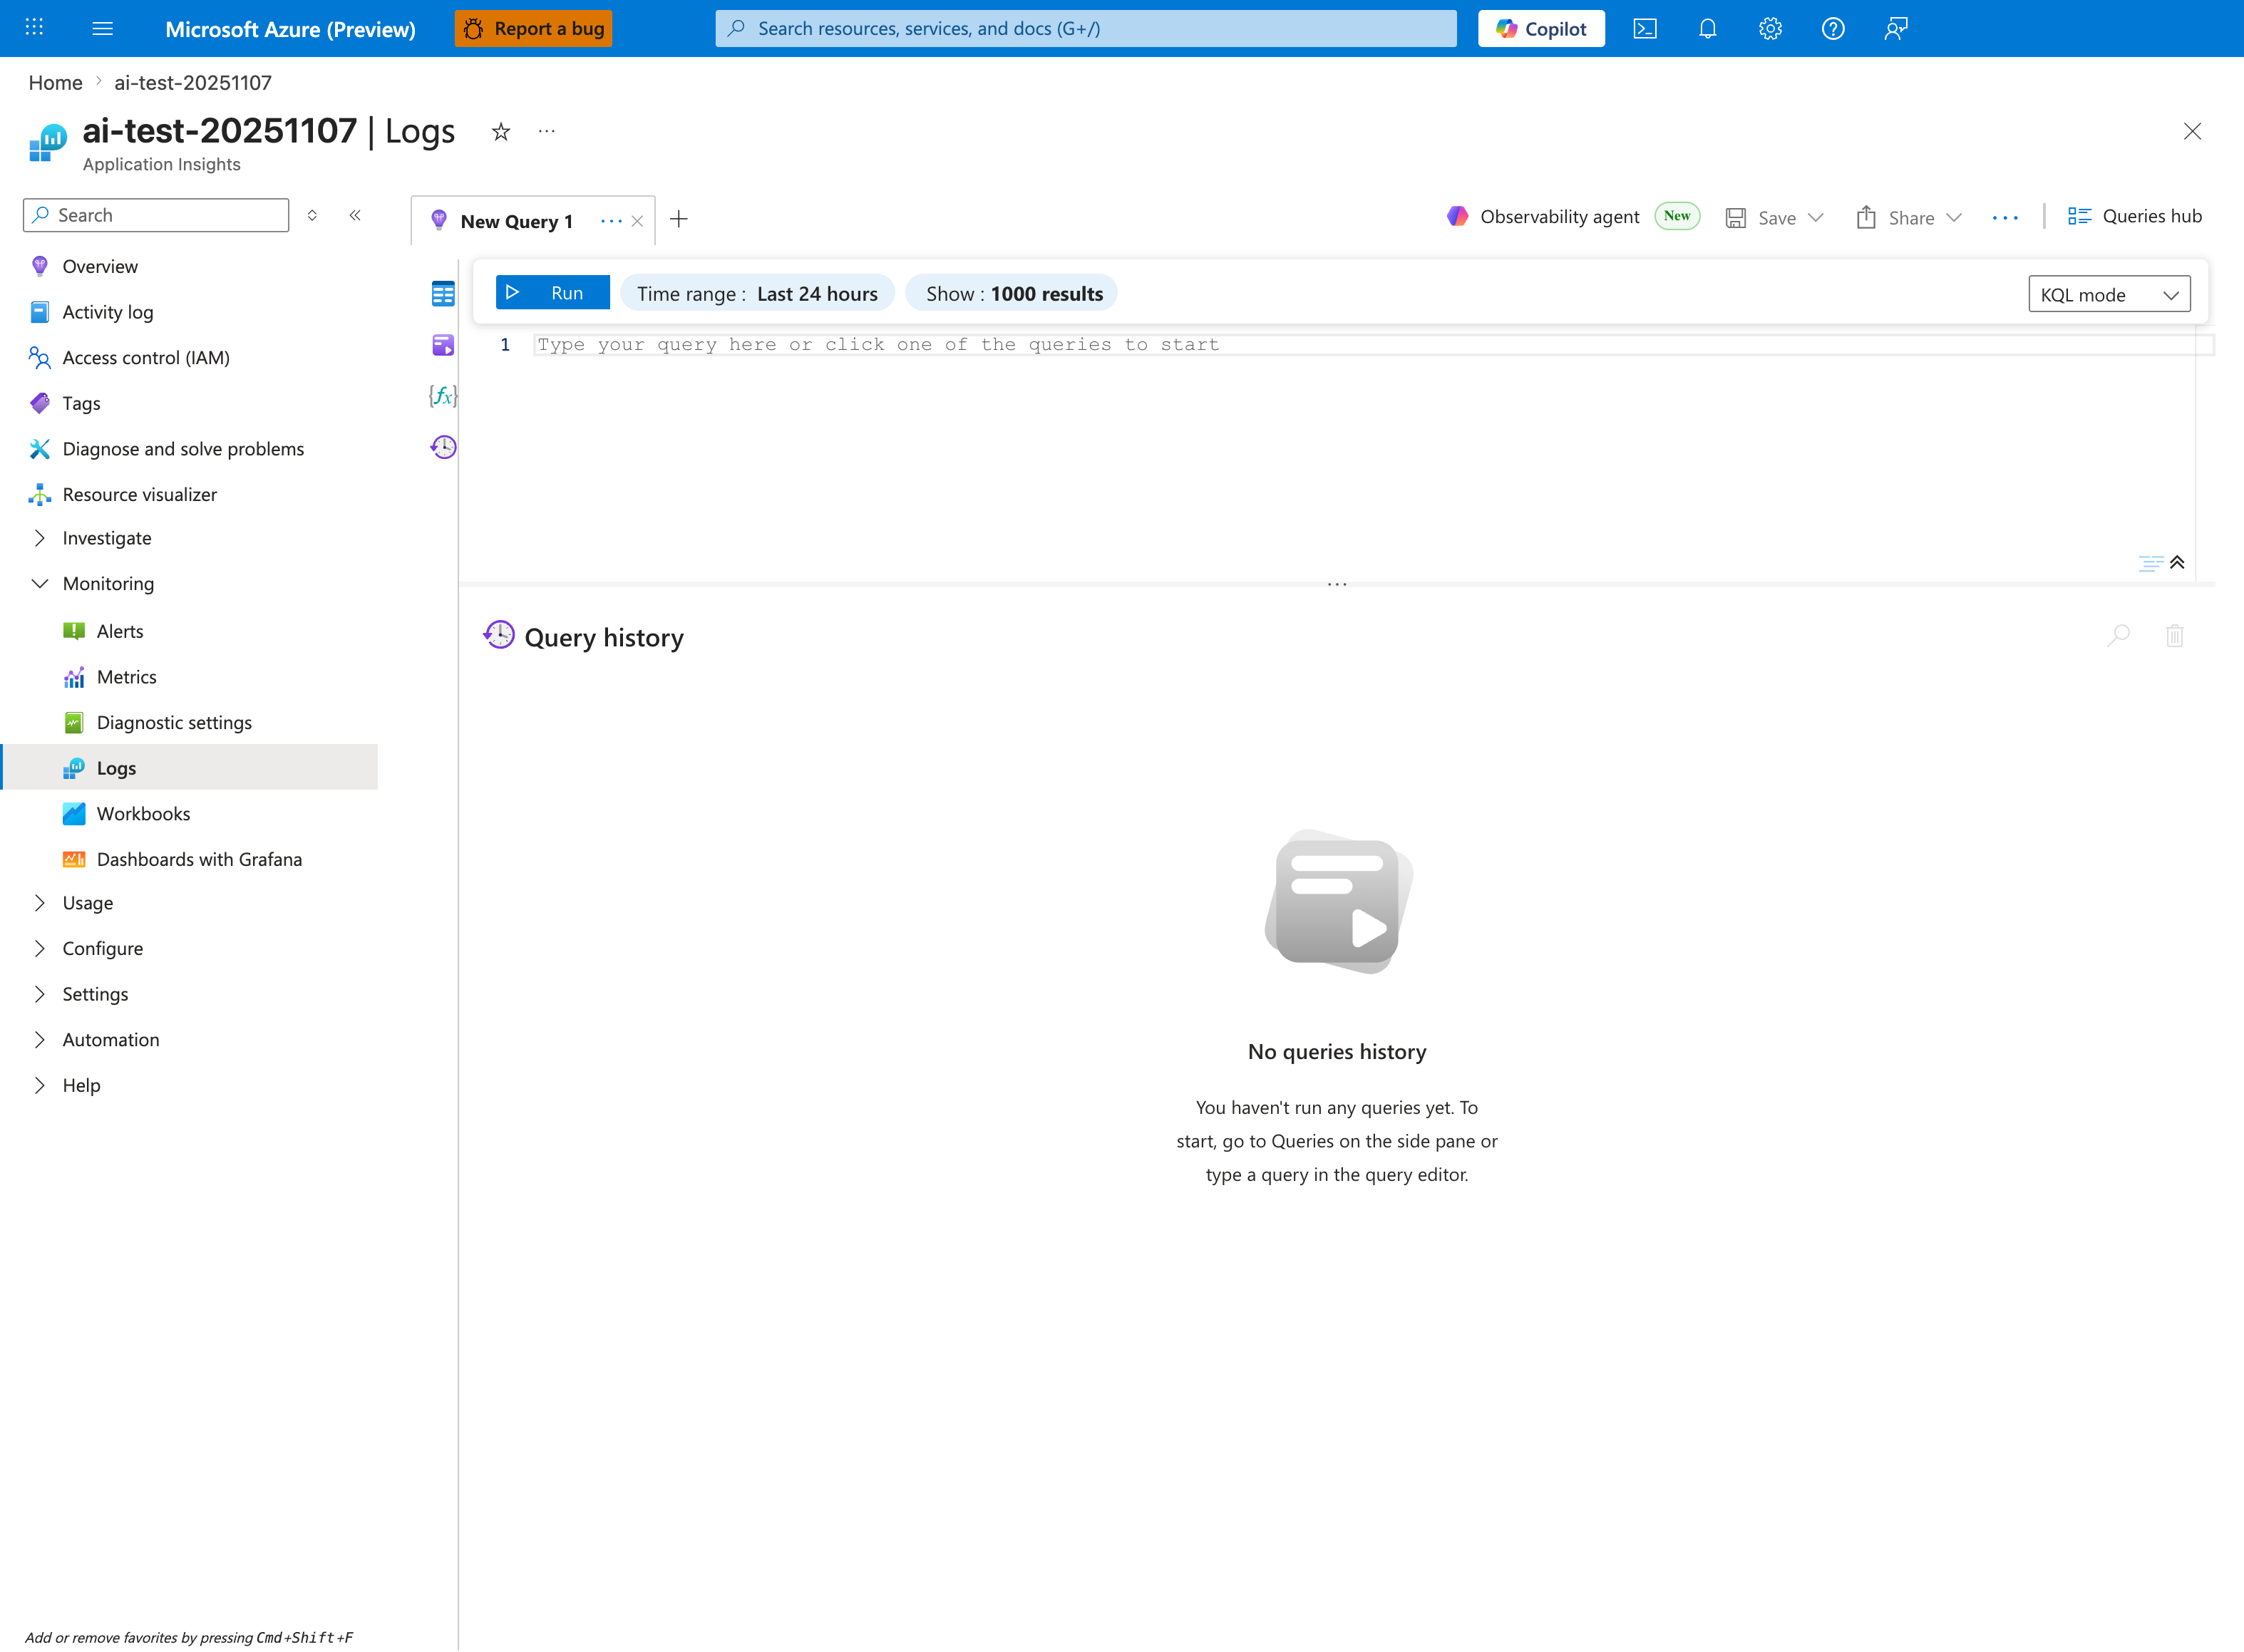
The Logs blade is where you paste the KQL snippets below - this capture shows the Application Insights Logs experience (ai-test-20251107), but the workspace-based Log Analytics blade has the same query editor and toolbar. Use the New Query 1 tab, keep Time range: Last 24 hours to cover the intermittent failure window (the lab's 5xx pattern usually spans hours, not minutes), and leave Show: 1000 results so summarized status distributions are not truncated. The Queries hub button in the top-right gives you a saved-query library; once you have run one of the snippets below, save it there so the next on-call engineer can re-run the same triage in one click. The empty Query history pane confirms this is a fresh session - paste the first KQL block to populate it.
AppServiceHTTPLogs
| where TimeGenerated > ago(2h)
| summarize total=count(), s200=countif(ScStatus==200), s499=countif(ScStatus==499), s5xx=countif(ScStatus>=500) by CsUriStem
| order by total desc
AppServiceHTTPLogs
| where TimeGenerated > ago(2h)
| summarize avgMs=avg(TimeTaken), p95Ms=percentile(TimeTaken, 95), maxMs=max(TimeTaken) by CsUriStem, ScStatus
| order by p95Ms desc
AppServiceHTTPLogs
| where TimeGenerated > ago(2h)
| where CsUriStem in ("/slow", "/fast")
| project TimeGenerated, CsUriStem, ScStatus, TimeTaken
| order by TimeGenerated asc
AppServicePlatformLogs
| where TimeGenerated > ago(2h)
| project TimeGenerated, Level, Message
| order by TimeGenerated desc
3.11 Verification checklist
- [ ] Trigger executed with 20
/slowand 10/fast. - [ ] Slow and fast CSV artifacts captured.
- [ ]
/fasttimeout ratio increased during/slowburst. - [ ] KQL HTTP logs show mixed status pattern.
- [ ]
/diag/statsshows endpoint counters after run. - [ ] Console/platform exports checked.
3.12 Common pitfalls
| Pitfall | Symptom | Fix |
|---|---|---|
| Wrong Bicep path | Deployment error | Use labs/intermittent-5xx/main.bicep |
| Trigger against wrong app URL | No expected pattern | Re-resolve APP_URL from deployment outputs |
| Missing diagnostics linkage | Empty KQL tables | Verify diagnostic setting on web app |
| Running trigger repeatedly without waiting | Mixed windows hard to interpret | Label each run and time-bound KQL queries |
3.13 Decision tree for incident triage
flowchart TD
    A[Observe intermittent failures] --> B{Are slow endpoints active concurrently?}
    B -->|No| C[Investigate dependency or platform issues]
    B -->|Yes| D{Fast endpoints degrade simultaneously?}
    D -->|No| E[Investigate endpoint-specific logic]
    D -->|Yes| F[Check worker count and worker class]
    F --> G[Validate queueing pattern in TimeTaken and status mix]
    G --> H[Apply concurrency/worker tuning]
4) Experiment Log
4.1 Artifact inventory used
All values below come from:
labs/intermittent-5xx/artifacts-sanitized/
| Category | Files used |
|---|---|
| Baseline | baseline/diag-stats.json, baseline/app-config.json |
| Trigger response files | trigger/slow-responses-20260404T053453Z.csv, trigger/fast-responses-20260404T053453Z.csv |
| Post-trigger state | trigger/diag-stats-after-20260404T053453Z.json |
| KQL exports | trigger/kql-http-20260404T060610Z.json, trigger/kql-console-20260404T060610Z.json, trigger/kql-platform-20260404T060610Z.json |
4.2 Baseline state
From baseline/diag-stats.json:
| Metric | Value |
|---|---|
request_count | 3 |
active_slow_requests | 0 |
endpoint_counters.diag_stats | 2 |
endpoint_counters.root | 1 |
pid | 1897 |
From baseline/app-config.json:
| Config key | Value |
|---|---|
appCommandLine | gunicorn --bind 0.0.0.0:8000 --workers 2 --worker-class sync --timeout 30 app:app |
linuxFxVersion | PYTHON|3.11 |
resourceGroup | rg-lab-5xx |
4.3 Trigger CSV evidence: slow endpoint
From slow-responses-20260404T053453Z.csv (20 requests):
| Metric | Value |
|---|---|
| Total requests | 20 |
200 responses | 9 |
000 timeout responses | 11 |
| Success ratio | 45% |
| Timeout ratio | 55% |
| Average elapsed (s) | 35.924 |
| p95 elapsed (s) | 45.001 |
| Max elapsed (s) | 45.001 |
Representative rows:
| Endpoint | Index | Status | Elapsed (s) |
|---|---|---|---|
| slow | 1 | 200 | 36.720223 |
| slow | 10 | 200 | 12.683494 |
| slow | 11 | 000 | 44.999914 |
| slow | 16 | 000 | 45.001025 |
| slow | 20 | 000 | 45.000372 |
4.4 Trigger CSV evidence: fast endpoint
From fast-responses-20260404T053453Z.csv (10 requests):
| Metric | Value |
|---|---|
| Total requests | 10 |
200 responses | 4 |
000 timeout responses | 6 |
| Success ratio | 40% |
| Timeout ratio | 60% |
| Average elapsed (s) | 9.404 |
| p95 elapsed (s) | 15.001 |
| Max elapsed (s) | 15.001 |
Per-request rows (exact):
| Endpoint | Index | Status | Elapsed (s) |
|---|---|---|---|
| fast | 1 | 200 | 0.646940 |
| fast | 2 | 000 | 15.000374 |
| fast | 3 | 000 | 15.000239 |
| fast | 4 | 000 | 15.001060 |
| fast | 5 | 000 | 15.000587 |
| fast | 6 | 000 | 15.000307 |
| fast | 7 | 000 | 15.000966 |
| fast | 8 | 200 | 2.012888 |
| fast | 9 | 200 | 0.719541 |
| fast | 10 | 200 | 0.656119 |
4.5 Post-trigger app state
From diag-stats-after-20260404T053453Z.json:
| Metric | Value |
|---|---|
request_count | 17 |
active_slow_requests | 0 |
endpoint_counters.slow | 10 |
endpoint_counters.fast | 1 |
endpoint_counters.diag_stats | 3 |
endpoint_counters.health | 1 |
endpoint_counters.diag_env | 1 |
endpoint_counters.root | 1 |
Interpretation:
- Endpoint counters reflect requests that reached the app handler.
- Trigger CSV includes client-observed timeouts before some requests completed server-side.
4.6 KQL HTTP aggregate summary
From kql-http-20260404T060610Z.json:
| Aggregate metric | Value |
|---|---|
| Total rows | 60 |
200 rows | 29 |
499 rows | 31 |
Status by endpoint:
| Endpoint | 200 | 499 | Total |
|---|---|---|---|
/slow | 16 | 24 | 40 |
/fast | 5 | 7 | 12 |
/diag/stats | 4 | 0 | 4 |
/health | 2 | 0 | 2 |
/diag/env | 1 | 0 | 1 |
/ | 1 | 0 | 1 |
4.7 KQL latency profile by endpoint
From KQL HTTP export (TimeTaken in milliseconds):
| Endpoint | Count | Avg ms | p95 ms | Max ms |
|---|---|---|---|---|
/slow | 40 | 36,440.3 | 44,894 | 44,921 |
/fast | 12 | 11,046.8 | 14,484 | 44,865 |
/diag/stats | 4 | 11.5 | 6 | 33 |
/health | 2 | 19.0 | 3 | 35 |
Key signature:
/fastshows both very low and very high durations in the same run, which is expected when queueing behind occupied sync workers.
4.8 Raw KQL sample rows (sanitized)
Representative rows from kql-http-20260404T060610Z.json:
| TimeGenerated | CsUriStem | ScStatus | TimeTaken |
|---|---|---|---|
2026-04-04T05:36:26.941612Z | /fast | 200 | 1 |
2026-04-04T05:36:23.677624Z | /fast | 499 | 14411 |
2026-04-04T05:35:37.981987Z | /slow | 499 | 44430 |
2026-04-04T05:35:30.516813Z | /slow | 200 | 37019 |
2026-04-04T05:35:23.646864Z | /fast | 499 | 14393 |
4.9 Console and platform exports
Console log export
From kql-console-20260404T060610Z.json:
rows: []
No console entries were captured in this window.
Platform log export
From kql-platform-20260404T060610Z.json:
- Lifecycle informational events (site start, warmup probe success, container running).
- No explicit failure/restart entry in sampled period.
Sample rows:
| TimeGenerated | Level | Message |
|---|---|---|
2026-04-04T05:05:05.5422387Z | Informational | Site started. |
2026-04-04T05:05:05.0599636Z | Informational | Site startup probe succeeded after 8.0666499 seconds. |
2026-04-04T05:04:56.9229799Z | Informational | Container is running. |
4.10 Hypothesis verdict
Result: Supported
Why supported:
- Under a 20-request slow burst, slow endpoint timeout ratio reached 55%.
- Fast endpoint timeout ratio reached 60% despite fast handler logic.
- KQL HTTP logs show mixed 200/499 pattern with high durations for
/fastand/slow. - Pattern is strongly consistent with sync worker starvation and queueing.
Not required for support in this run:
- Console timeout text was absent.
- Platform restart event was absent.
These are optional corroborators, not mandatory if timing/status pattern already proves queueing.
4.11 Recommendations
- Increase Gunicorn worker capacity or move to async/threaded worker model for mixed latency workloads.
- Isolate slow operations from front-door request path (queue, background job, or dedicated endpoint plan).
- Align client timeout and server timeout intentionally (avoid accidental mismatch where client cancels first).
- Monitor endpoint-specific latency and status distribution, not only aggregate app success rate.
- Use synthetic mixed-load probes (
/slow+/fast) in pre-production to detect starvation early.
4.12 Suggested follow-up experiments
| Experiment | Change | Expected outcome |
|---|---|---|
| Worker count increase | --workers 2 → --workers 4 | Reduced queue timeout rate |
| Worker class change | sync → gthread or async worker | Better tolerance to mixed slow/fast traffic |
| Slow concurrency reduction | 20 → 8 | Lower timeout ratios |
| Timeout tuning | Increase client timeout, evaluate tail | Fewer client-abort events but longer waits |
Expected Evidence
This section defines what you SHOULD observe at each phase of the lab. Use it to validate your investigation is on track.
Before Trigger (Baseline)
| Evidence Source | Expected State | What to Capture |
|---|---|---|
| AppServiceHTTPLogs | All 200s with low latency | Baseline query snapshot for /fast, /slow, /diag/stats |
| AppServiceConsoleLogs | Normal Gunicorn startup with sync workers | Boot line showing 3 sync workers and timeout settings |
| AppServicePlatformLogs | Normal startup sequence only | "Site started" and no restart loop |
/diag/stats | Balanced counters, no queue stress | Baseline endpoint counters and process info |
During Incident
| Evidence Source | Expected State | Key Indicator |
|---|---|---|
AppServiceHTTPLogs (/slow) | Predominant 499 near timeout edge | TimeTaken ~4877-4918 ms on timed-out slow requests |
| Trigger CSV + HTTP logs | Mixed success and timeout pattern | Concurrent burst yields 200+499 in same window |
| Worker model evidence | Sync workers blocked by long CPU-bound work | /fast waits behind occupied workers |
| Client-side observations | Caller sees intermittent unavailability | 499 indicates client disconnect before completion |
After Recovery
| Evidence Source | Expected State | Key Indicator |
|---|---|---|
| AppServiceHTTPLogs | 200 responses return to normal after burst ends | Fast-path latency normalizes when slow load stops |
/diag/stats | Queue-pressure behavior subsides | Request handling resumes without timeout-like clustering |
| Platform/Console logs | No mandatory platform crash required | Recovery can occur without restart |
| Incident interpretation | 499 treated as timeout symptom, not server 5xx | Confirms worker exhaustion pattern rather than random platform failure |
Evidence Timeline
graph TD
    A[Baseline Capture] --> B[Trigger Fault]
    B --> C[During: Collect Evidence]
    C --> D[After: Compare to Baseline]
    D --> E[Verdict: Confirmed/Falsified]
Evidence Chain: Why This Proves the Hypothesis
Falsification Logic
If you observe /slow requests clustering near timeout with 499, plus concurrent degradation of /fast while sync workers are occupied, the hypothesis is CONFIRMED because queueing and worker starvation explain the intermittent failures.
If you do NOT observe timeout clustering during slow-request bursts, the hypothesis is FALSIFIED — consider dependency failures, platform restarts, or non-worker bottlenecks.