Lab Guide (Level 3): Failed to Forward Request on Azure App Service Linux
This lab is a full reference investigation for the App Service Linux startup/binding failure pattern where the app process listens on loopback (127.0.0.1) and the platform reverse proxy cannot reach it. The guide includes deep background, a falsifiable hypothesis, a deterministic runbook, and an artifact-backed experiment log.
Lab Metadata
| Attribute | Value |
|---|---|
| Difficulty | Intermediate |
| Estimated Duration | 45-60 minutes |
| Tier | Basic |
| Failure Mode | Reverse proxy forwarding fails because Gunicorn listens on 127.0.0.1 instead of 0.0.0.0 |
| Skills Practiced | Startup command validation, bind-address diagnostics, platform and console log correlation, recovery verification |
Audience
This document targets incident responders, platform engineers, and support engineers who need a forensic-quality runbook for this failure mode.
PII safety
All IDs are sanitized in this repository. Keep them sanitized when reusing these examples.
1) Background
1.1 What “failed to forward request” means on Linux App Service
Inbound traffic to App Service Linux does not connect directly from internet clients to your Gunicorn process. There is an App Service front-end/reverse-proxy chain and warmup/startup probes before the site is considered ready.
If your app listens only on loopback (127.0.0.1) inside the container, proxy-to-container forwarding can fail because the proxy expects the application to be reachable on the container interface.
1.2 Request forwarding chain
flowchart TD
    A[Client] --> B[App Service Front End]
    B --> C[Worker + Container Network]
    C --> D[Gunicorn listener]
    D --> E[Flask app]

    style B fill:#1976d2,color:#fff
    style C fill:#455a64,color:#fff
    style D fill:#ef6c00,color:#fff
When D binds to 0.0.0.0:8000, C can reach D. When D binds to 127.0.0.1:8000, forwarding can fail depending on network path assumptions.
1.3 Why 127.0.0.1 can fail while app is “running”
A process can be healthy in-process but unreachable from platform forwarding path.
You can see this paradox in incidents:
- Gunicorn boots workers normally.
- App process exists.
- Startup probe still fails (
ContainerTimeout, warmup not successful). - External requests return
503or probe000.
1.4 Startup command and port environment mechanics
On App Service Linux, startup behavior commonly depends on:
- Startup file (
az webapp config set --startup-file ...) PORTWEBSITES_PORT(in certain deployment modes)
If startup command explicitly hardcodes --bind=127.0.0.1:8000, it can override otherwise-correct defaults and make forwarding fail.
1.5 Causal path with warmup probes
sequenceDiagram
    participant FE as Front End / Proxy
    participant WK as Worker Host
    participant CT as Container
    participant GN as Gunicorn

    FE->>WK: Route request / startup warmup
    WK->>CT: Probe app port
    CT->>GN: Forward to listener
    alt GN on 0.0.0.0:8000
        GN-->>CT: Responds
        CT-->>WK: Probe success
        WK-->>FE: Site ready
    else GN on 127.0.0.1:8000 (bad path for proxy)
        GN--x CT: Not reachable on expected interface
        CT--x WK: Probe timeout
        WK-->>FE: Startup failure / 503 surface
    end
1.6 Why this appears as startup timeout, not bind syntax error
In this lab, 127.0.0.1 is a valid socket bind. Gunicorn starts successfully.
Therefore logs often show:
- Gunicorn startup lines present.
- Worker boot lines present.
- Yet platform logs report probe timeout and container startup timeout.
This is why naive “process started = app reachable” assumptions fail.
1.7 Diagram: bind decision outcomes
flowchart TD
    A[Startup command parsed] --> B{Bind address}
    B -->|0.0.0.0:8000| C[Platform can forward]
    C --> D[Warmup succeeds]
    D --> E[HTTP 200 expected]

    B -->|127.0.0.1:8000| F[Forwarding path blocked]
    F --> G[Warmup probe timeout]
    G --> H[ContainerTimeout events]
    H --> I[HTTP 503 and curl 000]

    style C fill:#2e7d32,color:#fff
    style F fill:#ef6c00,color:#fff
    style I fill:#b71c1c,color:#fff
1.8 Relevant lab app endpoints
| Endpoint | Purpose |
|---|---|
/health | Health status for startup/recovery checks |
/diag/stats | Request counters + PID/uptime |
/diag/env | Effective env and inferred gunicorn bind |
/diag/bind | Runtime bind inference from cmdline + host hints |
1.9 Baseline evidence from artifacts
Primary baseline files:
baseline/app-config.jsonbaseline/startup-command.txt
Observed baseline startup command:
This baseline directly encodes the fault condition.
Portal view: Diagnose and solve (Web App Down baseline reading)
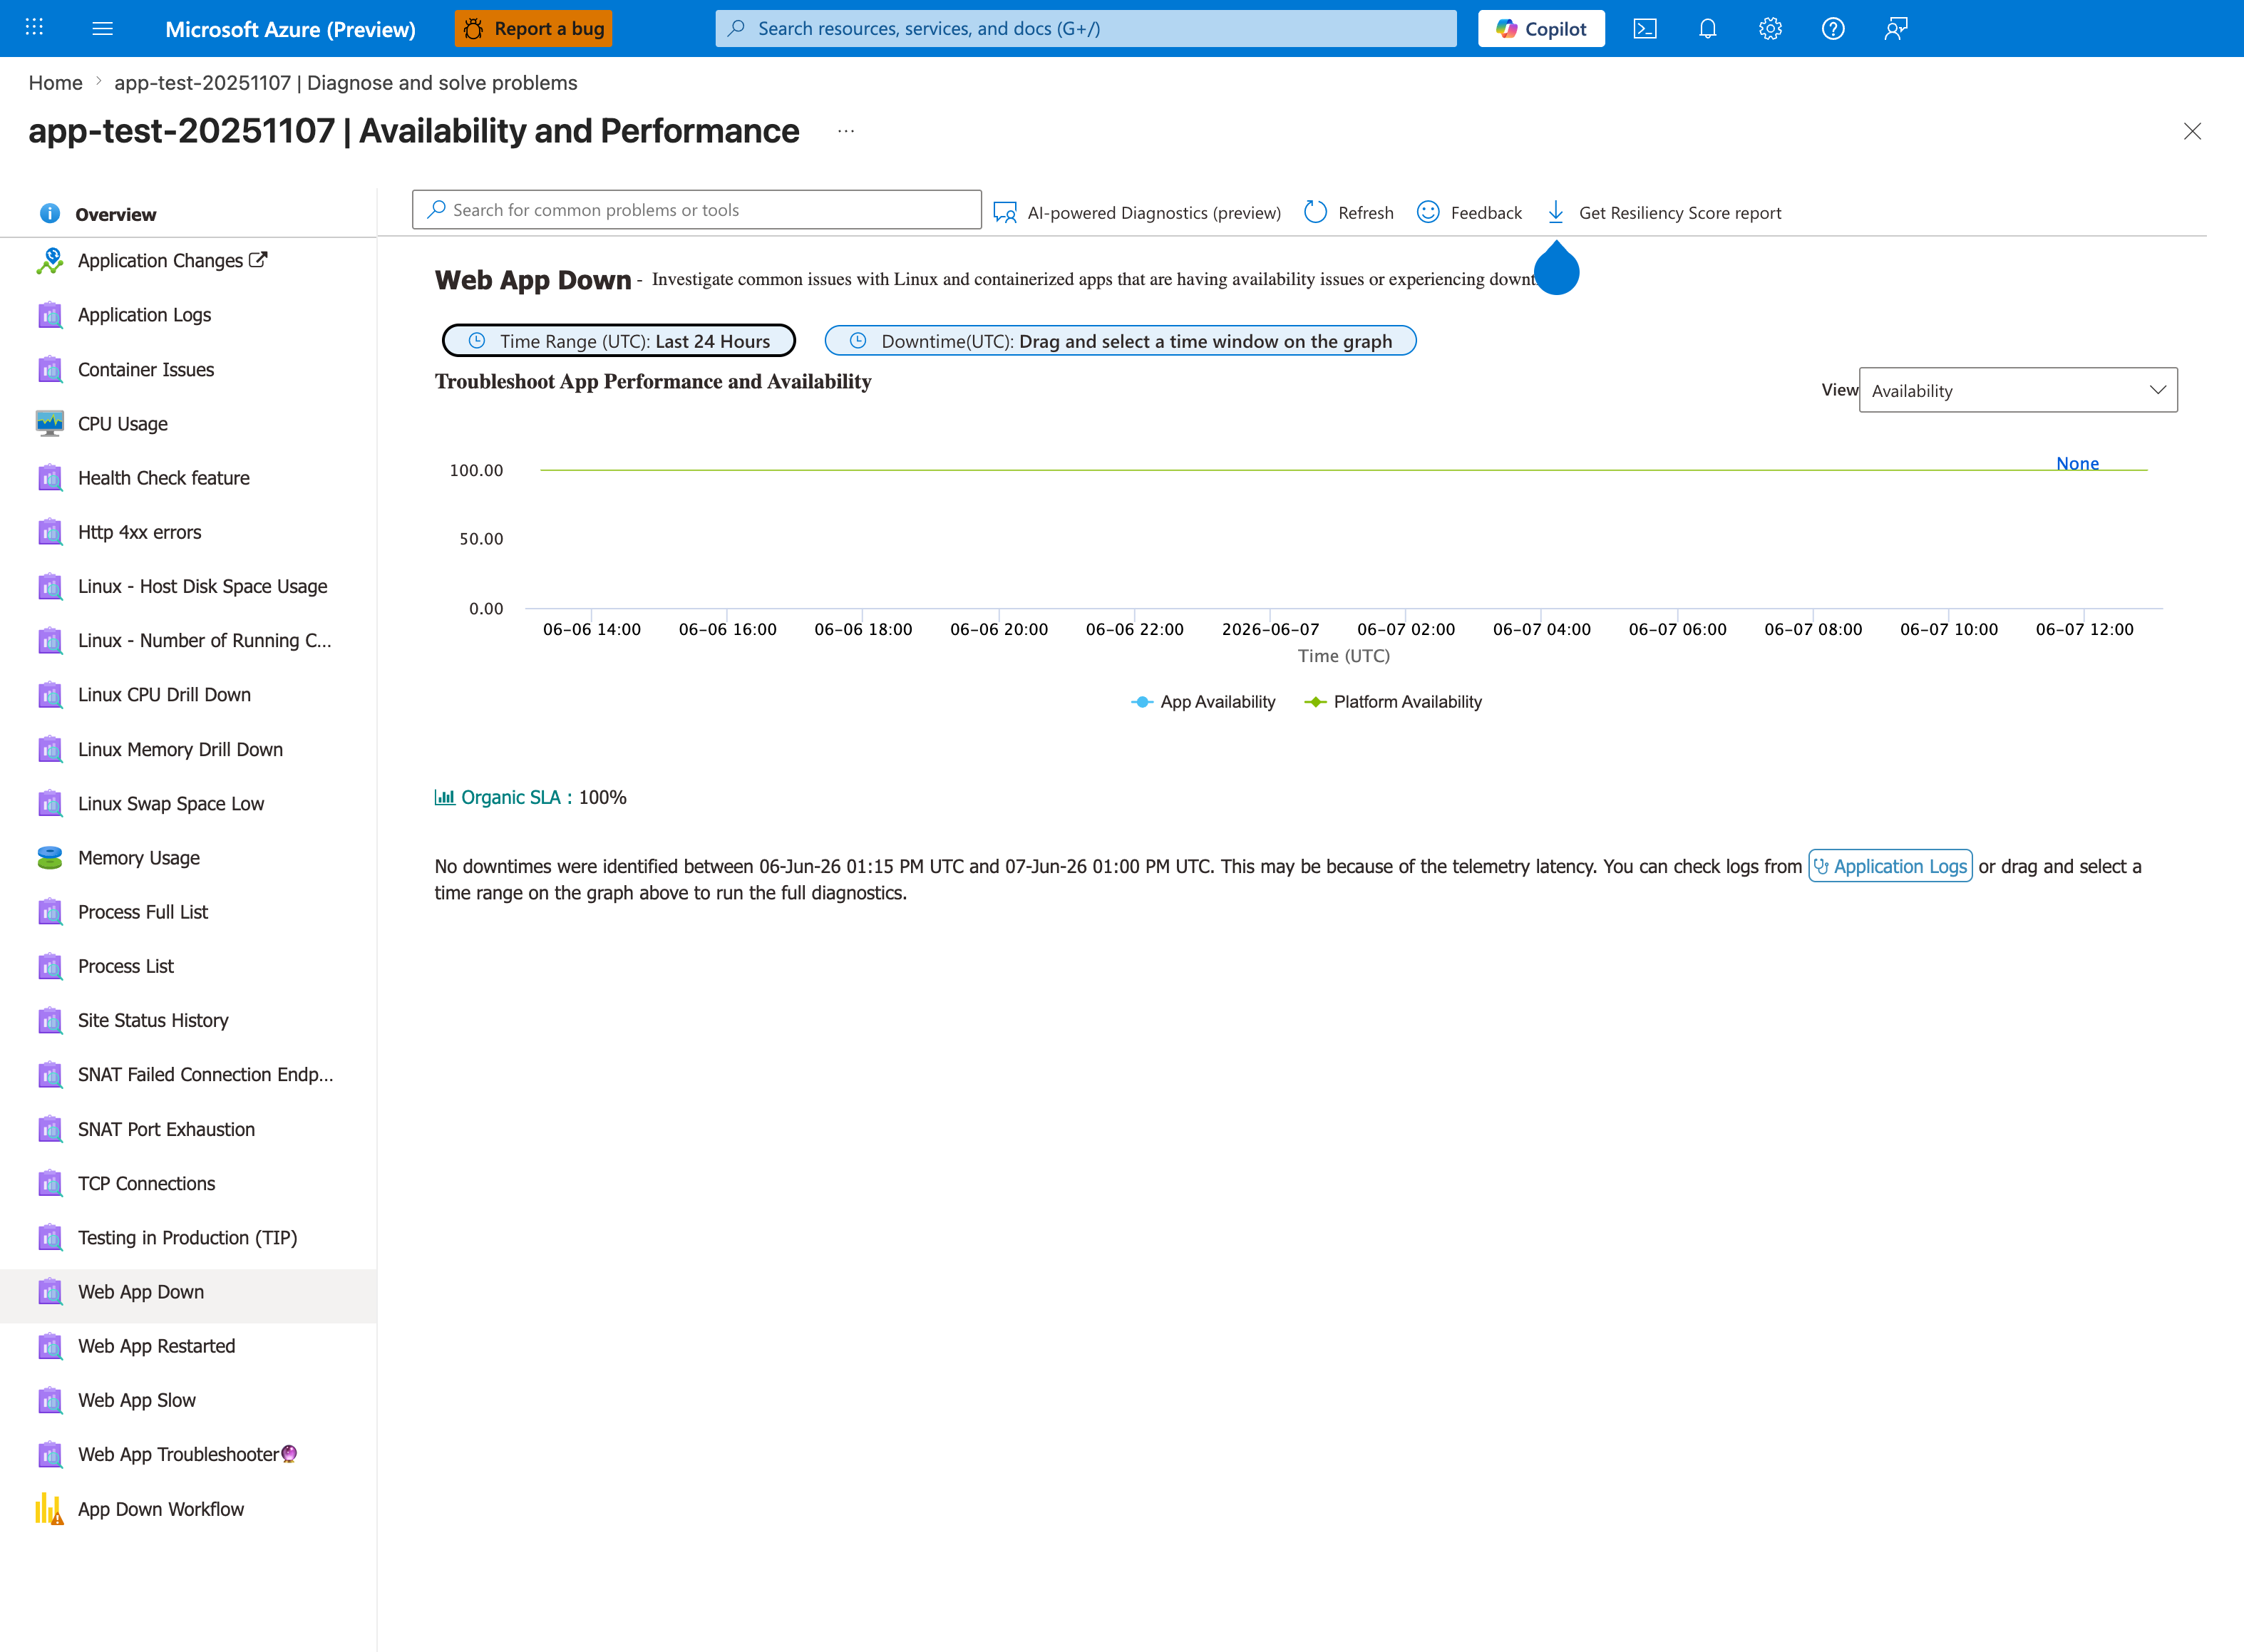
The Web App Down detector is the deceptive baseline reading that traps inexperienced responders on this failure mode. Both App Availability and Platform Availability tiles read 100% and the green banner declares No downtimes were identified for this Web App in the last 24 hours - because the container is technically running and the platform is healthy, the detector cannot mark availability as degraded even when every request returns 502/503 from the front-end proxy. The actual fault (failed to forward request between the proxy and 127.0.0.1:8000) surfaces one or two detectors deeper in the left rail: Container Issues, Web App Restarted, and HTTP Server Errors are the right next clicks. Always pair this detector reading with the KQL queries in section 3.9 - AppServicePlatformLogs and AppServiceHTTPLogs show the proxy-side error truth this top-level detector understates.
2) Hypothesis
2.1 Statement (falsifiable)
Hypothesis:
When a Gunicorn process binds to 127.0.0.1 instead of 0.0.0.0, the App Service reverse proxy cannot forward requests to the container, resulting in container didn't respond to HTTP pings-class startup/probe failures.
2.2 Causal chain under test
flowchart TD
    A[Startup command uses 127.0.0.1] --> B[Gunicorn reachable only on loopback]
    B --> C[Platform warmup probe cannot reach app]
    C --> D[Startup timeout / ContainerTimeout logs]
    D --> E[HTTP 503 and curl 000 symptoms]
    E --> F[Change bind to 0.0.0.0]
    F --> G[Proxy forwarding restored]
    G --> H[Health endpoint 200]

    style A fill:#ef6c00,color:#fff
    style D fill:#d84315,color:#fff
    style H fill:#2e7d32,color:#fff
2.3 Proof criteria
All must be observed:
- Baseline startup command shows
--bind=127.0.0.1:8000. - Failure probes show
000and/or HTTP logs show sustained503with longTimeTaken. - Platform logs contain startup probe timeout and container timeout language.
- Post-fix diagnostics show effective bind as
0.0.0.0:8000. - Post-fix health reaches HTTP 200.
2.4 Disproof criteria
Any one disconfirms the hypothesis for this run:
- Startup command was already
0.0.0.0before failures. - Platform logs show a different root cause (for example image pull failure) with no probe timeout pattern.
- Switching bind to
0.0.0.0does not restore reachability.
2.5 Confounders and interpretation notes
| Confounder | Handling in this guide |
|---|---|
| Deployment restart noise | Use artifact timestamps and compare before/after bind evidence |
| Delayed warmup completion | Distinguish immediate probe file vs later postfix diagnostics |
| Log query window overlap | Use bind-specific artifacts (diag-bind, diag-env) for decisive state |
3) Runbook
This runbook reproduces the failure and verifies fix using long-form flags.
3.1 Prerequisites
| Tool | Check command |
|---|---|
| Azure CLI | az version |
| Bash | bash --version |
| jq | jq --version |
| Authenticated account | az account show |
3.2 Variables
export RG="rg-lab-forward"
export LOCATION="koreacentral"
export TEMPLATE_FILE="labs/failed-to-forward-request/main.bicep"
3.3 Deploy infrastructure
az group create --name "$RG" --location "$LOCATION"

az deployment group create \
  --resource-group "$RG" \
  --template-file "$TEMPLATE_FILE" \
  --parameters baseName="labfwd"
3.4 Resolve app name and URL
export APP_NAME=$(az webapp list \
  --resource-group "$RG" \
  --query "[0].name" \
  --output tsv)

export APP_HOST=$(az webapp show \
  --resource-group "$RG" \
  --name "$APP_NAME" \
  --query "defaultHostName" \
  --output tsv)

export APP_URL="https://$APP_HOST"
3.5 Confirm baseline startup command
az webapp config show \
  --resource-group "$RG" \
  --name "$APP_NAME" \
  --query "appCommandLine" \
  --output tsv
Expected failure-mode baseline:
3.6 Deploy app package
az webapp deploy \
  --resource-group "$RG" \
  --name "$APP_NAME" \
  --src-path "labs/failed-to-forward-request/app" \
  --type zip \
  --restart true
3.7 Trigger script (reproduce + fix)
Script behavior summary:
- Deploys app code.
- Calls app while bind is
127.0.0.1. - Applies startup fix:
--bind=0.0.0.0:8000. - Polls
/healthfor recovery.
3.8 Manual probe loop (optional)
Before fix:
for attempt in $(seq 1 5); do
  curl \
    --silent \
    --show-error \
    --max-time 15 \
    --output /dev/null \
    --write-out "%{http_code},%{time_total}\n" \
    "$APP_URL/"
done
Apply fix explicitly:
az webapp config set \
  --resource-group "$RG" \
  --name "$APP_NAME" \
  --startup-file "gunicorn --bind=0.0.0.0:8000 --timeout=120 --workers=2 app:app"
After fix:
for attempt in $(seq 1 12); do
  curl \
    --silent \
    --show-error \
    --max-time 15 \
    --output /dev/null \
    --write-out "%{http_code},%{time_total}\n" \
    "$APP_URL/health"
  sleep 5
done
3.9 KQL queries
Portal view: Log stream (live bind-address tail)
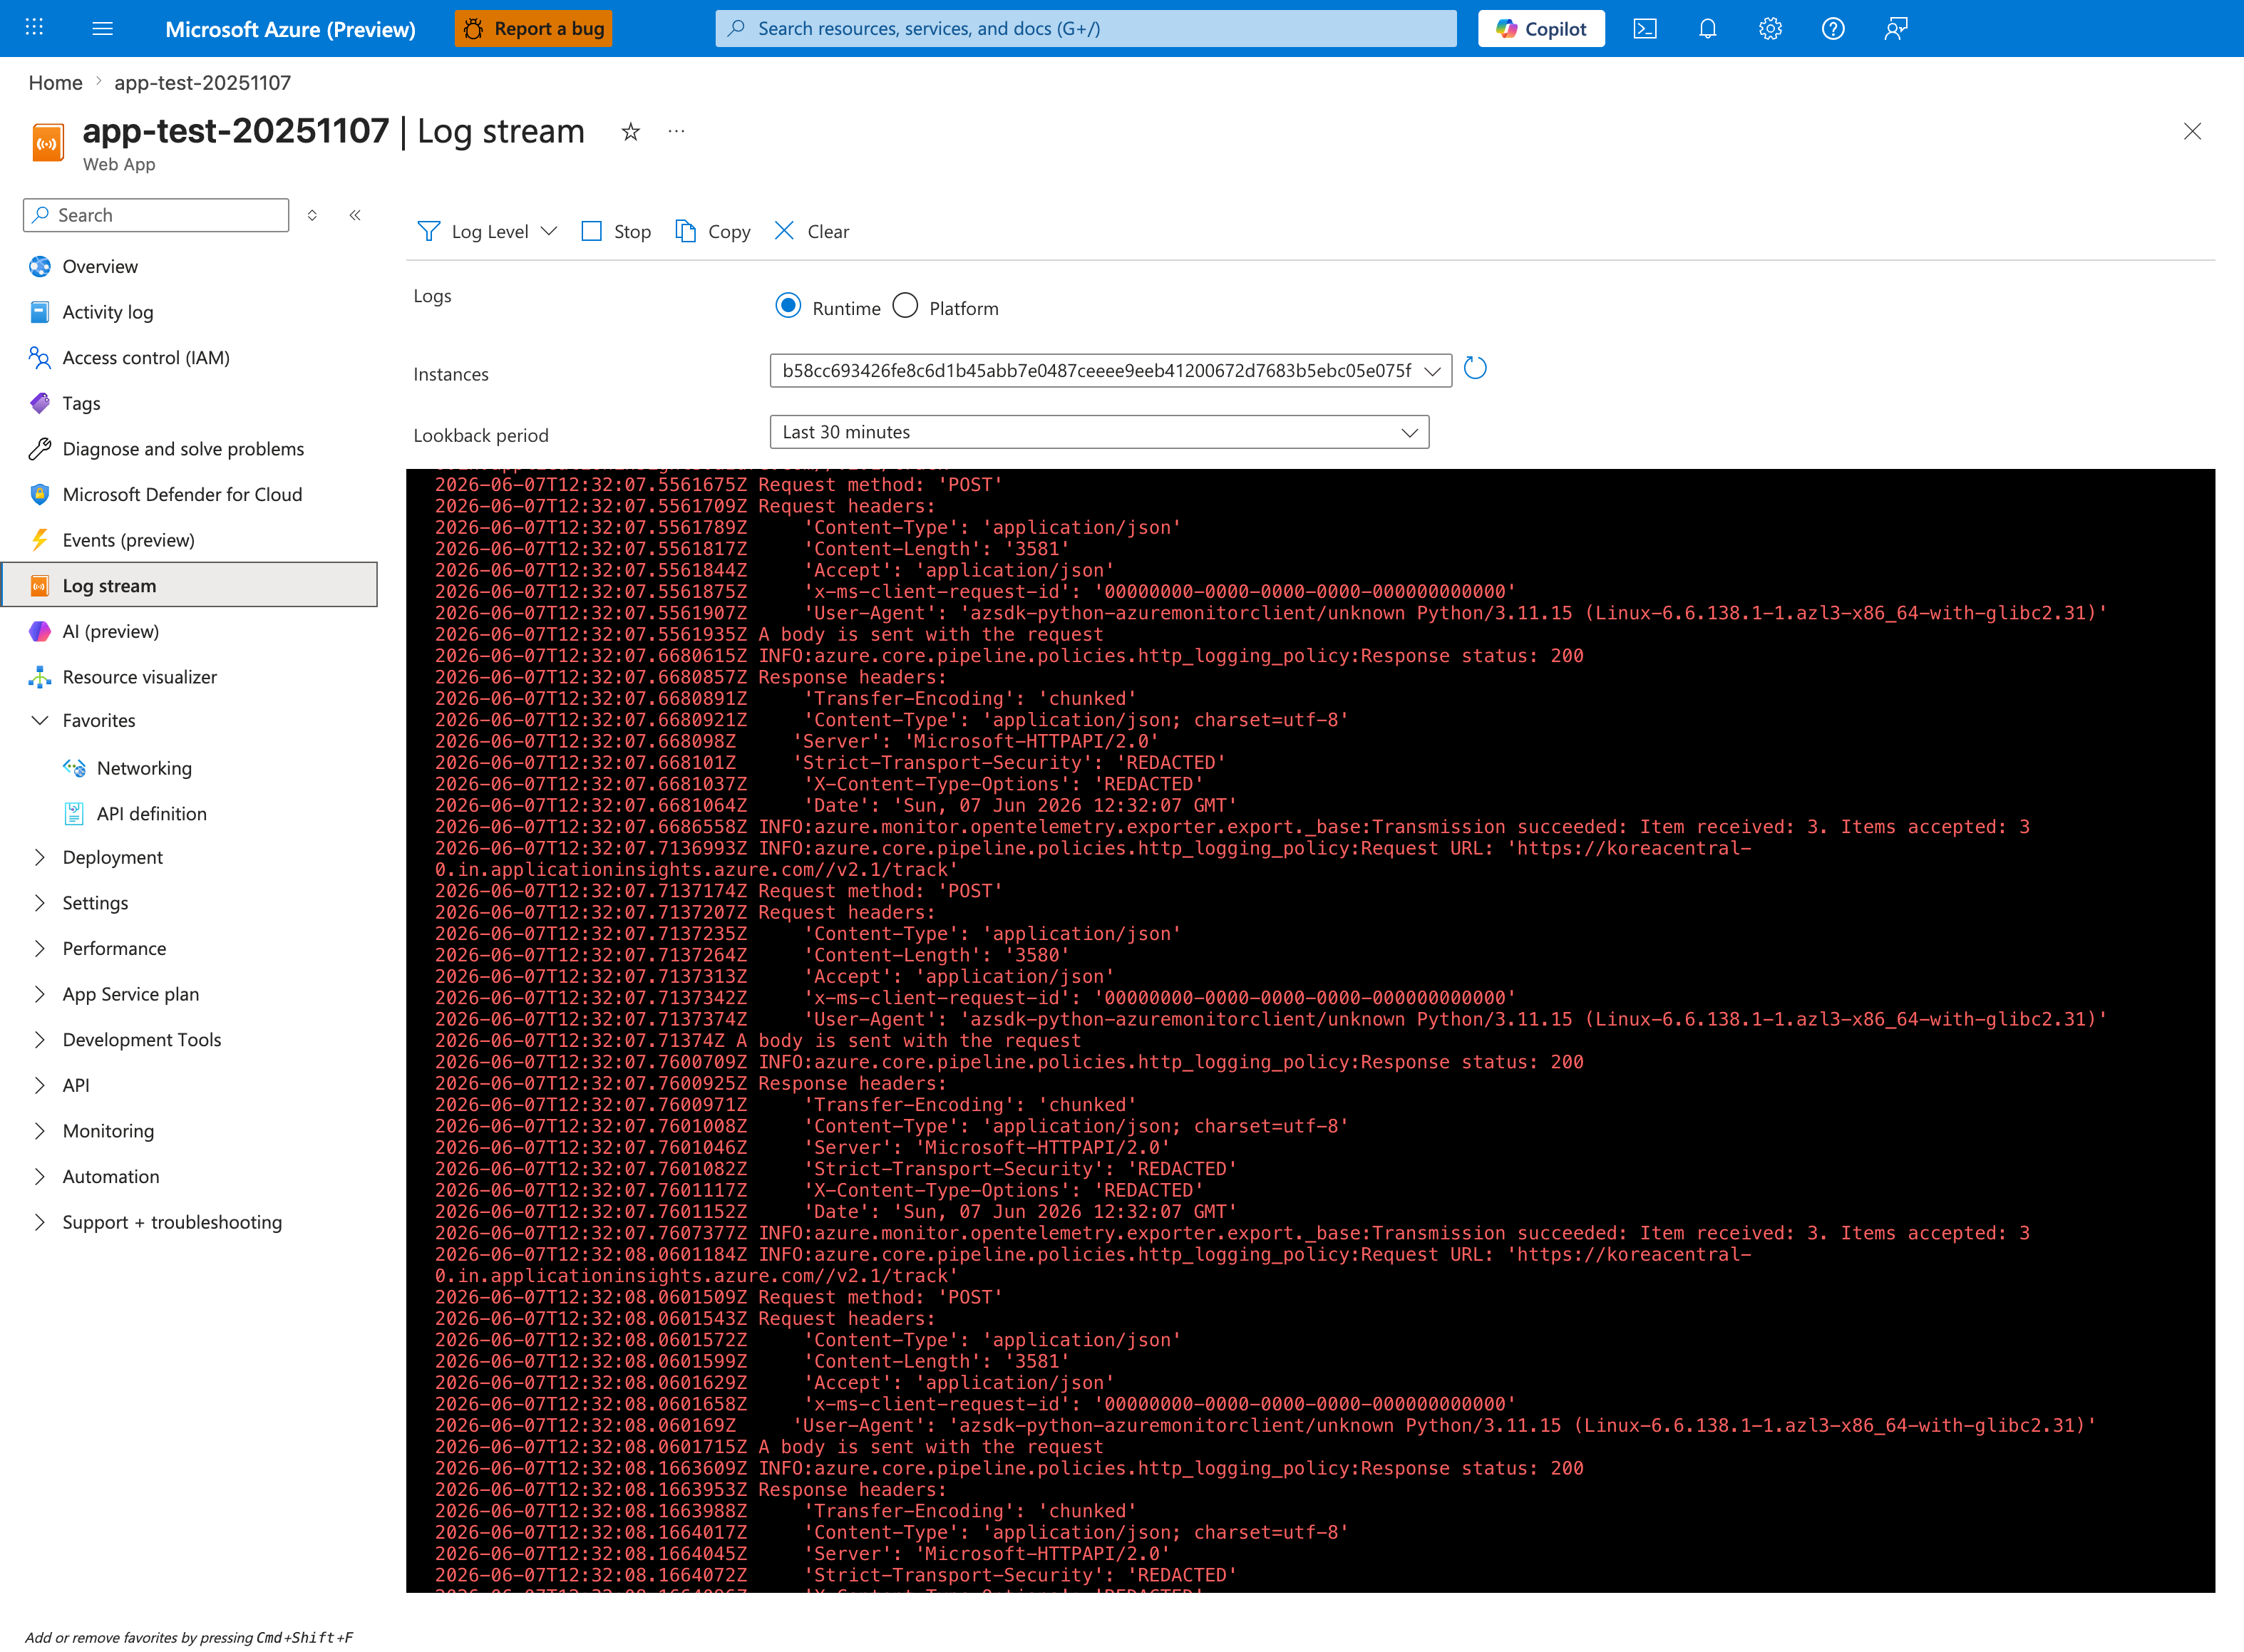
The Log stream blade is the quickest place to confirm whether your app bound to a host the platform proxy can reach. This capture shows the Runtime radio selected and the Instances dropdown pinned to a single worker hash (b58cc693...) - the correct posture for catching the application's listen-port banner from one Gunicorn process without interleaving. Toggle to the Platform radio when you want the front-end proxy's startup probe and warmup messages instead; the Lookback period: Last 30 minutes setting comfortably spans the application's bind-and-listen sequence. Once the bind-address evidence is visible here in real time, the KQL queries below let you quantify the resulting HTTP 502 / 503 rates from AppServiceHTTPLogs for after-the-fact reporting.
HTTP behavior
AppServiceHTTPLogs
| where TimeGenerated > ago(2h)
| where CsUriStem in ("/", "/health", "/diag/stats", "/diag/env", "/diag/bind")
| project TimeGenerated, CsUriStem, ScStatus, TimeTaken, CsHost
| order by TimeGenerated desc
Platform startup/probe behavior
AppServicePlatformLogs
| where TimeGenerated > ago(2h)
| where Message has_any (
    "startup probe failed",
    "Container did not start within expected time limit",
    "Pinging warmup path",
    "Failed to start site"
)
| project TimeGenerated, Level, Message
| order by TimeGenerated desc
Console startup bind evidence
AppServiceConsoleLogs
| where TimeGenerated > ago(2h)
| where ResultDescription has_any (
    "Site's appCommandLine",
    "Listening at:",
    "Starting gunicorn"
)
| project TimeGenerated, ResultDescription
| order by TimeGenerated desc
3.10 Post-fix verification endpoints
curl --silent --show-error "$APP_URL/health"
curl --silent --show-error "$APP_URL/diag/stats"
curl --silent --show-error "$APP_URL/diag/env"
curl --silent --show-error "$APP_URL/diag/bind"
Expected post-fix:
/healthreturns HTTP 200./diag/bindinfersgunicorn_bind_from_cmdlineas0.0.0.0:8000.
4) Experiment Log
This section uses real files from:
labs/failed-to-forward-request/artifacts-sanitized/
4.1 Artifact inventory used
| Category | File |
|---|---|
| Baseline | baseline/app-config.json |
| Baseline | baseline/startup-command.txt |
| Baseline | baseline/app-state.json |
| Trigger | trigger/startup-cmd-before-20260404T054545Z.txt |
| Trigger | trigger/failure-probes-20260404T054545Z.csv |
| Trigger | trigger/recovery-probes-20260404T054545Z.csv |
| Trigger | trigger/kql-http-20260404T060610Z.json |
| Trigger | trigger/kql-console-20260404T060610Z.json |
| Trigger | trigger/kql-platform-20260404T060610Z.json |
| Postfix | postfix/diag-bind-20260404T055117Z.json |
| Postfix | postfix/diag-env-20260404T055117Z.json |
| Postfix | postfix/diag-stats-20260404T055117Z.json |
| Postfix | postfix/health-20260404T055117Z.json |
4.2 Baseline evidence
4.2.1 Baseline startup command
Source: baseline/startup-command.txt
Source: baseline/app-config.json (appCommandLine)
This fully satisfies proof criterion #1 (faulting bind present pre-trigger).
4.2.2 Baseline app-state artifact
baseline/app-state.json is empty in this dataset. This does not block diagnosis because startup command state is already captured in two independent artifacts.
4.3 Trigger probe evidence
4.3.1 Failure probes
Source: trigger/failure-probes-20260404T054545Z.csv
Rows:
1,000000,2026-04-04T05:46:16Z
2,000000,2026-04-04T05:46:29Z
3,000000,2026-04-04T05:46:41Z
4,000000,2026-04-04T05:46:54Z
5,000000,2026-04-04T05:47:07Z
Summary:
| Metric | Value |
|---|---|
| Probe attempts | 5 |
Transport failures (000000) | 5 |
| Successes | 0 |
4.3.2 Recovery probes
Source: trigger/recovery-probes-20260404T054545Z.csv
Rows:
Summary:
| Metric | Value |
|---|---|
| Probe attempts | 3 |
Transport failures (000000) | 3 |
Important interpretation:
- Recovery probe capture appears to have occurred during restart/warmup churn.
- Postfix diagnostics (below) later prove successful recovery and corrected bind.
4.4 HTTP KQL analysis
Source: trigger/kql-http-20260404T060610Z.json
Dataset summary:
| Metric | Value |
|---|---|
| Total rows | 34 |
| Status 200 | 14 |
| Status 202 | 2 |
| Status 499 | 3 |
| Status 503 | 15 |
503 rows with TimeTaken >= 60000ms | 15 |
Interpretation:
- Long-duration
503rows align with startup forwarding failures. - Later
200rows on/healthand diag endpoints indicate eventual recovery.
Representative sequence from the same dataset:
| Time (UTC) | URI | Status | TimeTaken (ms) |
|---|---|---|---|
| 05:49:48 | / | 503 | 242197 |
| 05:49:48 | / | 503 | 221425 |
| 05:49:48 | /health | 503 | 126898 |
| 05:51:02 | /health | 499 | 40052 |
| 05:51:05 | /health | 200 | 17 |
| 05:51:20 | /health | 200 | 5 |
4.5 Console KQL analysis (bind evidence)
Source: trigger/kql-console-20260404T060610Z.json
Rows: 47
Key lines:
Site's appCommandLine: gunicorn --bind=127.0.0.1:8000 --timeout=120 --workers=2 app:app
[2026-04-04 05:55:02 +0000] [1896] [INFO] Listening at: http://127.0.0.1:8000 (1896)
Interpretation:
- Confirms runtime listener used loopback during failing phase.
- This supports the exact hypothesized mechanism.
4.6 Platform KQL analysis (startup/probe timeout evidence)
Source: trigger/kql-platform-20260404T060610Z.json
Rows: 200
Signal counts (from this snapshot):
| Pattern | Count |
|---|---|
Messages containing Container did not start within expected time limit | 24 |
| Messages containing warmup/startup probe timeout language | 15 |
Representative platform messages:
Site startup probe failed after 231.0055547 seconds.
State: Starting, Action: WaitingForSiteWarmUpProbeSuccess, LastError: ContainerTimeout ...
Failed to start site. Revert by stopping site.
This satisfies proof criterion #3.
4.7 Postfix diagnostics (recovery and fixed bind)
4.7.1 Bind corrected to 0.0.0.0
Source: postfix/diag-bind-20260404T055117Z.json
Core fields:
| Field | Value |
|---|---|
gunicorn_bind_from_cmdline | 0.0.0.0:8000 |
cmdline.argv includes | --bind=0.0.0.0:8000 |
port_env | 8000 |
Raw excerpt:
{"gunicorn_bind_from_cmdline":"0.0.0.0:8000","cmdline":{"argv":["...","gunicorn","--bind=0.0.0.0:8000","--timeout=120","--workers=2","app:app"]}}
4.7.2 Health recovered
Source: postfix/health-20260404T055117Z.json
4.7.3 Process stats after recovery
Source: postfix/diag-stats-20260404T055117Z.json
{"endpoint_counters":{"health":1},"pid":1898,"process_start_time":"2026-04-04T05:51:00.340146+00:00","request_count":2,"uptime_seconds":17.466}
4.8 Experiment timeline (reconstructed)
timeline
    title Failed-to-forward-request lab timeline
    05:46:16 : Failure probes start returning 000
    05:47:07 : Failure probe series still all 000
    05:48:03 : Recovery probe capture begins (still 000 during churn)
    05:49:48 : HTTP logs show long 503 responses
    05:51:02 : Transitional 499 entries on /health
    05:51:05 : /health returns 200 in HTTP logs
    05:55:xx : Postfix diagnostics confirm 0.0.0.0:8000 bind
4.9 Data quality notes
| Observation | Impact | Resolution |
|---|---|---|
baseline/app-state.json empty | Minor | Baseline still confirmed by config + startup-command files |
Recovery probe CSV remains 000000 | Medium | Use postfix diag and HTTP logs to confirm eventual recovery |
| Console snapshot emphasizes failing bind | None | Postfix artifacts provide corrected bind evidence |
4.10 Hypothesis verdict
| Proof criterion | Status | Evidence |
|---|---|---|
| Baseline bad bind present | ✅ Met | baseline/startup-command.txt, app-config.json |
| Failure surface observed | ✅ Met | failure probes all 000000, HTTP 503 long tail |
| Platform startup timeout signals | ✅ Met | 24 timeout-related platform messages |
| Post-fix bind corrected | ✅ Met | postfix/diag-bind... shows 0.0.0.0:8000 |
| Post-fix health success | ✅ Met | postfix/health... returns {"status":"healthy"} |
Final verdict: Hypothesis supported by artifacts.
4.11 Root-cause statement
The dominant root cause in this lab run is startup command misbinding (127.0.0.1) that prevented successful proxy forwarding/warmup. Changing listener bind to 0.0.0.0:8000 restored endpoint reachability.
4.12 Recommended production guardrails
| Guardrail | Why |
|---|---|
| Standardize startup command templates | Prevent accidental loopback bind regressions |
Add synthetic /health monitor | Detect warmup/forwarding issues quickly |
| Alert on startup probe timeout platform logs | Catch failures before customer reports |
| Add config drift checks in CI/CD | Verify bind and port settings pre-release |
4.13 Suggested continuous validation checklist
Before each deployment to Linux App Service:
- Validate startup command bind address is
0.0.0.0. - Validate listener port matches expected platform port (
8000in this lab). - Deploy and check
/healthexternally. - Query platform logs for startup probe anomalies in first 10 minutes.
- Record artifact snapshot for incident regression history.
Expected Evidence
This section defines what you SHOULD observe at each phase of the lab. Use it to validate your investigation is on track.
Before Trigger (Baseline)
| Evidence Source | Expected State | What to Capture |
|---|---|---|
Deployment APIs (/api/zipdeploy, deployment status) | Deployment path succeeds (200/202) before runtime symptom appears | Deployment status responses and timestamps |
| Startup command config | Gunicorn is configured with loopback bind | gunicorn --bind=127.0.0.1:8000 --timeout=120 --workers=2 app:app |
| Baseline app config artifacts | App configuration shows intended runtime but bad bind target | baseline/startup-command.txt and baseline/app-config.json |
During Incident
| Evidence Source | Expected State | Key Indicator |
|---|---|---|
| AppServiceHTTPLogs | User traffic is not successfully forwarded | Only SCM/Kudu traffic appears or user-path requests fail/timeout |
| AppServiceConsoleLogs | App process starts but listens on localhost only | Listening at: http://127.0.0.1:8000 |
| AppServicePlatformLogs | Platform treats startup as failed due to unreachable warmup path | CancellingStartup, LastError: ContainerTimeout and probe-timeout messages |
After Recovery
| Evidence Source | Expected State | Key Indicator |
|---|---|---|
| Startup command config | Bind address corrected for platform reachability | --bind=0.0.0.0:8000 |
/health and diagnostics endpoints | Endpoint reachability restored | HTTP 200 responses resume |
| Postfix bind evidence | Runtime cmdline reflects corrected bind | gunicorn_bind_from_cmdline: 0.0.0.0:8000 |
Evidence Timeline
graph TD
    A[Baseline Capture] --> B[Trigger Fault]
    B --> C[During: Collect Evidence]
    C --> D[After: Compare to Baseline]
    D --> E[Verdict: Confirmed/Falsified]
Evidence Chain: Why This Proves the Hypothesis
Falsification Logic
If you observe deployment success, console logs showing Gunicorn listening on 127.0.0.1:8000, and platform startup timeout/cancellation signals, the hypothesis is CONFIRMED because the app process is running but unreachable to the App Service forwarding/warmup path.
If you do NOT observe localhost-only bind evidence (for example bind is already 0.0.0.0), the hypothesis is FALSIFIED — consider alternatives such as wrong startup module, port mismatch, or image/runtime startup failure.