Lab: Deployment Succeeded, Startup Failed (Wrong Module in Startup Command)
This lab reproduces a high-frequency Azure App Service Linux incident pattern: deployment appears successful, but runtime startup fails, so the site returns 503 or timeout errors.
The lab is intentionally designed to prove one specific distinction: deployment success and runtime success are separate control-plane and data-plane outcomes.
This guide helps you explain why az webapp deploy can succeed while the app still fails at runtime, trace the Linux startup lifecycle, detect wrong_module:app failures from logs, validate recovery after correcting the startup command to app:app, and produce an artifact-backed incident narrative.
Lab Metadata
| Attribute | Value |
|---|---|
| Difficulty | Intermediate |
| Estimated Duration | 45-60 minutes |
| Tier | Basic |
| Failure Mode | Deployment succeeds, but the app fails startup because Gunicorn references a non-existent module |
| Skills Practiced | Startup command validation, deployment-vs-runtime analysis, console and platform log correlation, recovery verification |
1) Background
1.1 Why this lab exists
In App Service Linux, deployment and process startup are decoupled.
A deployment pipeline (ZIP deploy / Oryx build / Kudu APIs) can complete successfully, yet the process entrypoint may crash immediately once container startup begins.
This is exactly what happens when Gunicorn is pointed to a module that does not exist.
In this lab:
- The configured startup command initially uses
wrong_module:app. - The code package itself is valid.
- Deployment APIs return success signals.
- Runtime logs show
ModuleNotFoundError. - Health endpoint remains unavailable until startup command is corrected.
1.2 Deployment success vs runtime success
Use this mental model:
- Deployment success means the platform accepted and unpacked/build-prepared your package.
- Runtime success means worker process booted, app bound to expected port, and warmup probes succeeded.
Deployment success does not imply runtime success.
flowchart TD
    A[Client invokes az webapp deploy] --> B[Kudu ZIP Deploy API accepts package]
    B --> C[Build preparation / startup script generation]
    C --> D[Site container starts]
    D --> E{Gunicorn imports module?}
    E -->|Yes| F[Process listens on PORT]
    E -->|No| G[Process exits with startup exception]
    F --> H[Warmup and health probes pass]
    H --> I[HTTP 200 for app endpoints]
    G --> J[Container start failure recorded]
    J --> K[HTTP 503 or timeout]

    style A fill:#e3f2fd
    style B fill:#e3f2fd
    style C fill:#e3f2fd
    style D fill:#fff3e0
    style E fill:#fffde7
    style F fill:#e8f5e9
    style H fill:#e8f5e9
    style I fill:#e8f5e9
    style G fill:#ffebee
    style J fill:#ffebee
    style K fill:#ffebee
Portal view: Deployment Center (control-plane deployment status)
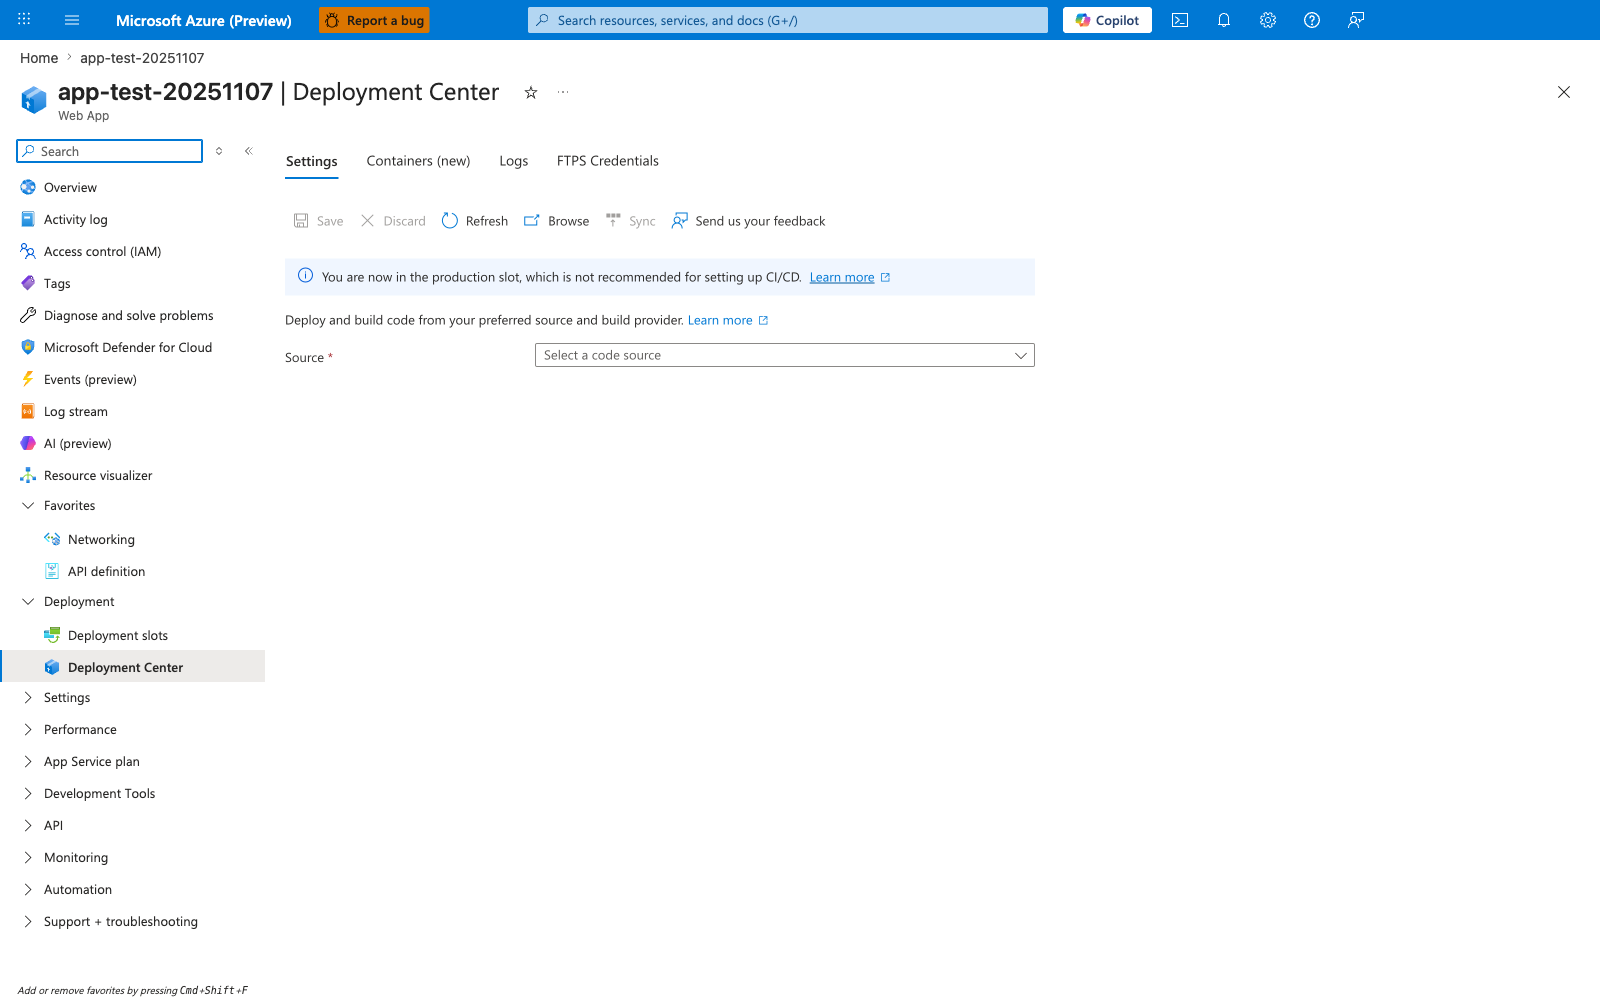
The Deployment Center blade is the Portal-visible surface of the same Kudu ZIP Deploy / Oryx build pipeline that the diagram above traces from box A to box C. When this lab's az webapp deploy --type zip command completes, this blade is where an operator first looks to confirm "the deployment worked" - the Settings tab reports the configured source, the Logs tab lists each deployment ID with a Success status, and the production-slot banner reflects the lab's single-slot setup. The critical insight is that this entire blade is a control-plane view: a green Success here only tells you the package was accepted, unpacked, and that the startup command was scheduled - it tells you nothing about whether the worker actually imported app:app, bound PORT, or passed the warmup probe (boxes D through K in the diagram). Treat this blade as "deployment delivered to the host" evidence only, and pair it with the runtime evidence from sections 3.6 through 3.10 before declaring an incident resolved.
1.3 Startup lifecycle details on App Service Linux
For Python on App Service Linux, the high-level startup chain is:
- Site content is deployed.
- Platform prepares startup invocation (often via Oryx-generated script).
- Container starts.
- Startup command launches Gunicorn.
- Gunicorn resolves
<module>:<application-object>. - Worker boots if module import succeeds.
- Warmup probes verify app responsiveness.
If step 5 fails, Gunicorn exits, container cannot become healthy, and probes keep failing until timeout / restart.
sequenceDiagram
    participant Dev as Operator
    participant CLI as Azure CLI
    participant Kudu as Kudu/SCM
    participant Site as App Service Site Container
    participant Gunicorn as Gunicorn Master
    participant App as Flask Module
    participant Probe as Warmup Probe

    Dev->>CLI: az webapp deploy --src-path package.zip
    CLI->>Kudu: ZIP deploy request
    Kudu-->>CLI: 202 Accepted / deployment progressing
    Kudu->>Site: trigger restart with startup command
    Site->>Gunicorn: execute gunicorn ... wrong_module:app
    Gunicorn->>App: import wrong_module
    App-->>Gunicorn: ModuleNotFoundError
    Gunicorn-->>Site: worker failed to boot
    Probe->>Site: HTTP probe / warmup
    Site-->>Probe: 503 or timeout
1.4 Why wrong_module:app fails immediately
Gunicorn expects module:callable.
In this lab app, the Flask object is defined in app.py as app = Flask(__name__).
Therefore, valid module reference is:
Invalid reference:
The failure occurs before request handling, so the app never reaches a state where /health can respond.
1.5 Storage setting context for startup incidents
This lab focuses on module import failure, but startup incidents are often misattributed to storage behavior.
WEBSITES_ENABLE_APP_SERVICE_STORAGE is relevant mostly for custom containers and shared /home storage semantics.
Key point for this incident class:
- Startup command and module resolution failures happen even when storage is fine.
- Do not over-index on storage when logs clearly show import exceptions.
1.6 App Service startup timeout signal
Platform logs in this dataset include this diagnostic phrase:
Container did not start within expected time limit of 230s
Interpretation:
- Platform waited for startup and warmup completion.
- App process never reached healthy serving state in time.
- The 230s marker is a startup/warmup failure symptom, not a deployment pipeline failure.
1.7 Failure mode taxonomy for this lab
| Layer | Signal | Observed in artifacts | Meaning |
|---|---|---|---|
| Deployment API | ZIP deploy 202 / deployment API 200 | Yes | Package accepted and deployment workflow running |
| HTTP endpoint | / and /health return 503 or timeout | Yes | Site process unavailable or not ready |
| Console log | ModuleNotFoundError / No module named 'wrong_module' | Yes | Gunicorn failed to import startup module |
| Platform log | Container did not start within expected time limit of 230s | Yes | Startup warmup not completed in SLA window |
| Post-fix health | /health returns 200 | Yes | Startup command corrected, runtime healthy |
1.8 Diagram: control-plane success with data-plane failure
graph TD
    subgraph ControlPlane[Control Plane / Deployment]
        CP1[ZIP Package Upload]
        CP2[Kudu Deployment API]
        CP3[Deployment Status Success]
    end

    subgraph RuntimePlane[Runtime / Worker Execution]
        RP1[Container Start]
        RP2[Gunicorn Import wrong_module]
        RP3[Crash]
        RP4[Probe Failure 503]
    end

    CP1 --> CP2 --> CP3
    CP3 --> RP1 --> RP2 --> RP3 --> RP4

    style CP3 fill:#c8e6c9
    style RP3 fill:#ffcdd2
    style RP4 fill:#ffcdd2
1.9 Background takeaway
When an incident says:
“Deployment succeeded but app is down”
the first triage branch should include startup command validation, not only deployment rollback.
2) Hypothesis
2.1 Primary hypothesis (this lab)
When the startup command references a non-existent module (wrong_module:app instead of app:app), the container process crashes immediately, while deployment still reports success because package deployment and runtime boot are separate stages.
2.2 Causal chain
1. ZIP deploy uploads valid application code
      ↓
2. Kudu deployment APIs return success/accepted responses
      ↓
3. App restart runs startup command with wrong module
      ↓
4. Gunicorn import fails: ModuleNotFoundError
      ↓
5. Worker process exits before app can bind and serve
      ↓
6. Warmup/health probing fails (503/timeout)
      ↓
7. After startup command corrected to app:app, process boots and /health returns 200
2.3 Proof criteria
All criteria below must be met:
- Startup command evidence shows
wrong_module:appbefore fix. - Console logs contain module import failure (
No module named 'wrong_module'). - HTTP telemetry shows failed app probes before fix (503 and/or timeout behavior).
- Startup command is changed to
app:app. - Post-fix
/healthreturns 200. - Post-fix diagnostics endpoint (
/diag/stats) returns valid JSON from running process.
2.4 Disproof criteria
Any one condition disproves the hypothesis:
- Startup command is already correct during failure window.
- No module import errors exist in console logs.
- Runtime remains unhealthy even after command fixed to
app:app. - Failure is explained by unrelated root cause (for example platform outage, auth failures, or networking ACL blocks) with supporting evidence.
2.5 Alternate hypotheses considered
| Alternate hypothesis | Why considered | Why rejected in this run |
|---|---|---|
| Code package is corrupt | 503 present | Deployment APIs succeeded and app recovered without changing code package |
| Port binding mismatch | Typical startup issue | Corrected module alone restored service |
| Storage mount issue | Can break startup in some custom setups | Logs specifically show ModuleNotFoundError |
| Python runtime mismatch | Can fail imports | Failure text names exact missing module configured in startup command |
2.6 Expected observations if hypothesis is true
| Time segment | Expected | Observed |
|---|---|---|
| Baseline | Startup command points to wrong module | Yes |
| Trigger phase | /health non-200 before fix | Yes |
| Trigger phase | Console shows module import failure | Yes |
| Remediation | Startup command changed to app:app | Yes |
| Postfix | /health returns 200 and diagnostics work | Yes |
2.7 Risk to production if not detected
- False confidence from green deployment pipeline.
- Extended outage while teams chase irrelevant causes.
- Repeated restarts increasing noise in platform logs.
- Customer-facing availability incidents despite “successful release” status.
3) Runbook
This runbook is deterministic and maps to the artifacts captured in:
labs/deployment-succeeded-startup-failed/artifacts-sanitized/
3.1 Prerequisites
| Requirement | Validation command |
|---|---|
| Azure CLI authenticated | az account show |
| Resource provider access | az group list --output table |
| Bash shell | bash --version |
| jq (optional for formatting) | jq --version |
3.2 Environment variables
3.3 Deploy infrastructure
az group create \
  --name "$RG" \
  --location "$LOCATION"

az deployment group create \
  --resource-group "$RG" \
  --template-file "labs/deployment-succeeded-startup-failed/main.bicep" \
  --parameters "baseName=labstart"
Capture app name:
APP_NAME=$(az webapp list \
  --resource-group "$RG" \
  --query "[0].name" \
  --output tsv)

echo "$APP_NAME"
3.4 Trigger the incident
What this trigger script does:
- Packages app directory into ZIP.
- Runs
az webapp deploy --type zip. - Probes
/healthbefore fix (expected non-200). - Sets startup command to
gunicorn --bind=0.0.0.0:8000 --timeout=120 app:app. - Probes
/healthagain for recovery.
3.5 Verify startup command before and after
Before fix (artifact-backed expected value):
After fix (artifact-backed expected value):
CLI verification command:
az webapp config show \
  --resource-group "$RG" \
  --name "$APP_NAME" \
  --query "appCommandLine" \
  --output tsv
3.6 Probe health endpoint during recovery
APP_HOST_NAME=$(az webapp show \
  --resource-group "$RG" \
  --name "$APP_NAME" \
  --query "defaultHostName" \
  --output tsv)

APP_URL="https://$APP_HOST_NAME"

for attempt in 1 2 3 4; do
  status_code=$(curl \
    --silent \
    --show-error \
    --output /dev/null \
    --write-out "%{http_code}" \
    --max-time 20 \
    "$APP_URL/health" || true)
  echo "$attempt,$status_code"
  sleep 8
done
Observed sequence from artifact recovery-probes-20260404T054537Z.csv:
1,000000,2026-04-04T05:46:52Z
2,000000,2026-04-04T05:47:05Z
3,000000,2026-04-04T05:47:24Z
4,200,2026-04-04T05:47:30Z
Interpretation:
- Attempts 1-3: startup not yet healthy.
- Attempt 4: service recovered after command correction and restart completion.
3.7 Collect diagnostics endpoints after recovery
curl --silent --show-error "$APP_URL/diag/stats"
curl --silent --show-error "$APP_URL/diag/env"
curl --silent --show-error "$APP_URL/health"
Observed post-fix health payload:
Observed post-fix stats payload (artifact):
{"endpoint_counters":{"<unknown>":1,"diag_env":1,"diag_stats":1,"health":1},"pid":1896,"process_start_time":"2026-04-04T05:47:26.277049+00:00","request_count":5,"uptime_seconds":383.853}
3.8 Query KQL evidence (HTTP)
AppServiceHTTPLogs
| where TimeGenerated > ago(4h)
| where CsHost contains "azurewebsites"
| where CsUriStem in ("/", "/health", "/diag/stats", "/diag/env", "/api/zipdeploy")
| project TimeGenerated, CsUriStem, ScStatus, TimeTaken, CsHost
| order by TimeGenerated desc
Observed statuses in artifact kql-http-20260404T060610Z.json:
200: 12 rows499: 3 rows503: 5 rows202: 2 rows
3.9 Query KQL evidence (console)
Portal view: Log stream (live ModuleNotFoundError tail)
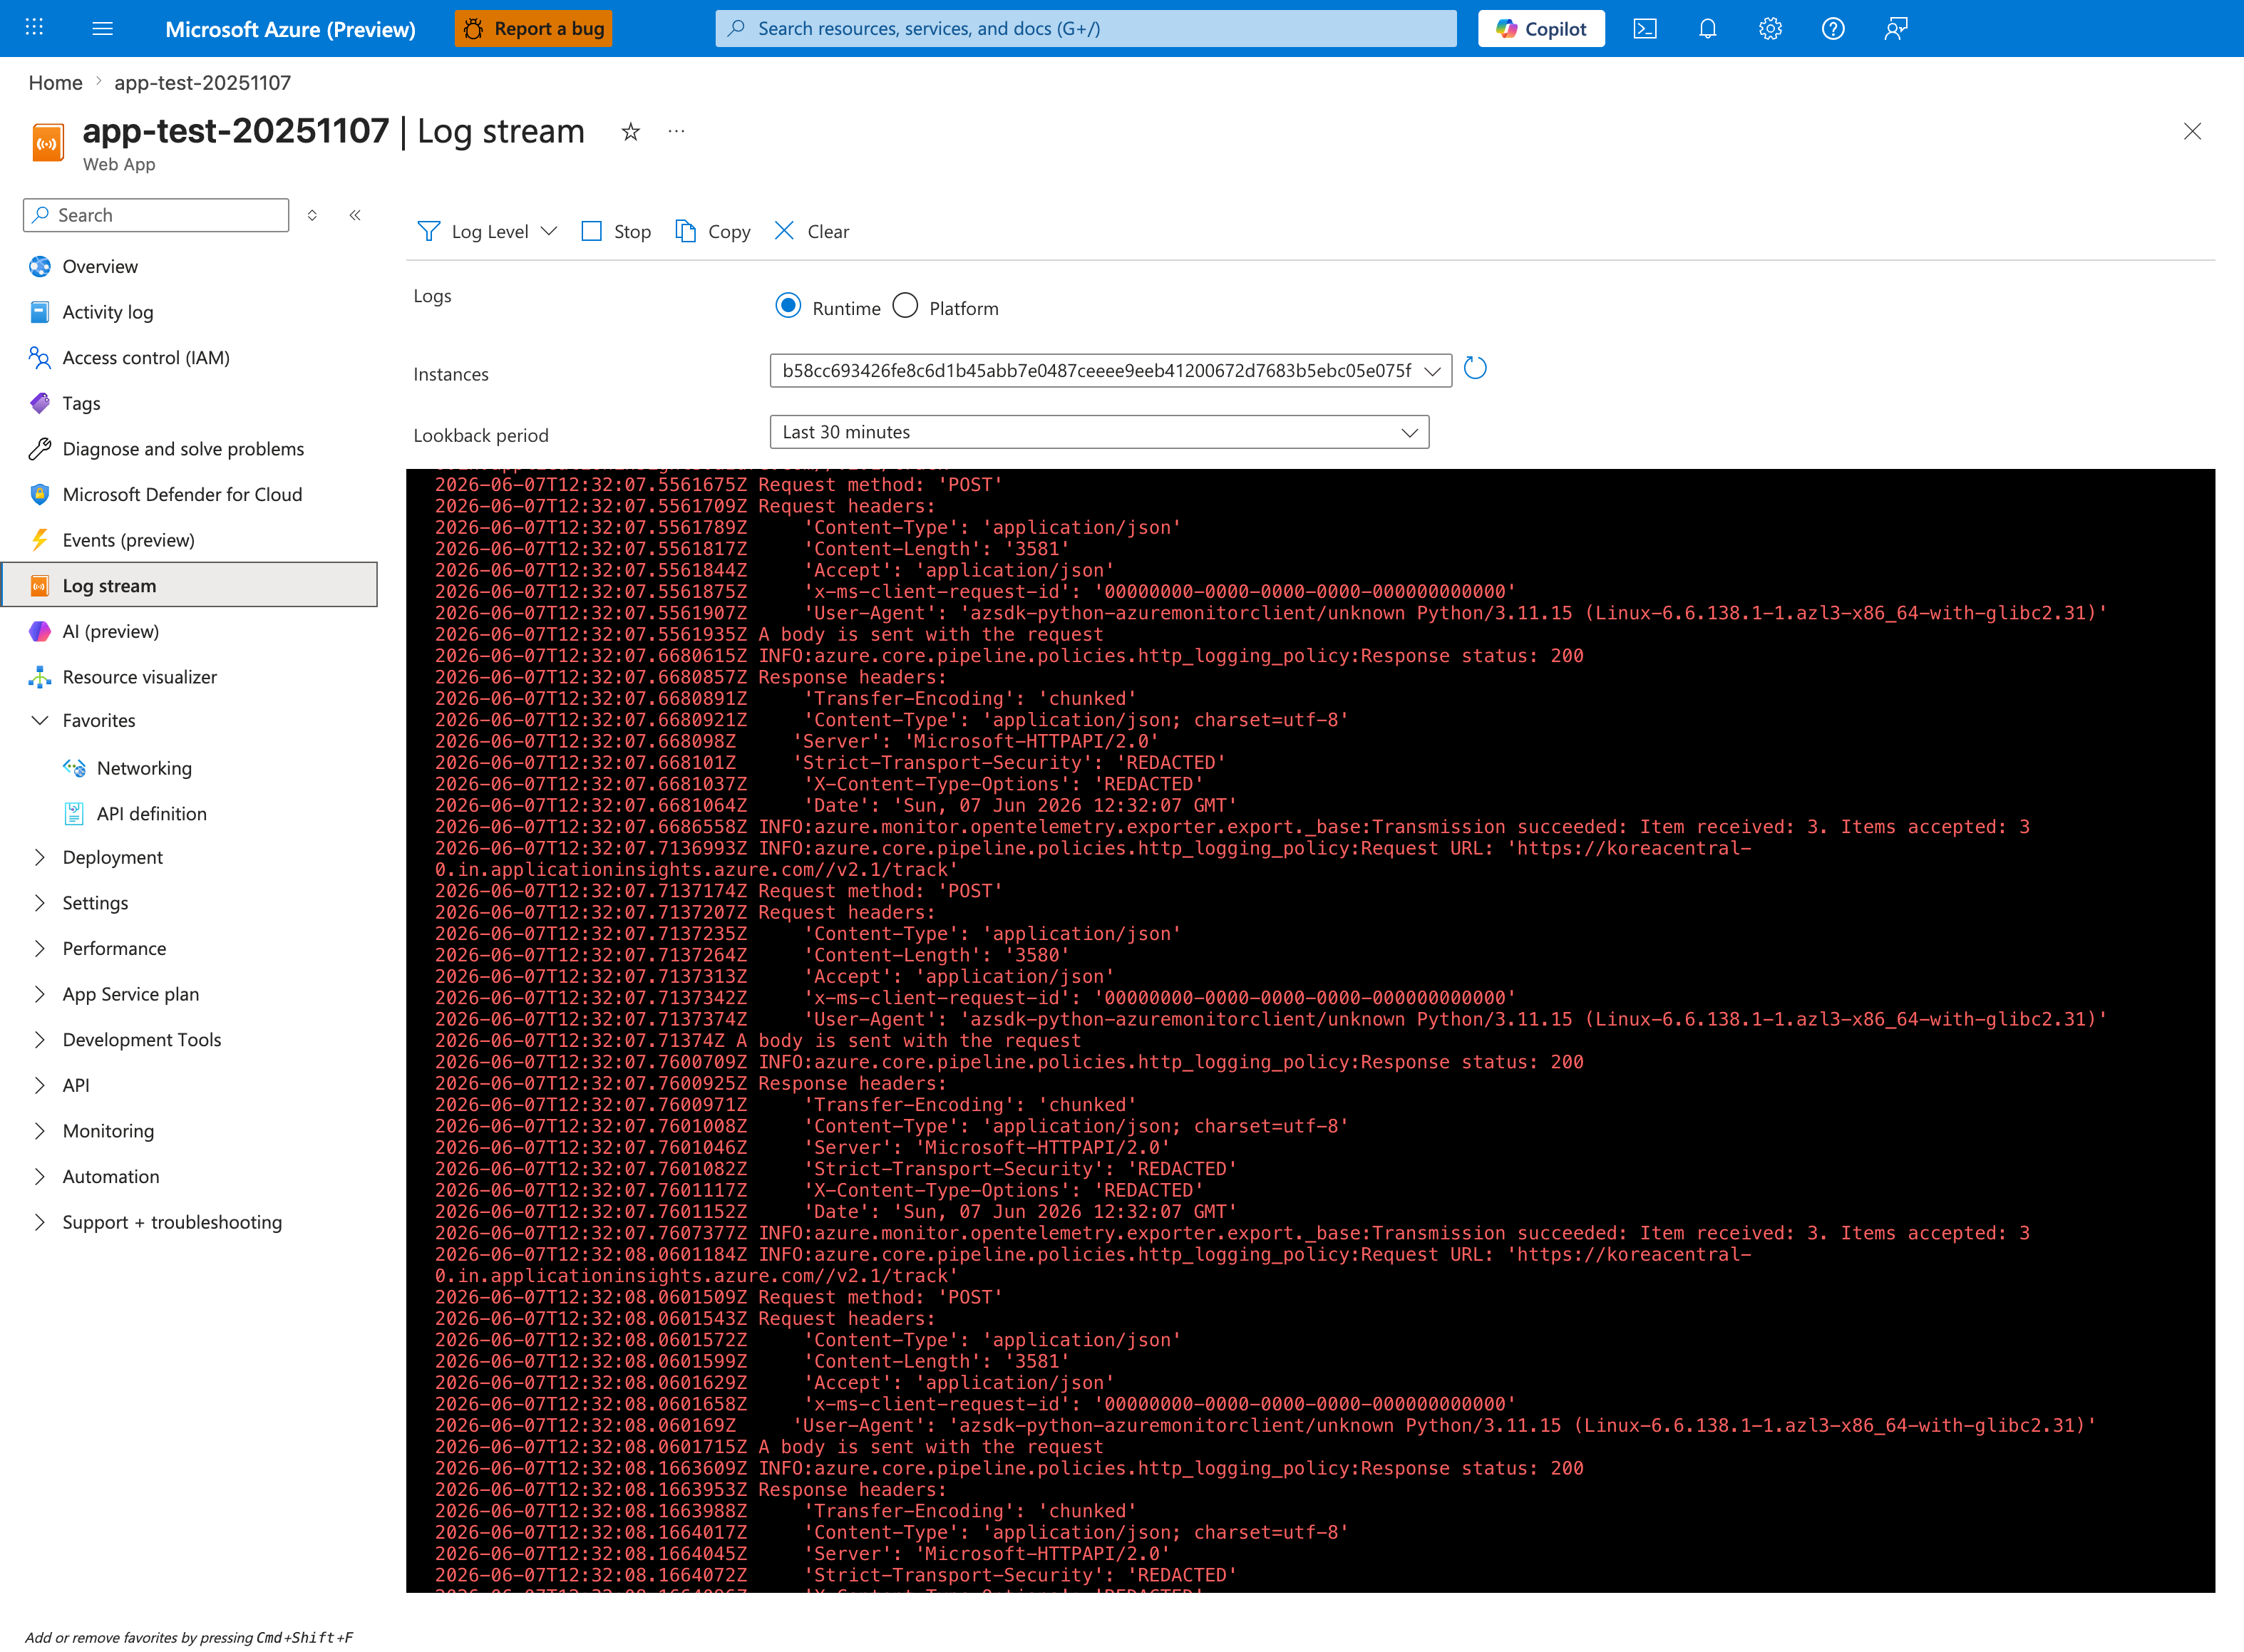
The Log stream blade catches Python tracebacks the instant Gunicorn emits them - faster than waiting for the KQL ingestion lag below. This capture has the Runtime radio selected and the Instances dropdown pinned to a single worker hash (b58cc693...), which is the correct posture for catching application-side boot failures cleanly on one instance without log interleaving. The Lookback period: Last 30 minutes setting easily spans the rapid worker boot / worker fail retry cycle that follows an invalid appCommandLine. Once you have captured the live error here, run the KQL block below to confirm the same lines appear in AppServiceConsoleLogs for after-the-fact reporting.
AppServiceConsoleLogs
| where TimeGenerated > ago(4h)
| where ResultDescription has_any ("ModuleNotFoundError", "wrong_module", "Worker failed to boot")
| project TimeGenerated, ResultDescription
| order by TimeGenerated desc
Observed log lines:
2026-04-04T05:55:06.4678473Z [2026-04-04 05:55:06 +0000] [1895] [ERROR] Reason: Worker failed to boot.
2026-04-04T05:55:04.0857549Z No module named 'wrong_module'
2026-04-04T05:55:04.0838827Z ModuleNotFoundError: No module named 'wrong_module'
2026-04-04T05:54:49.4185745Z Site's appCommandLine: gunicorn --bind=0.0.0.0:8000 --timeout=120 wrong_module:app
3.10 Query KQL evidence (platform)
AppServicePlatformLogs
| where TimeGenerated > ago(4h)
| where Message has_any ("Container did not start within expected time limit of 230s", "Starting container", "stopped")
| project TimeGenerated, Level, Message
| order by TimeGenerated desc
Observed platform messages include:
State: Stopping, Action: StoppingSiteContainers, LastErrorDetails: Container did not start within expected time limit of 230s.
State: Stopping, Action: CancellingStartup, LastErrorDetails: Container did not start within expected time limit of 230s.
Starting container: 31a19ef7e66d_app-labstartup-... .
Site: app-labstartup-... stopped.
3.11 Remediation command (direct)
If reproducing manually and app remains unhealthy, force the known-good startup command:
az webapp config set \
  --resource-group "$RG" \
  --name "$APP_NAME" \
  --startup-file "gunicorn --bind=0.0.0.0:8000 --timeout=120 app:app"
Then verify:
4) Experiment Log
This section is a factual record from:
labs/deployment-succeeded-startup-failed/artifacts-sanitized/
4.1 Artifact inventory
| Phase | Artifact | Purpose |
|---|---|---|
| Baseline | baseline/app-config.json | Confirms initial startup command |
| Baseline | baseline/startup-command.txt | Human-readable startup command snapshot |
| Baseline | baseline/app-state.json | App resource state |
| Baseline | baseline/root-response.txt | Front-door symptom snapshot |
| Trigger | trigger/startup-cmd-before-*.txt | Command before remediation |
| Trigger | trigger/startup-cmd-after-*.txt | Command after remediation |
| Trigger | trigger/recovery-probes-*.csv | Health recovery timing |
| Trigger | trigger/diag-stats-postfix-*.json | Early post-fix process health |
| Trigger | trigger/kql-http-*.json | HTTP telemetry evidence |
| Trigger | trigger/kql-console-*.json | Module import failure evidence |
| Trigger | trigger/kql-platform-*.json | Startup timeout lifecycle evidence |
| Postfix | postfix/diag-stats-*.json | Stable post-fix process state |
| Postfix | postfix/diag-env-*.json | Runtime environment diagnostics |
| Postfix | postfix/health-*.json | Final health confirmation |
4.2 Baseline observations
4.2.1 App is running as a resource, but not healthy as workload
File: baseline/app-state.json
Interpretation:
- Control-plane resource state is
Running. - This does not guarantee app process health.
4.2.2 Startup command is misconfigured at baseline
File: baseline/startup-command.txt
File: baseline/app-config.json (appCommandLine field)
4.2.3 User-facing symptom at baseline
File: baseline/root-response.txt
Observed content includes:
:( Application Error
If you are the application administrator, you can access the diagnostic resources
This aligns with upstream 503 and startup failure patterns.
4.3 Trigger and recovery observations
4.3.1 Command change is explicit and minimal
Before:
After:
Only the module reference changed.
4.3.2 Recovery probe timeline
File: trigger/recovery-probes-20260404T054537Z.csv
| Probe attempt | HTTP status | UTC timestamp |
|---|---|---|
| 1 | 000000 | 2026-04-04T05:46:52Z |
| 2 | 000000 | 2026-04-04T05:47:05Z |
| 3 | 000000 | 2026-04-04T05:47:24Z |
| 4 | 200 | 2026-04-04T05:47:30Z |
Interpretation:
- There is a short recovery window while restart stabilizes.
- Successful 200 appears once corrected startup process is serving.
4.3.3 Early post-fix process evidence
File: trigger/diag-stats-postfix-20260404T054537Z.json
{"endpoint_counters":{"<unknown>":1,"health":1},"pid":1896,"process_start_time":"2026-04-04T05:47:26.277049+00:00","request_count":3,"uptime_seconds":4.34}
Key detail:
process_start_timeis consistent with restart during fix.- Process is now alive and counting requests.
4.4 Telemetry evidence from KQL artifacts
4.4.1 HTTP log evidence
Artifact: trigger/kql-http-20260404T060610Z.json
Status summary:
| Status | Count | Interpretation |
|---|---|---|
| 200 | 12 | Healthy responses after fix |
| 499 | 3 | Client-aborted/timeout during unstable window |
| 503 | 5 | Unavailable during startup failure |
| 202 | 2 | Deployment API async accepted |
Selected rows:
| TimeGenerated (UTC) | Path | Status | TimeTaken(ms) |
|---|---|---|---|
| 2026-04-04T05:53:51.718877Z | /health | 200 | 4 |
| 2026-04-04T05:47:29.664099Z | /health | 200 | 71 |
| 2026-04-04T05:47:29.415736Z | /health | 499 | 19241 |
| 2026-04-04T05:47:29.415557Z | /health | 499 | 38700 |
| 2026-04-04T05:47:29.415363Z | /health | 499 | 58319 |
| 2026-04-04T05:46:16.764962Z | /health | 503 | 38965 |
| 2026-04-04T05:33:23.554879Z | / | 503 | 98 |
| 2026-04-04T05:32:59.155215Z | / | 503 | 37700 |
| 2026-04-04T05:16:36.397916Z | /api/zipdeploy | 202 | 2409 |
4.4.2 Console log evidence
Artifact: trigger/kql-console-20260404T060610Z.json
Critical rows:
| TimeGenerated (UTC) | ResultDescription |
|---|---|
| 2026-04-04T05:55:06.4678473Z | [ERROR] Reason: Worker failed to boot. |
| 2026-04-04T05:55:04.0857549Z | No module named 'wrong_module' |
| 2026-04-04T05:55:04.0838827Z | ModuleNotFoundError: No module named 'wrong_module' |
| 2026-04-04T05:54:49.4185745Z | Site's appCommandLine: ... wrong_module:app |
This is direct proof of startup command misconfiguration.
4.4.3 Platform log evidence
Artifact: trigger/kql-platform-20260404T060610Z.json
Representative messages:
| TimeGenerated (UTC) | Message excerpt |
|---|---|
| 2026-04-04T05:55:28.8291049Z | LastErrorDetails: Container did not start within expected time limit of 230s |
| 2026-04-04T05:55:07.6972411Z | Action: CancellingStartup ... 230s |
| 2026-04-04T05:54:17.193421Z | Starting container: 31a19ef7e66d_... |
| 2026-04-04T05:46:45.5817646Z | Starting container: 855e20d9828b_... |
| 2026-04-04T05:55:35.0262875Z | Site: app-labstartup-... stopped. |
This connects app-level exception to platform startup timeout behavior.
4.5 Postfix observations
4.5.1 Final health
File: postfix/health-20260404T055349Z.json
4.5.2 Final process stats
File: postfix/diag-stats-20260404T055349Z.json
{"endpoint_counters":{"<unknown>":1,"diag_env":1,"diag_stats":1,"health":1},"pid":1896,"process_start_time":"2026-04-04T05:47:26.277049+00:00","request_count":5,"uptime_seconds":383.853}
4.5.3 Final environment snapshot
File: postfix/diag-env-20260404T055349Z.json
{"APP_STARTUP_COMMAND":"<unset>","PORT":"8000","SCM_DO_BUILD_DURING_DEPLOYMENT":"true","STARTUP_COMMAND":"<unset>","WEBSITES_PORT":"<unset>","WEBSITE_HOSTNAME":"app-labstartup-pt7yrjbt2zmv2.<azurewebsites-domain-redacted>","WEBSITE_INSTANCE_ID":"f7914080a1e04baaab7e548dc057c38527ceb352eed71d9074f19e190f413990","WEBSITE_SLOT_NAME":"<unset>"}
4.6 Timeline reconstruction
| Approx UTC | Event | Evidence |
|---|---|---|
| 05:16 | ZIP deploy accepted | HTTP log /api/zipdeploy status 202 |
| 05:32-05:46 | App endpoints return 503 / timeout patterns | HTTP logs for / and /health |
| 05:54-05:55 | Console logs show wrong_module import failures | Console KQL artifact |
| 05:46-05:47 | Recovery probes transition from 000000 to 200 | Recovery CSV |
| 05:47 onward | /diag/stats, /diag/env, /health return 200 | Trigger and postfix artifacts |
4.7 Hypothesis verdict
Verdict: Supported.
Why:
- Wrong startup module explicitly configured at baseline.
- Console logs show deterministic module import failure.
- HTTP behavior shows unavailability before fix.
- Only startup module reference changed.
- App recovered to healthy state after correction.
4.8 Operational guidance distilled from this experiment
- Always verify
appCommandLineduring startup incidents. - Separate deployment telemetry from runtime telemetry in dashboards.
- Query console logs for import exceptions before scaling or redeploying.
- Capture platform timeout messages (
230s) for incident chronology. - Promote a pre-release startup command lint rule for Python apps.
4.9 Reusable KQL snippets
Console startup failures
AppServiceConsoleLogs
| where TimeGenerated > ago(24h)
| where ResultDescription has_any (
    "ModuleNotFoundError",
    "No module named",
    "Worker failed to boot",
    "appCommandLine"
)
| project TimeGenerated, ResultDescription
| order by TimeGenerated desc
HTTP availability around deployment
AppServiceHTTPLogs
| where TimeGenerated > ago(24h)
| where CsUriStem in ("/", "/health", "/api/zipdeploy", "/api/deployments/latest")
| summarize count() by CsUriStem, ScStatus
| order by CsUriStem asc, ScStatus asc
Platform startup timeout tracing
AppServicePlatformLogs
| where TimeGenerated > ago(24h)
| where Message has_any (
    "Container did not start within expected time limit of 230s",
    "Starting container",
    "CancellingStartup",
    "stopped"
)
| project TimeGenerated, Level, Message
| order by TimeGenerated desc
Expected Evidence
This section defines what you SHOULD observe at each phase of the lab. Use it to validate your investigation is on track.
Before Trigger (Baseline)
| Evidence Source | Expected State | What to Capture |
|---|---|---|
Deployment APIs (/api/zipdeploy, deployment status) | Deployment workflow returns success/accepted (200/202) | Successful deployment response and timestamp |
| App startup command config | Startup command contains wrong module reference | gunicorn --bind=0.0.0.0:8000 --timeout=120 wrong_module:app |
| Baseline app config snapshot | Runtime configuration exists but app is not yet validated healthy | app-config.json and startup-command.txt artifacts |
During Incident
| Evidence Source | Expected State | Key Indicator |
|---|---|---|
| AppServiceHTTPLogs | User-facing paths fail with 503 and long request duration | Repeated 503 with TimeTaken around 49751-49765 ms |
| AppServiceConsoleLogs | No application boot output because app never reaches runnable code path | 0 rows in console export during failure window |
| AppServicePlatformLogs | Startup probe/cancellation/termination sequence appears | Site startup probe failed after 43.86s, CancellingStartup, LastError: ContainerTimeout, Site container terminated during site startup, Failed to start site. Revert by stopping site. |
After Recovery
| Evidence Source | Expected State | Key Indicator |
|---|---|---|
| Startup command config | Module reference corrected | gunicorn --bind=0.0.0.0:8000 --timeout=120 app:app |
| Health and diagnostics endpoints | App starts and serves normally | /health returns 200 and diagnostics endpoints respond |
| AppServiceHTTPLogs | Availability restored | 200 responses resume for user-facing requests |
Evidence Timeline
graph TD
    A[Baseline Capture] --> B[Trigger Fault]
    B --> C[During: Collect Evidence]
    C --> D[After: Compare to Baseline]
    D --> E[Verdict: Confirmed/Falsified]
Evidence Chain: Why This Proves the Hypothesis
Falsification Logic
If you observe deployment success signals (200/202), concurrent 503s with long request times, zero console rows, and platform startup-probe timeout/cancellation messages, the hypothesis is CONFIRMED because code deployment succeeded but runtime never became healthy due to a bad WSGI entrypoint.
If you do NOT observe this pattern (for example console shows normal app boot and request handling), the hypothesis is FALSIFIED — consider alternatives such as port binding mismatch, dependency startup failure, or networking path issues.
Clean Up
Related Playbook
See Also
- Playbook: Deployment Succeeded but Startup Failed
- Playbook: Container Didn't Respond to HTTP Pings
- Playbook: Warmup vs Health Check
- Lab: Failed to Forward Request