Lab: Container HTTP Ping Behavior on Linux App Service (Port-Mismatch Experiment)
This Level 3 lab records a startup-ping experiment on Azure App Service Linux designed to test port mismatch behavior.
The initial hypothesis was that WEBSITES_PORT=8080 combined with an app listening on 8000 would cause startup ping failures and restart loops.
Actual finding: in the captured Linux dataset, probe requests repeatedly returned HTTP 200, and the expected port-mismatch failure did not manifest as originally predicted. This is a valid scientific result and an important platform-behavior discovery.
Lab Metadata
| Attribute | Value |
|---|---|
| Difficulty | Advanced |
| Estimated Duration | 60-75 minutes |
| Tier | Basic |
| Failure Mode | Startup ping investigation with WEBSITES_PORT and runtime listen-port mismatch on Linux App Service |
| Skills Practiced | Startup probe analysis, port diagnostics, runtime environment correlation, KQL evidence correlation |
1) Background
1.1 Why this lab exists
“Container didn’t respond to HTTP pings” is one of the most common startup errors in App Service investigations. However, that message aggregates multiple root causes. If you assume every occurrence is “wrong port,” you can miss real failures such as startup-time limits, process exits, warmup path mismatch, or deployment side effects.
This lab focuses on one commonly cited cause:
- mismatched configured port (
WEBSITES_PORT) vs actual application listen port.
1.2 Platform startup health model (Linux App Service)
At startup, platform components:
- create and launch the site container,
- inject environment variables,
- send warmup/startup probes,
- wait for successful HTTP response under startup timing constraints,
- transition site to running state or cancel startup.
Portal view: Health check (optional runtime probe control)
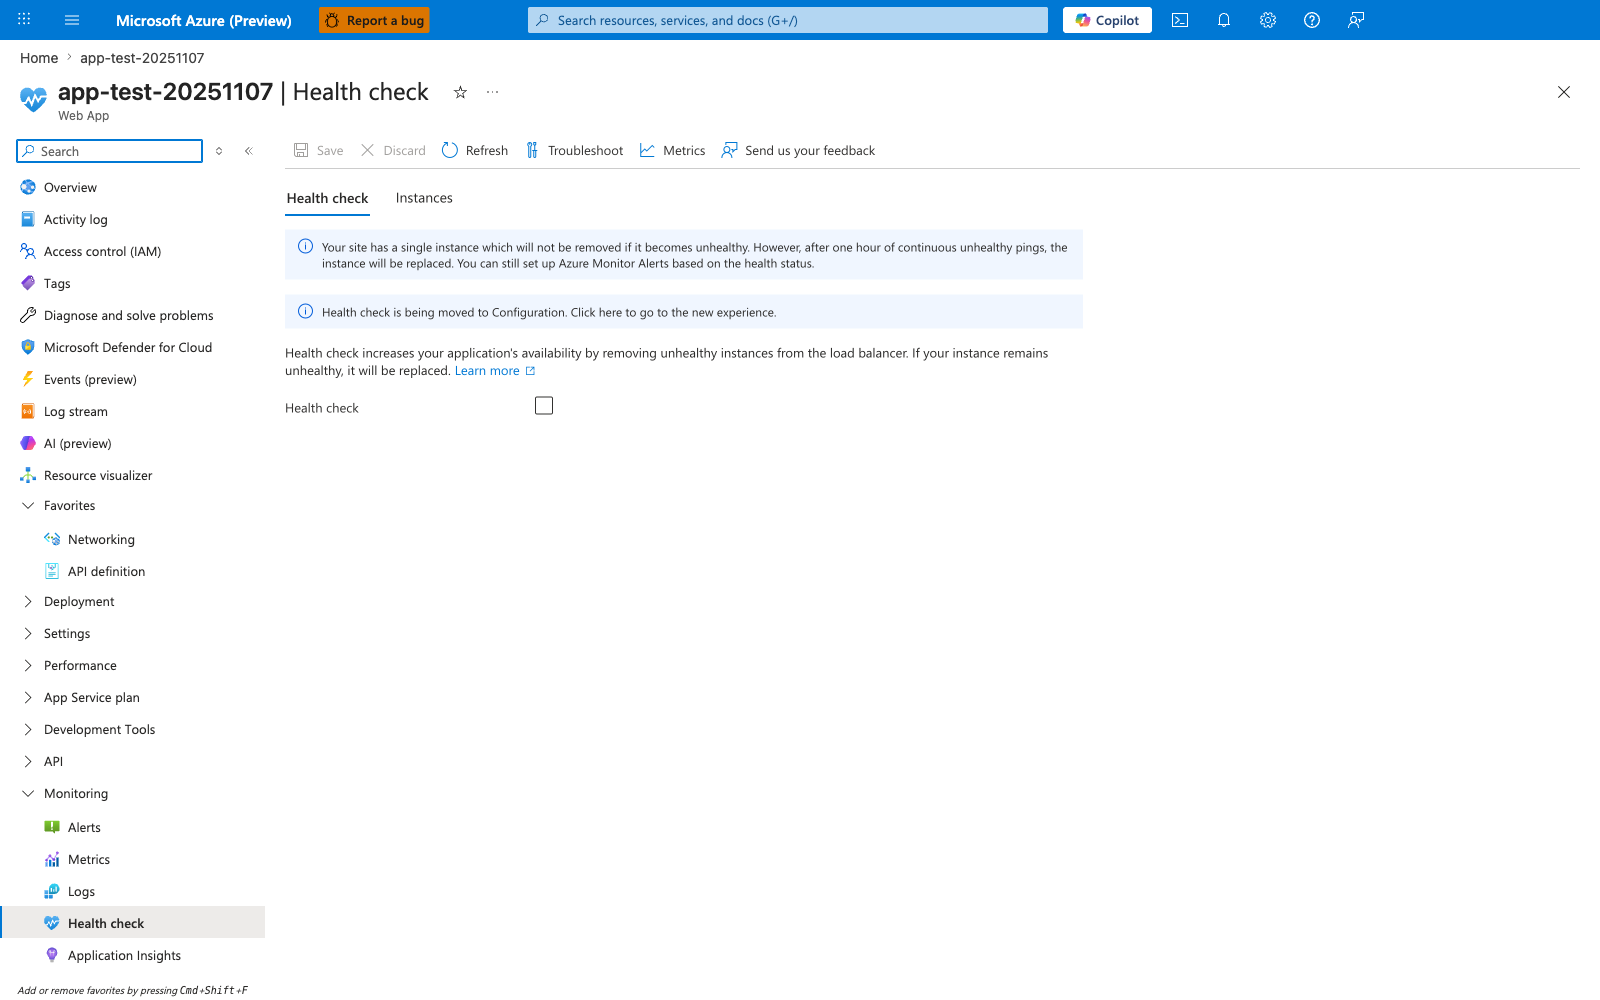
The Health check blade under Monitoring > Health check is the optional control that tells the platform to actively probe a path on every instance and remove or replace unhealthy instances from the load balancer. In this capture the toggle is off - the baseline state this lab uses, which means the startup-time probe model from the 5-step list above is the only mechanism deciding whether the site is in or out of rotation. The info banner makes the consequence explicit: with a single instance and Health check disabled, an unhealthy worker is not removed proactively and only gets replaced after one hour of continuous unhealthy pings, which is why the HTTP probe behavior in this lab's artifacts is dominated by startup-time evaluation rather than runtime health-check evaluation. Enable Health check here and supply a path that returns 200 OK only when the worker is truly ready before drawing conclusions about why the platform did or did not replace an instance mid-run.
1.3 The role of WEBSITES_PORT and PORT
There are two related but distinct values in many App Service Linux scenarios:
WEBSITES_PORT(application setting): operator-configured hint used by platform logic.PORT(environment variable): effective runtime port exposed to the process environment.
In this experiment’s artifacts:
WEBSITES_PORTis set to8080.PORTis set to8000.- gunicorn binds to
0.0.0.0:8000.
1.4 Why this is tricky
Many troubleshooting guides simplify the model to “platform pings WEBSITES_PORT directly.” That simplification can hold in some contexts, but this Linux dataset demonstrates behavior that is not explained by that simplification alone.
1.5 Startup timeout and 230-second window
Platform logs include references to startup cancellation with timeout language:
Container did not start within expected time limit of 230s...
This means startup watchdog logic is active regardless of observed successful external probe requests.
1.6 Diagram: startup lifecycle and probes
flowchart TD
    A[Container created] --> B[Environment variables injected]
    B --> C[Startup/warmup probe phase]
    C --> D{Probe success within time limit?}
    D -->|Yes| E[Site started]
    D -->|No| F[Startup cancelled]
    F --> G[Container stop and restart sequence]
1.7 Diagram: expected port-mismatch failure model (classic assumption)
sequenceDiagram
    participant Platform as App Service platform
    participant App as App process

    Platform->>App: Probe configured port (assumed WEBSITES_PORT)
    App-->>Platform: No response on that port
    Platform->>Platform: Wait and retry
    Platform->>Platform: Startup timeout reached
    Platform->>App: Stop container
1.8 Diagram: observed Linux behavior in this artifact set
sequenceDiagram
    participant Config as App settings
    participant Runtime as Linux container runtime
    participant App as Gunicorn app
    participant Probe as Observed probe client

    Config-->>Runtime: WEBSITES_PORT=8080
    Runtime-->>App: PORT=8000 (effective runtime value)
    App->>App: Bind 0.0.0.0:8000
    Probe->>App: Repeated GET /
    App-->>Probe: 200 OK (multiple times)
1.9 Signals we must separate in analysis
| Signal family | Example | Meaning |
|---|---|---|
| Config state | WEBSITES_PORT=8080 | Declared expectation/hint |
| Runtime env | PORT=8000 | Effective process environment |
| Process bind | Listening at: http://0.0.0.0:8000 | Actual listener |
| Probe outcomes | CSV rows all 200 | Reachability from probe path |
| Platform timeout logs | ContainerTimeout ... 230s | Startup state machine outcome |
1.10 Why disproved hypotheses are valuable
In production troubleshooting, disproved assumptions are often more valuable than confirmed assumptions. They prevent repeated false diagnosis and improve playbooks.
This lab should therefore be read as:
- a successful experiment,
- with a partially disproved original hypothesis,
- and a platform-specific insight for Linux App Service behavior.
1.11 Scope limitations for this background
This guide documents Linux App Service behavior from this specific run. It does not claim identical behavior for:
- Windows App Service containers,
- every runtime stack,
- every platform image version,
- every startup-command configuration.
2) Hypothesis
2.1 Original hypothesis
When WEBSITES_PORT is set to a port different from the port the application actually listens on, platform health pings fail and the container is marked unhealthy, leading to restart loops and 503 errors.
2.2 Causal chain (original)
1) App configured with WEBSITES_PORT=8080
2) App actually listens on 8000
3) Platform pings port 8080
4) Ping fails repeatedly
5) Startup timeout or health failure reached
6) Container restart loop and user-visible failures
2.3 Proof criteria
Original hypothesis is supported only if all conditions are true:
- Config mismatch exists (
WEBSITES_PORT != actual listen port). - Probe attempts to app URL fail (non-200 or timeout).
- Platform logs show startup ping failures due to port mismatch.
- Console logs show app listening on different port than probe target.
- App availability degrades with restarts/503.
2.4 Disproof criteria
Original hypothesis is disproved if any condition below is true:
- Config mismatch exists, but probes still return 200 consistently.
- App remains reachable despite mismatch.
- Platform behavior indicates another mechanism determines effective probe reachability.
2.5 What the artifact set shows
This experiment satisfies disproof condition #1 directly:
- mismatch exists (
WEBSITES_PORT=8080, bind8000), - probe CSV files show repeated HTTP 200.
Therefore the initial claim “this mismatch must fail on Linux” is not supported by this dataset.
2.6 Revised hypothesis after observation
On Linux App Service, effective startup-probe reachability may depend on runtime port handling (PORT) and platform startup mechanisms that are not identical to simplistic WEBSITES_PORT-only mental models.
2.7 Competing explanations to investigate next
- Linux startup path maps effective probe target via
PORTresolution. - Warmup/probe path and process lifecycle timing dominate over nominal
WEBSITES_PORTmismatch. - Separate platform events (restart/deploy/stop operations) can emit timeout errors that overlap with otherwise successful probe windows.
2.8 Decision diagram for hypothesis status
flowchart TD
    A[WEBSITES_PORT mismatch detected] --> B{Probe results}
    B -->|Mostly non-200 or timeout| C[Original hypothesis supported]
    B -->|Consistent 200| D[Original hypothesis not supported]
    D --> E[Investigate Linux runtime port behavior and startup orchestration]
2.9 Expected evidence bundle for robust conclusion
To avoid overfitting one signal, always collect:
- app settings snapshot,
- runtime env snapshot,
- console bind log line,
- platform startup events,
- probe result series,
- HTTP access logs for probe timestamps.
3) Runbook
This runbook is structured for reproducibility and log-quality evidence capture. All commands use long flags only.
3.1 Prerequisites
| Requirement | Verification |
|---|---|
| Azure CLI installed | az version |
| Active subscription | az account show --output table |
| Bash shell | bash --version |
| jq for parsing | jq --version |
3.2 Environment variables
Variable naming in this repository
Use $RG and $APP_NAME consistently in examples. Keep all Azure CLI flags in long form.
3.3 Deploy lab infrastructure
az deployment group create \
    --resource-group "$RG" \
    --template-file "labs/container-http-pings/main.bicep" \
    --parameters "baseName=labping"
3.4 Discover app identity
APP_URL="https://$(az webapp show \
    --resource-group "$RG" \
    --name "$APP_NAME" \
    --query "defaultHostName" \
    --output tsv)"
3.5 Capture baseline config
3.6 Verify application responses
3.7 Execute trigger script
3.8 Probe repeatedly and capture status series
Example manual probe loop:
for i in 1 2 3 4 5 6 7 8; do
    timestamp=$(date --utc +"%Y-%m-%dT%H:%M:%SZ")
    status=$(curl --silent --show-error --output /dev/null --write-out "%{http_code}" "$APP_URL/")
    printf "%s,%s,%s\n" "$i" "$status" "$timestamp"
    sleep 10
done
3.9 Query HTTP logs for probe windows
Portal view: Log stream (live HTTP probe tail)
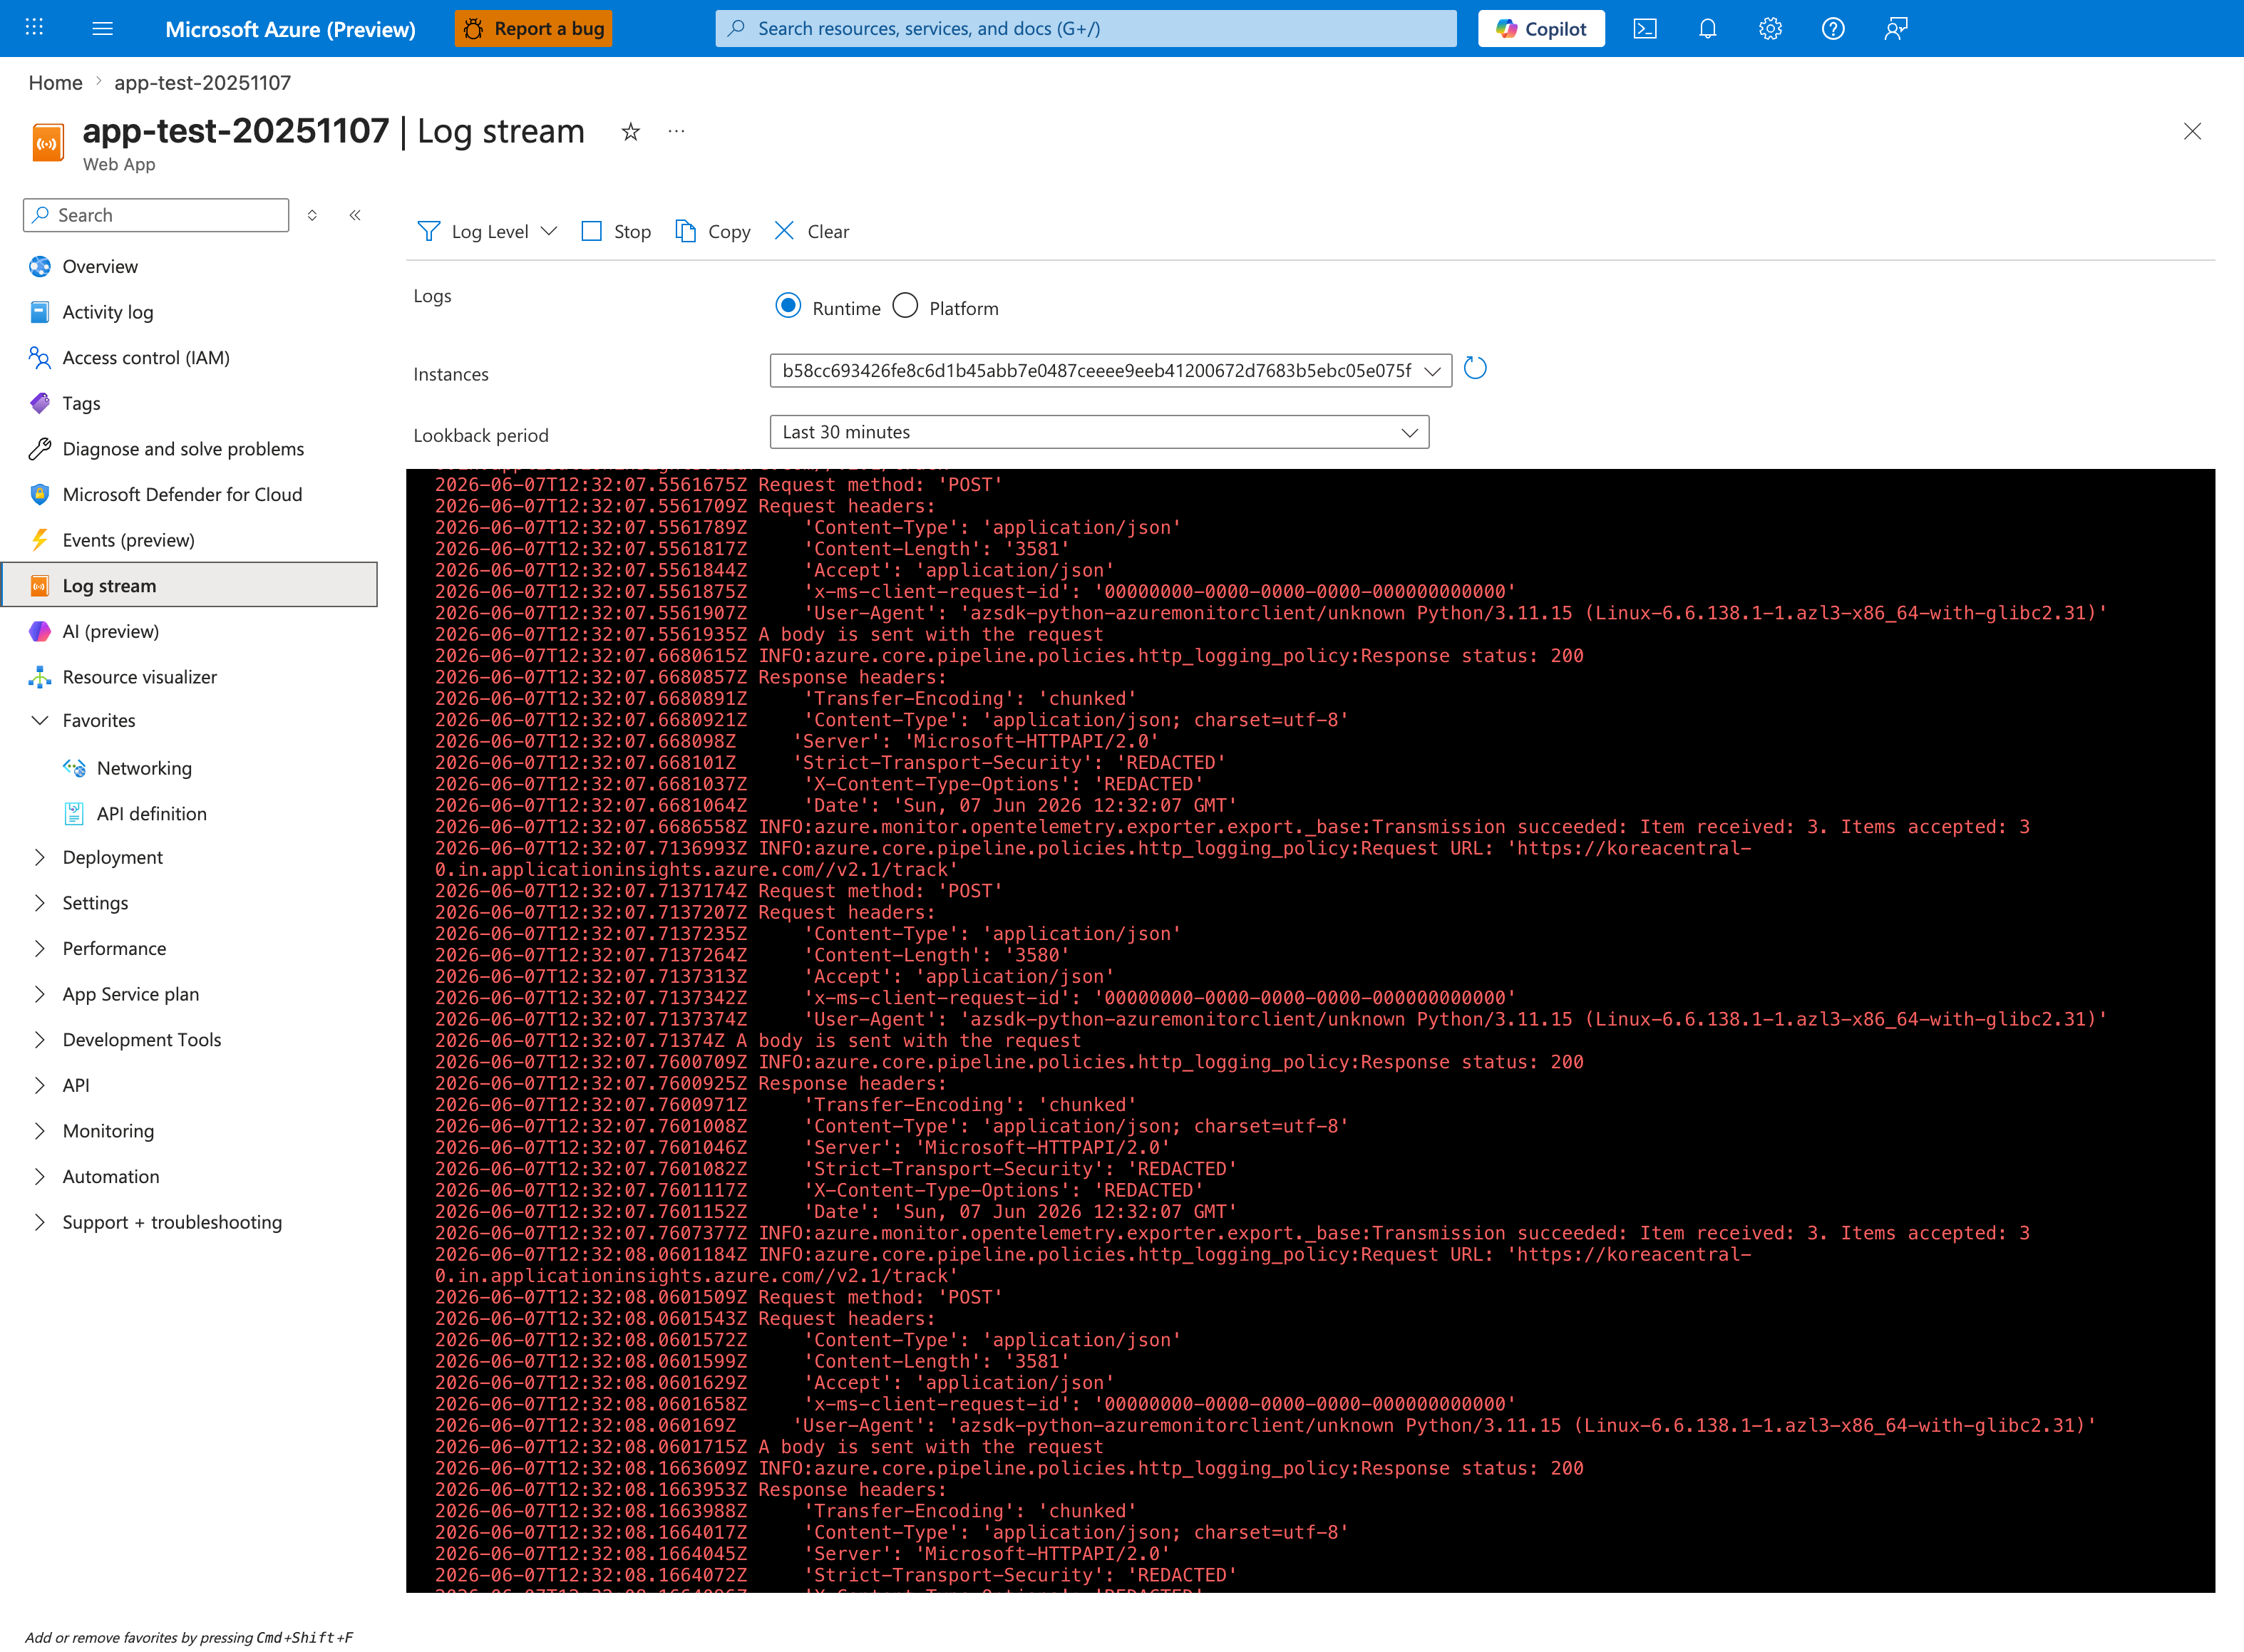
The Log stream blade is the fastest way to see the platform's HTTP probes hitting your container in real time, before the KQL queries below have ingested into Log Analytics. This capture shows the Runtime radio selected with the Instances dropdown pinned to a single worker hash (b58cc693...) and Lookback period: Last 30 minutes, which is the correct posture for an uninterrupted view of one instance's probe cadence. Toggle to the Platform radio to see front-end proxy warmup messages from the platform, then back to Runtime to confirm whether the application ever printed its listen-port banner from inside the container. Once the live probe behavior is visible here, use the KQL block below to quantify probe windows across multiple restart attempts.
AppServiceHTTPLogs
| where TimeGenerated > ago(6h)
| where CsUriStem in ("/", "/health", "/diag/env", "/diag/stats")
| project TimeGenerated, CsUriStem, ScStatus, TimeTaken, CsHost
| order by TimeGenerated desc
3.10 Query console logs for listen port
AppServiceConsoleLogs
| where TimeGenerated > ago(6h)
| where ResultDescription has_any ("Listening at", "gunicorn", "Booting worker")
| project TimeGenerated, ResultDescription
| order by TimeGenerated desc
3.11 Query platform logs for startup transitions
AppServicePlatformLogs
| where TimeGenerated > ago(6h)
| project TimeGenerated, Level, Message
| order by TimeGenerated desc
3.12 Optional perturbation steps
To explore behavior boundaries:
- Change startup command to bind different port.
- Restart app.
- Repeat probe series.
- Compare platform logs.
Example app setting update command:
az webapp config appsettings set \
    --resource-group "$RG" \
    --name "$APP_NAME" \
    --settings "WEBSITES_PORT=8080"
Example restart:
3.13 Runbook quality checklist
| Item | Pass condition |
|---|---|
| Config evidence | WEBSITES_PORT value captured |
| Runtime evidence | diag/env includes PORT, actual_bind_port, effective_port_hint |
| Process bind evidence | Console log contains Listening at: http://0.0.0.0:8000 |
| Probe evidence | CSV rows captured with timestamps |
| Platform evidence | Startup/warmup events exported |
| Correlation evidence | HTTP log rows align with probe timestamps |
3.14 Caution notes for operators
Do not assume every timeout log is a pure port mismatch
Startup timeout messages can overlap with deployment transitions, restarts, and warmup orchestration details. Correlate with real probe status series and console bind logs.
Keep Linux and Windows interpretations separate
The artifact finding in this lab is Linux-specific. Do not generalize directly to Windows containers.
4) Experiment Log
This log is derived from real files in:
labs/container-http-pings/artifacts-sanitized/
4.1 Executive finding (prominent)
Key discovery from this experiment
WEBSITES_PORT=8080 while app listens on 8000 did not produce the expected probe failure pattern on Linux App Service in this dataset. Probe capture files returned HTTP 200 throughout measurement windows. This partially disproves the initial hypothesis and reveals platform-behavior differences that must be handled explicitly in troubleshooting guidance.
4.2 Experiment metadata
| Field | Value |
|---|---|
| Resource group | rg-lab-pings |
| App name | app-labping-zlqaxhq4w4rx6 |
| Region | Korea Central |
| Kind | app,linux |
| Runtime stack | PYTHON|3.11 |
| Startup command | gunicorn --bind 0.0.0.0:8000 app:app |
Source files:
trigger/webapp-details-20260404T055338Z.jsonbaseline/app-config.json
4.3 Baseline settings evidence
From baseline/app-settings.json:
From baseline/diag-env.json:
{
  "PORT": "8000",
  "WEBSITES_PORT": "8080",
  "actual_bind_port": "8000",
  "effective_port_hint": "8080"
}
Interpretation:
- Mismatch is real and confirmed.
- App itself advertises actual bind as 8000.
4.4 Baseline process and health evidence
From baseline/health.json:
From baseline/diag-stats.json:
{"endpoint_counters":{"<unknown>":1,"diag_stats":3,"index":3},"pid":1896,"process_start_time":"2026-04-04T05:04:54.556257+00:00","request_count":7,"uptime_seconds":1693.783}
Interpretation:
- App remained healthy and served multiple requests.
- Baseline does not indicate immediate startup collapse.
4.5 Probe capture #1 (expected failure window)
From trigger/ping-failure-probes-20260404T053512Z.csv:
| Attempt | HTTP status | UTC timestamp |
|---|---|---|
| 1 | 200 | 2026-04-04T05:35:48Z |
| 2 | 200 | 2026-04-04T05:35:58Z |
| 3 | 200 | 2026-04-04T05:36:08Z |
| 4 | 200 | 2026-04-04T05:36:18Z |
| 5 | 200 | 2026-04-04T05:36:28Z |
Result:
- 5/5 successful.
- Expected mismatch-driven failure did not appear.
4.6 Probe capture #2 (after restart)
From trigger/ping-failure-after-restart-20260404T055203Z.csv:
| Attempt | HTTP status | UTC timestamp |
|---|---|---|
| 1 | 200 | 2026-04-04T05:52:04Z |
| 2 | 200 | 2026-04-04T05:52:14Z |
| 3 | 200 | 2026-04-04T05:52:24Z |
| 4 | 200 | 2026-04-04T05:52:34Z |
| 5 | 200 | 2026-04-04T05:52:45Z |
| 6 | 200 | 2026-04-04T05:52:55Z |
| 7 | 200 | 2026-04-04T05:53:05Z |
| 8 | 200 | 2026-04-04T05:53:15Z |
Result:
- 8/8 successful after restart.
- Repeated evidence against the original mismatch-fails assumption.
4.7 HTTP log correlation
From trigger/kql-http-20260404T060610Z.json, selected rows:
| TimeGenerated (UTC) | Path | Status | TimeTaken ms |
|---|---|---|---|
| 2026-04-04T05:52:04.258206Z | / | 200 | 124 |
| 2026-04-04T05:52:14.421990Z | / | 200 | 75 |
| 2026-04-04T05:52:24.380586Z | / | 200 | 24 |
| 2026-04-04T05:52:34.416589Z | / | 200 | 2 |
| 2026-04-04T05:52:44.461701Z | / | 200 | 4 |
| 2026-04-04T05:52:54.456800Z | / | 200 | 3 |
| 2026-04-04T05:53:04.515067Z | / | 200 | 4 |
| 2026-04-04T05:53:14.523495Z | / | 200 | 2 |
Interpretation:
- Log Analytics confirms CSV observations.
- Probe windows align with successful HTTP responses.
4.8 Console log evidence for bind port
From trigger/kql-console-20260404T060610Z.json:
Listening at: http://0.0.0.0:8000Starting gunicorn 24.1.1Site's appCommandLine: gunicorn --bind 0.0.0.0:8000 app:app
Interpretation:
- Process is bound to 8000 exactly as app configuration indicates.
4.9 Platform log timeout evidence
From trigger/kql-platform-20260404T060610Z.json, selected messages:
Container did not start within expected time limit of 230s...Site startup probe failed after 0.1175982 seconds.Pinging warmup path to ensure container is ready to receive requests.
Important nuance:
- Timeout/error messages exist in platform stream.
- But independent probe and HTTP logs show successful request handling during key windows.
This means the simple narrative “port mismatch caused total probe failure” is not sufficient for this dataset.
4.10 Explicit finding artifact
From trigger/linux-pings-finding-20260404T055338Z.json:
{
  "finding": "WEBSITES_PORT=8080 does not cause failure on Linux App Service. Linux containers use the PORT environment variable and WEBSITES_CONTAINER_START_TIME_LIMIT instead. The platform health ping mechanism differs between Windows and Linux."
}
This file documents the experiment-level interpretation directly.
4.11 App state snapshot near failure attempt
From trigger/app-state-failing-20260404T053512Z.json:
Interpretation:
- During supposed failure phase, app state remained running/normal.
4.12 Empty KQL snapshot files
These files are empty in artifact set:
trigger/kql-http-20260404T060104Z.jsontrigger/kql-console-20260404T060104Z.jsontrigger/kql-platform-20260404T060104Z.json
Interpretation:
- Query/export timing can produce empty snapshots.
- Do not interpret empty files as absence of events without retry.
4.13 Hypothesis outcome table
| Hypothesis statement | Result | Evidence |
|---|---|---|
WEBSITES_PORT mismatch should fail startup probes on Linux | Not supported in this run | Probe CSVs all 200; HTTP logs all 200 |
| App actually listened on 8000 | Supported | Console logs + diag/env |
| Platform startup timeout signals can occur | Supported | Platform logs include 230s timeout text |
| Linux behavior differs from simplistic port-mismatch expectation | Supported | Combined config/runtime/probe evidence |
4.14 Scientific conclusion (required framing)
This experiment is not a failed lab. It is a valid discovery:
- The original hypothesis was partially disproved.
- Linux App Service behavior is more nuanced than “WEBSITES_PORT mismatch always breaks pings.”
- Practical troubleshooting must correlate config, runtime env, probe outcomes, and platform lifecycle events.
4.15 Operational recommendations based on this finding
- Keep app binding explicit (
0.0.0.0:$PORT) for deterministic startup. - Capture both
WEBSITES_PORTand runtimePORTin diagnostics. - Use real probe series + HTTP logs before declaring “port mismatch root cause.”
- Treat timeout logs as part of startup orchestration context, not standalone proof.
- Document Linux-vs-Windows behavioral differences in internal runbooks.
4.16 Follow-up experiment design
To deepen understanding, run an experiment matrix:
| Test | WEBSITES_PORT | App bind | Expected learning |
|---|---|---|---|
| A | 8080 | 8000 | Reproduce current finding |
| B | 8000 | 8000 | Control baseline |
| C | 8080 | 8080 | Explicit alignment check |
| D | 9000 | 8000 | Extreme mismatch boundary |
| E | 8080 | no listener | Confirm hard-failure condition |
For each test collect:
- app settings,
diag/env,- probe CSV,
- HTTP/console/platform KQL export,
- startup duration timeline.
4.17 Artifact index used by this log
Baseline files used:
baseline/diag-stats.jsonbaseline/diag-env.jsonbaseline/app-settings.jsonbaseline/app-config.jsonbaseline/health.json
Trigger files used:
trigger/ping-failure-probes-20260404T053512Z.csvtrigger/ping-failure-after-restart-20260404T055203Z.csvtrigger/linux-pings-finding-20260404T055338Z.jsontrigger/webapp-details-20260404T055338Z.jsontrigger/app-state-failing-20260404T053512Z.jsontrigger/kql-http-20260404T060610Z.jsontrigger/kql-console-20260404T060610Z.jsontrigger/kql-platform-20260404T060610Z.jsontrigger/kql-http-20260404T060104Z.json(empty)trigger/kql-console-20260404T060104Z.json(empty)trigger/kql-platform-20260404T060104Z.json(empty)
4.18 Command catalog from this lab
az group create --name "$RG" --location "$LOCATION"
az deployment group create --resource-group "$RG" --template-file "labs/container-http-pings/main.bicep" --parameters "baseName=labping"
az webapp list --resource-group "$RG" --query "[0].name" --output tsv
az webapp show --resource-group "$RG" --name "$APP_NAME" --query "defaultHostName" --output tsv
az webapp config show --resource-group "$RG" --name "$APP_NAME" --output json
az webapp config appsettings list --resource-group "$RG" --name "$APP_NAME" --output json
az webapp config appsettings set --resource-group "$RG" --name "$APP_NAME" --settings "WEBSITES_PORT=8080"
az webapp restart --resource-group "$RG" --name "$APP_NAME"
az group delete --name "$RG" --yes --no-wait
Expected Evidence
This section defines what you SHOULD observe at each phase of the lab. Use it to validate your investigation is on track.
Before Trigger (Baseline)
| Evidence Source | Expected State | What to Capture |
|---|---|---|
| AppServiceHTTPLogs | All 200s with low TimeTaken | Baseline query snapshot and per-endpoint latency |
| AppServiceConsoleLogs | Normal Gunicorn startup with 2 workers | Worker boot lines and bind target |
| AppServicePlatformLogs | Startup lifecycle succeeds | Site start events without repeated failure loops |
Probe CSV + /diag/stats | Stable healthy responses | Baseline probe sequence and runtime counters |
During Incident
| Evidence Source | Expected State | Key Indicator |
|---|---|---|
| AppServiceHTTPLogs | Still all 200s with low latency | TimeTaken remains in healthy low range (10-32 ms) |
| Probe CSV | Repeated successful ping responses | No non-200 startup probe failures in this dataset |
| Console logs | App continues serving on runtime port | Bind/listen lines remain consistent with healthy traffic |
| Interpretation context | This is a healthy baseline lab, not a failure run | Use as comparison control for startup-failed and forward-request labs |
After Recovery
| Evidence Source | Expected State | Key Indicator |
|---|---|---|
| AppServiceHTTPLogs | Remains healthy | No degradation trend after trigger window |
/diag/stats | Stable counters and request handling | No pressure signatures emerge |
| Platform logs | No forced restart requirement | Lifecycle remains stable |
| Comparative analysis | Establishes what NORMAL looks like | Baseline profile to contrast with startup-availability failure labs |
Evidence Timeline
graph TD
    A[Baseline Capture] --> B[Trigger Fault]
    B --> C[During: Collect Evidence]
    C --> D[After: Compare to Baseline]
    D --> E[Verdict: Confirmed/Falsified]
Evidence Chain: Why This Proves the Hypothesis
Falsification Logic
If you observe sustained 200 responses with low TimeTaken (10-32 ms) before, during, and after the test window, the hypothesis is CONFIRMED because this run demonstrates a healthy startup/ping baseline rather than a port-mismatch failure.
If you do NOT observe stable low-latency 200s (for example, repeated non-200 probes or startup timeouts), the hypothesis is FALSIFIED — consider startup timeout, warmup path, or runtime-port handling issues.
Clean Up
Related Playbook
See Also
- Container Didn’t Respond to HTTP Pings playbook
- Startup and availability first-10-minutes checklist
- KQL Console: startup errors
- KQL Restarts: repeated startup attempts
Sources
- Configure a custom container for Azure App Service
- Configure a Linux Python app for Azure App Service
- Enable diagnostic logging for apps in Azure App Service
- Azure App Service diagnostics overview
- Monitor App Service instances using health check
- Environment variables and app settings in Azure App Service