Hands-on Labs
Bicep-based reproduction environments for each troubleshooting scenario. Deploy to your Azure subscription, trigger the symptom, observe signals, then clean up.
graph TD
    A[Hands-on Labs] --> B[Performance]
    A --> C[Startup or Availability]
    A --> D[Outbound or Network]
    B --> E[Memory Pressure]
    B --> F[Intermittent 5xx]
    B --> G[No Space Left on Device]
    B --> H[Slow Start / Cold Start]
    C --> I[Container HTTP Pings]
    C --> J[Deployment Ok Startup Failed]
    C --> K[Failed to Forward Request]
    C --> L[Slot Swap Config Drift]
    D --> M[SNAT Exhaustion]
    D --> N[DNS Resolution VNet]
How Labs Work
Each lab includes:
- main.bicep — Infrastructure template (App Service Plan B1, App Service Python 3.11 Linux, Log Analytics, Diagnostic Settings)
- app/ — Flask application designed to reproduce a specific symptom
- trigger.sh — Script to trigger the symptom
- verify.sh — Script to query Log Analytics and confirm expected signals appeared
- Documentation page — Step-by-step walkthrough with KQL queries and expected observations
Portal view: Diagnose and solve problems entry point
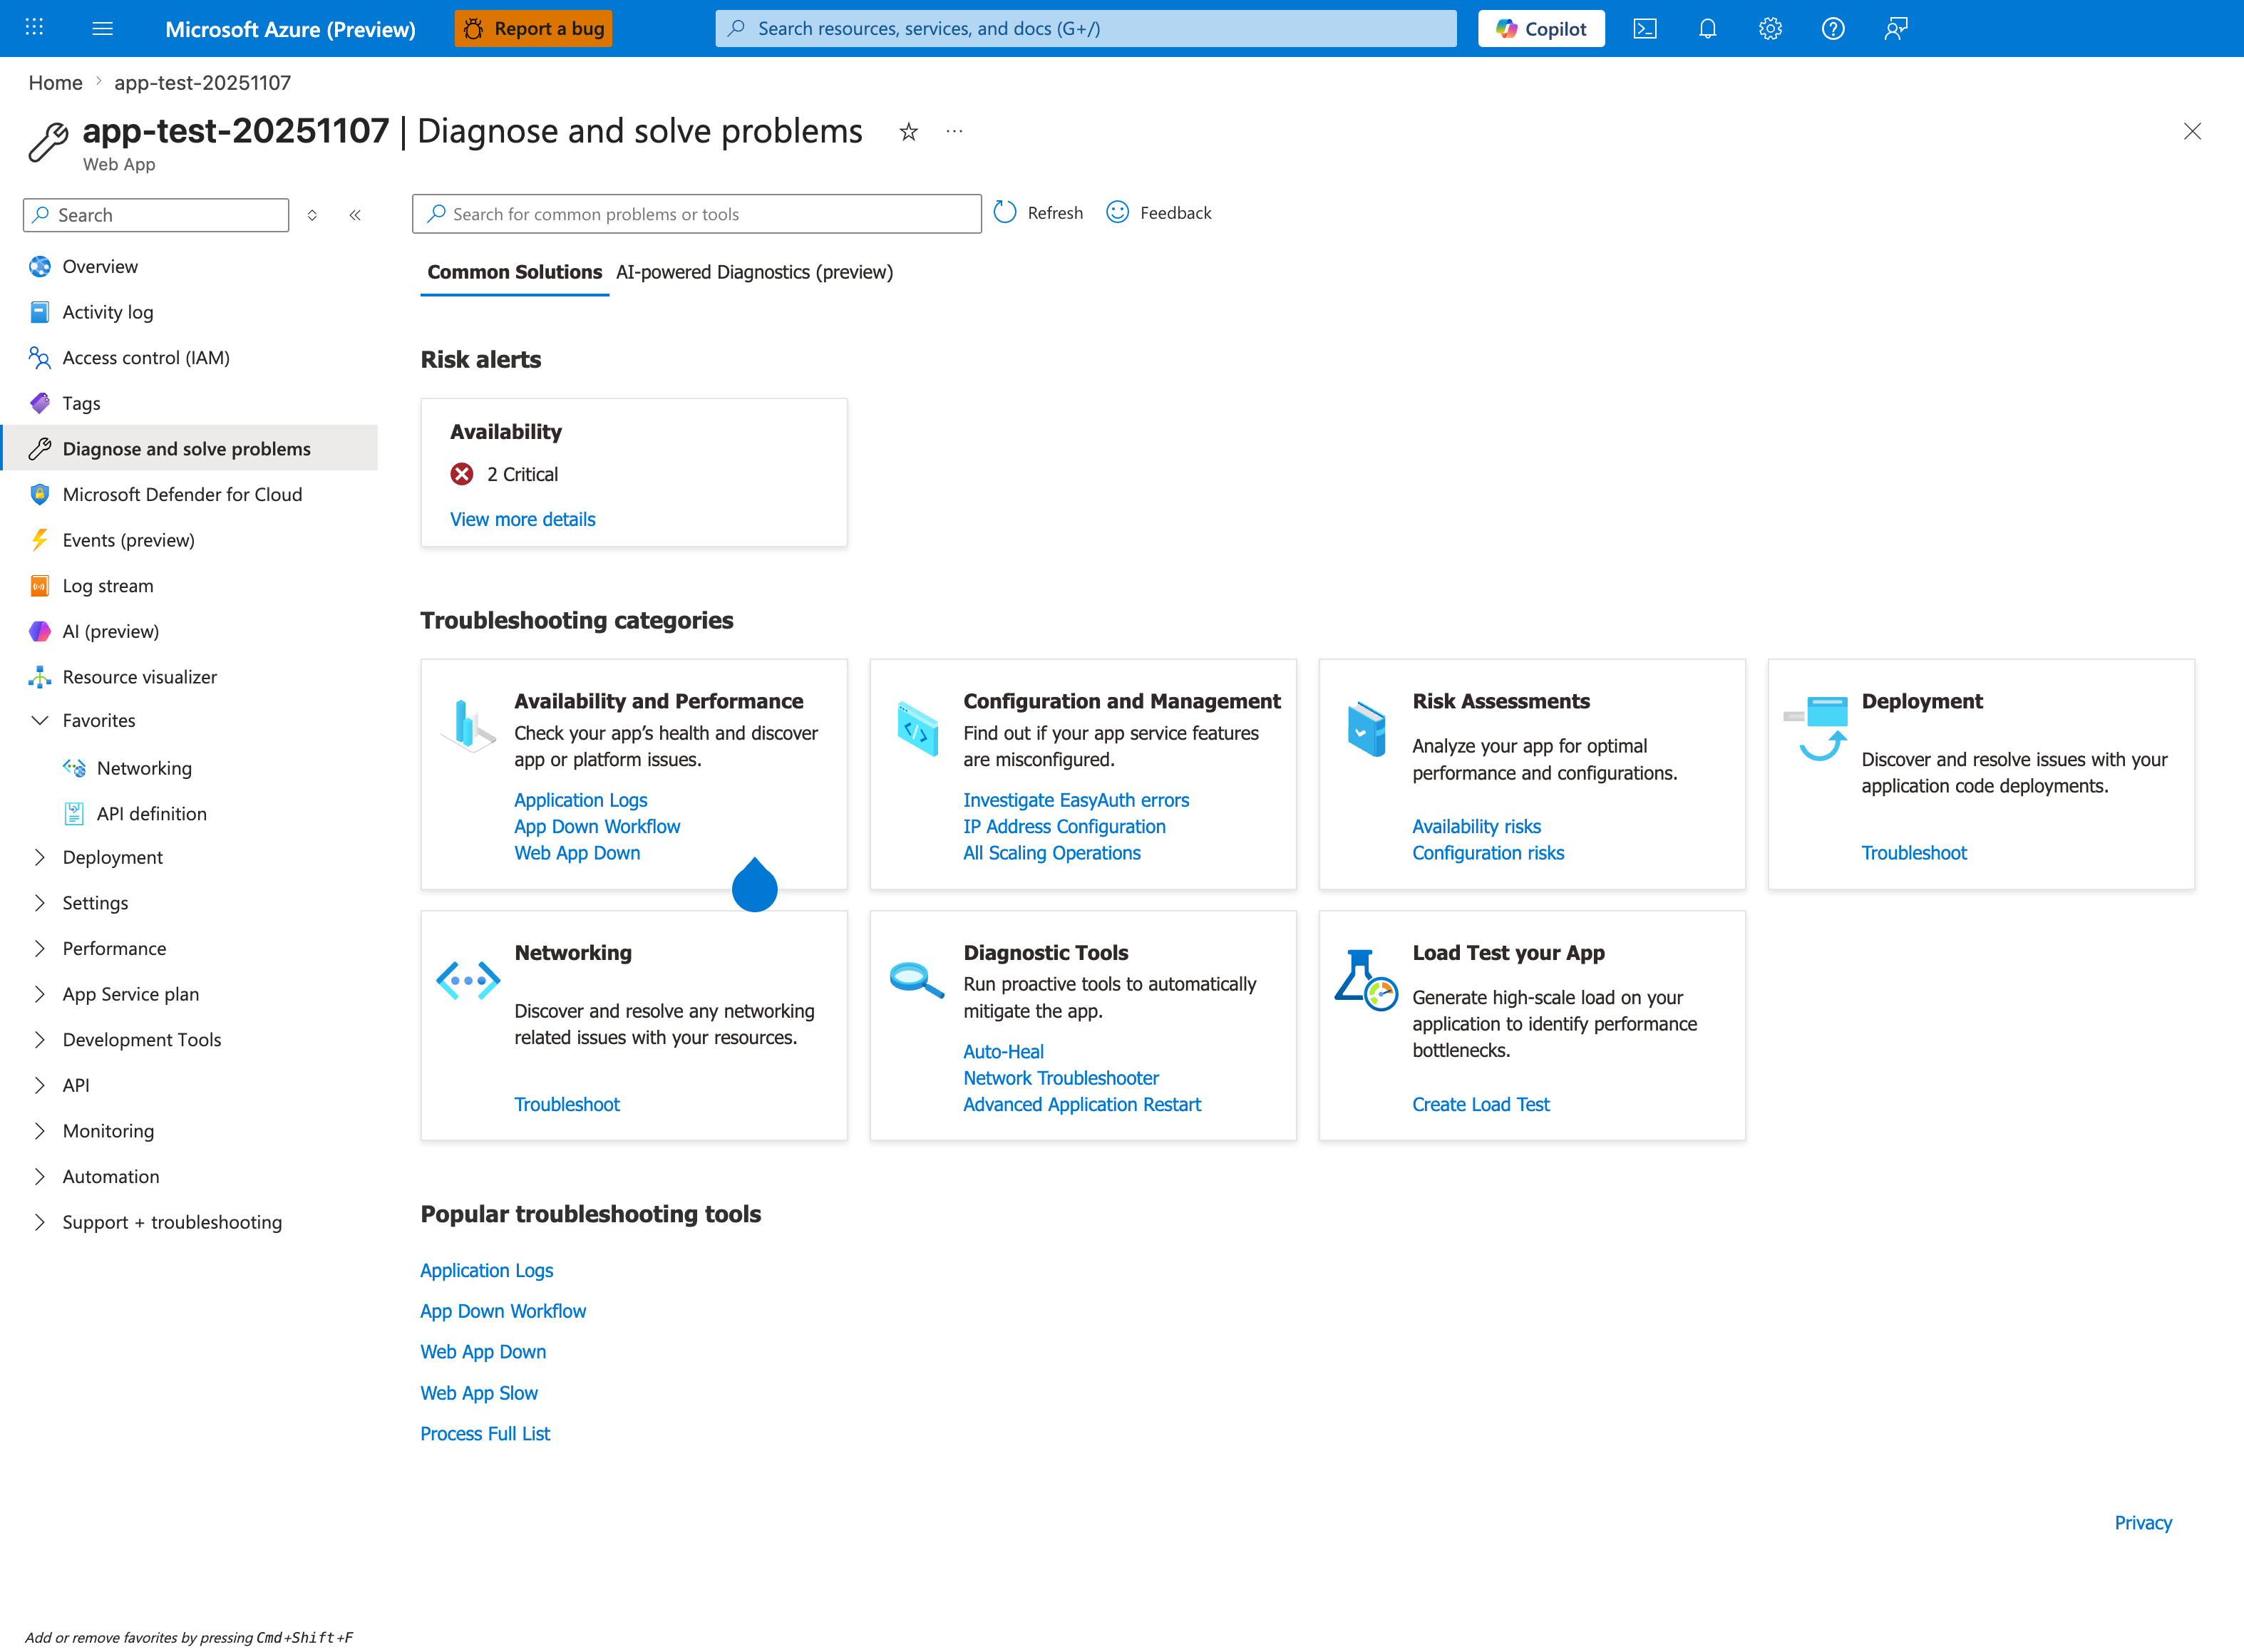
The Diagnose and solve problems blade is the first Portal stop when running these labs. The Common Solutions tab groups seven troubleshooting categories that map to the lab folders below, and the Popular troubleshooting tools row at the bottom links to App Down Workflow, Web App Down, Web App Slow, and Process Full List - the same detectors most labs ask you to open after reproducing the failure mode. The Risk alerts Availability card with 2 Critical alerts is exactly the signal you want to see fire when a lab triggers an outage. Treat this blade as the operational companion to the lab metadata table: it tells you which Portal detector to consult after triggering each scenario.
Available Labs
Performance
| Lab | Symptom | Related Playbook |
|---|---|---|
| Memory Pressure | Rising memory, worker timeouts, container restarts | Memory Pressure & Worker Degradation |
| Intermittent 5xx Under Load | Sporadic 5xx responses during traffic spikes | Intermittent 5xx Under Load |
| No Space Left on Device | Disk full errors from /home or /tmp exhaustion | No Space Left on Device |
| Slow Start / Cold Start | First request slow after deploy or idle | Slow Start / Cold Start vs Regression |
Startup / Availability
| Lab | Symptom | Related Playbook |
|---|---|---|
| Container Didn't Respond to HTTP Pings | Container fails to start — no HTTP response on expected port | Container Didn't Respond to HTTP Pings |
| Deployment Succeeded but Startup Failed | Deploy green but app down — wrong startup command | Deployment Succeeded but Startup Failed |
| Failed to Forward Request | Platform proxy can't reach app — wrong bind address | Failed to Forward Request |
| Slot Swap Config Drift | Swap succeeds but production restarts or config breaks | Slot Swap Config Drift / Restart Race |
Outbound / Network
| Lab | Symptom | Related Playbook |
|---|---|---|
| SNAT Exhaustion | Outbound connection failures from SNAT port exhaustion | SNAT or Application Issue? |
| DNS Resolution (VNet) | DNS resolution failure for private endpoints in VNet-integrated apps | DNS Resolution (VNet) |
Identity & Deployment
| Lab | Symptom | Related Playbook |
|---|---|---|
| CD Reconnect RBAC Conflict | RoleAssignmentExists on Deployment Center reconnect for container CD with managed-identity ACR pulls | CD RBAC Role Assignment Conflict |
Prerequisites
All labs require:
- Azure subscription with Contributor access
- Azure CLI installed and logged in (
az login) - Bash shell (Linux, macOS, or WSL)
General Workflow
# 1. Create resource group
az group create --name rg-lab-<name> --location koreacentral

# 2. Deploy infrastructure
az deployment group create \
  --resource-group rg-lab-<name> \
  --template-file labs/<name>/main.bicep \
  --parameters baseName=lab<short>

# 3. Deploy app code (zip deploy or local git)
# 4. Run trigger script
# 5. Wait 2-5 minutes for logs to appear
# 6. Run verify script or query Log Analytics manually

# 7. Clean up
az group delete --name rg-lab-<name> --yes --no-wait
Cost
Each lab deploys a B1 App Service Plan. Delete the resource group after completing the lab to avoid ongoing charges.