Restart Timing Correlation
Scenario: Latency/error spikes appear to align with restarts. Data Source: AppServicePlatformLogs Purpose: Lists restart-related platform events to correlate with incident timelines.
graph TD
    A[AppServicePlatformLogs] -->|ContainerRestart| B[Restart Events]
    B --> C[Timeline Projection]
    C --> D[Correlate with Incident Window]
Run It in the Portal
Portal view: Logs blade (Log Analytics query editor)
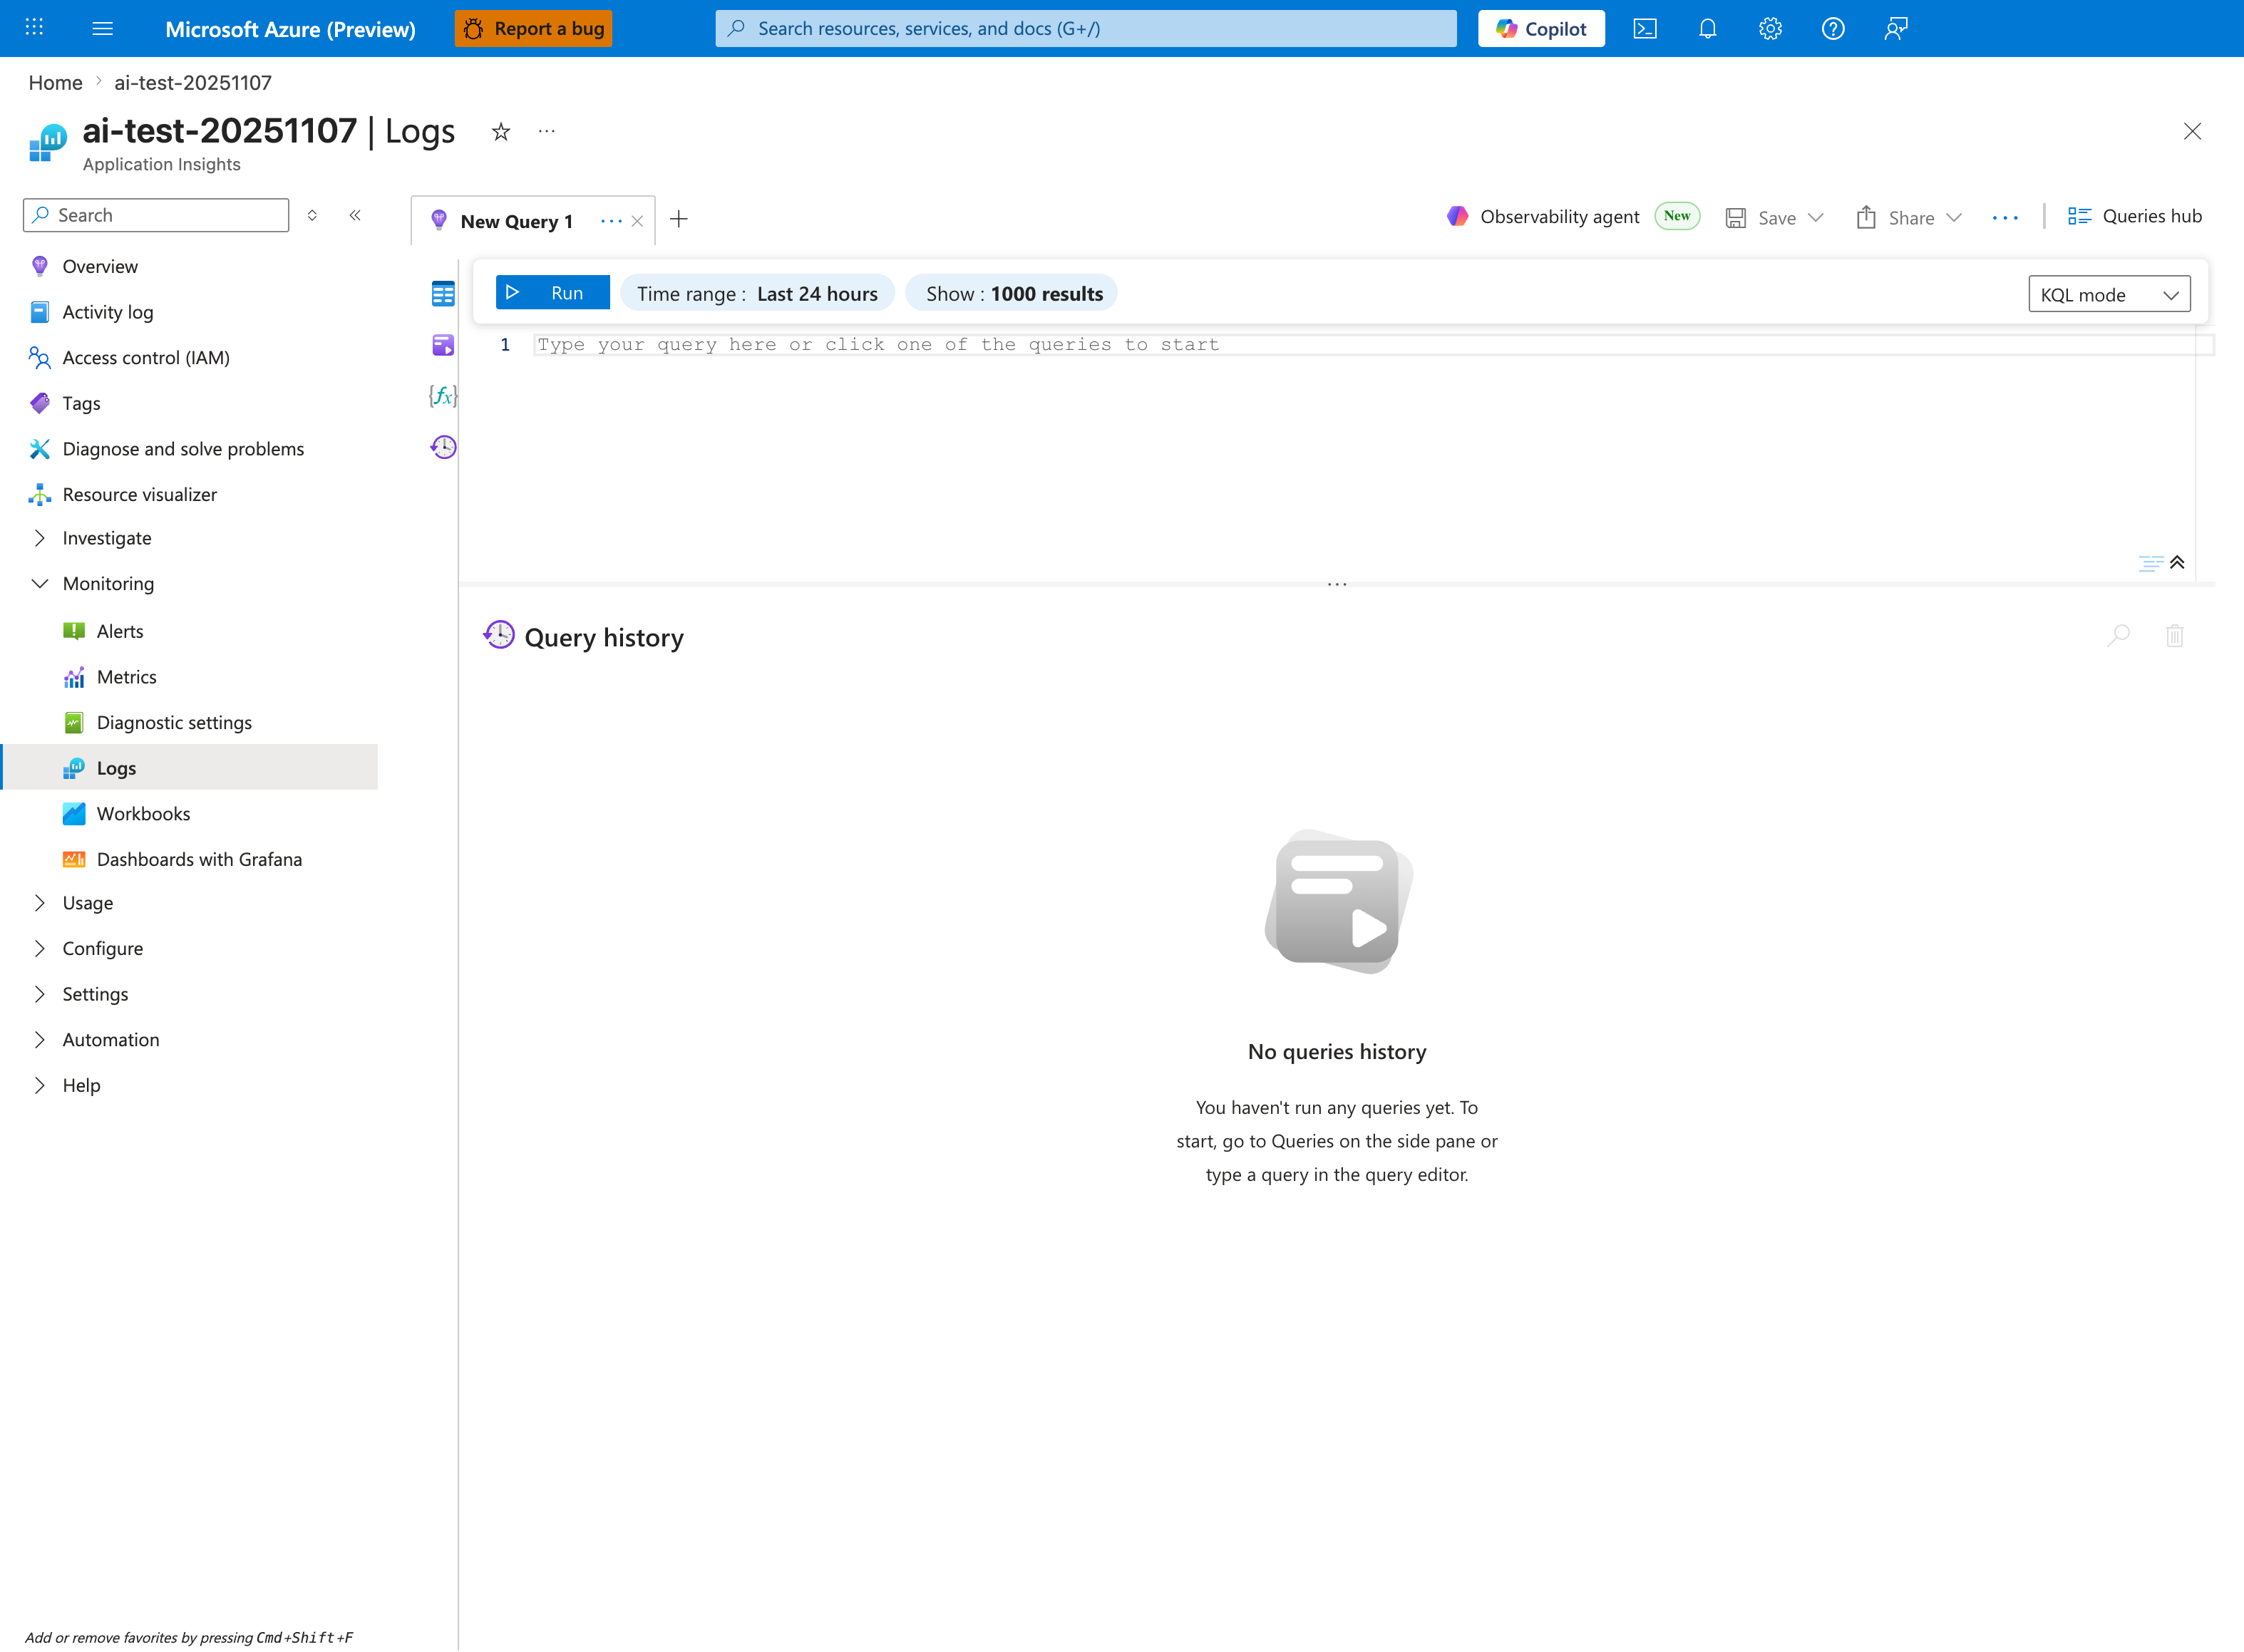
The Logs blade is where the restart-timing query below is pasted - this capture shows the Application Insights Logs experience (ai-test-20251107), but the workspace-based Log Analytics blade renders the same New Query 1 tab and Run toolbar. Replace the placeholder Type your query here or click one of the queries to start with the AppServicePlatformLogs | where OperationName == "ContainerRestart" or OperationName has "restart" block; the inline Time range: Last 24 hours selector already matches the ago(24h) filter inside the query, so no adjustment is required. The query projects three columns (TimeGenerated, OperationName, ContainerId) and orders them descending, so results render as a tabular grid in the lower pane below the placeholder editor - the timeline shape is read by scanning the TimeGenerated column rather than from a chart.
Query
AppServicePlatformLogs
| where TimeGenerated > ago(24h)
| where OperationName == "ContainerRestart" or OperationName has "restart"
| project TimeGenerated, OperationName, ContainerId
| order by TimeGenerated desc
Interpretation Notes
- Normal: occasional isolated restart events with no repeating cadence.
- Abnormal: clustered restart events during user-facing degradation windows.
- Reading tip: correlate event timestamps against 5xx spikes and P95/P99 increases.
Limitations
- Platform log availability and naming can vary by environment/configuration.
- Some restart-like behaviors may be represented by related operation names not captured by this filter.
- This query cannot identify the root cause of restart (app crash vs platform action) by itself.