Repeated Startup Attempts
Scenario: Suspected start/fail loop where the container repeatedly attempts startup. Data Source: AppServicePlatformLogs Purpose: Shows start/stop/fail operation sequences to detect rapid startup cycling.
graph TD
    A[AppServicePlatformLogs] -->|OperationName Filter| B[start / stop / fail Events]
    B --> C[Sequence by ContainerId]
    C --> D[Detect Startup Loop]
Run It in the Portal
Portal view: Logs blade (Log Analytics query editor)
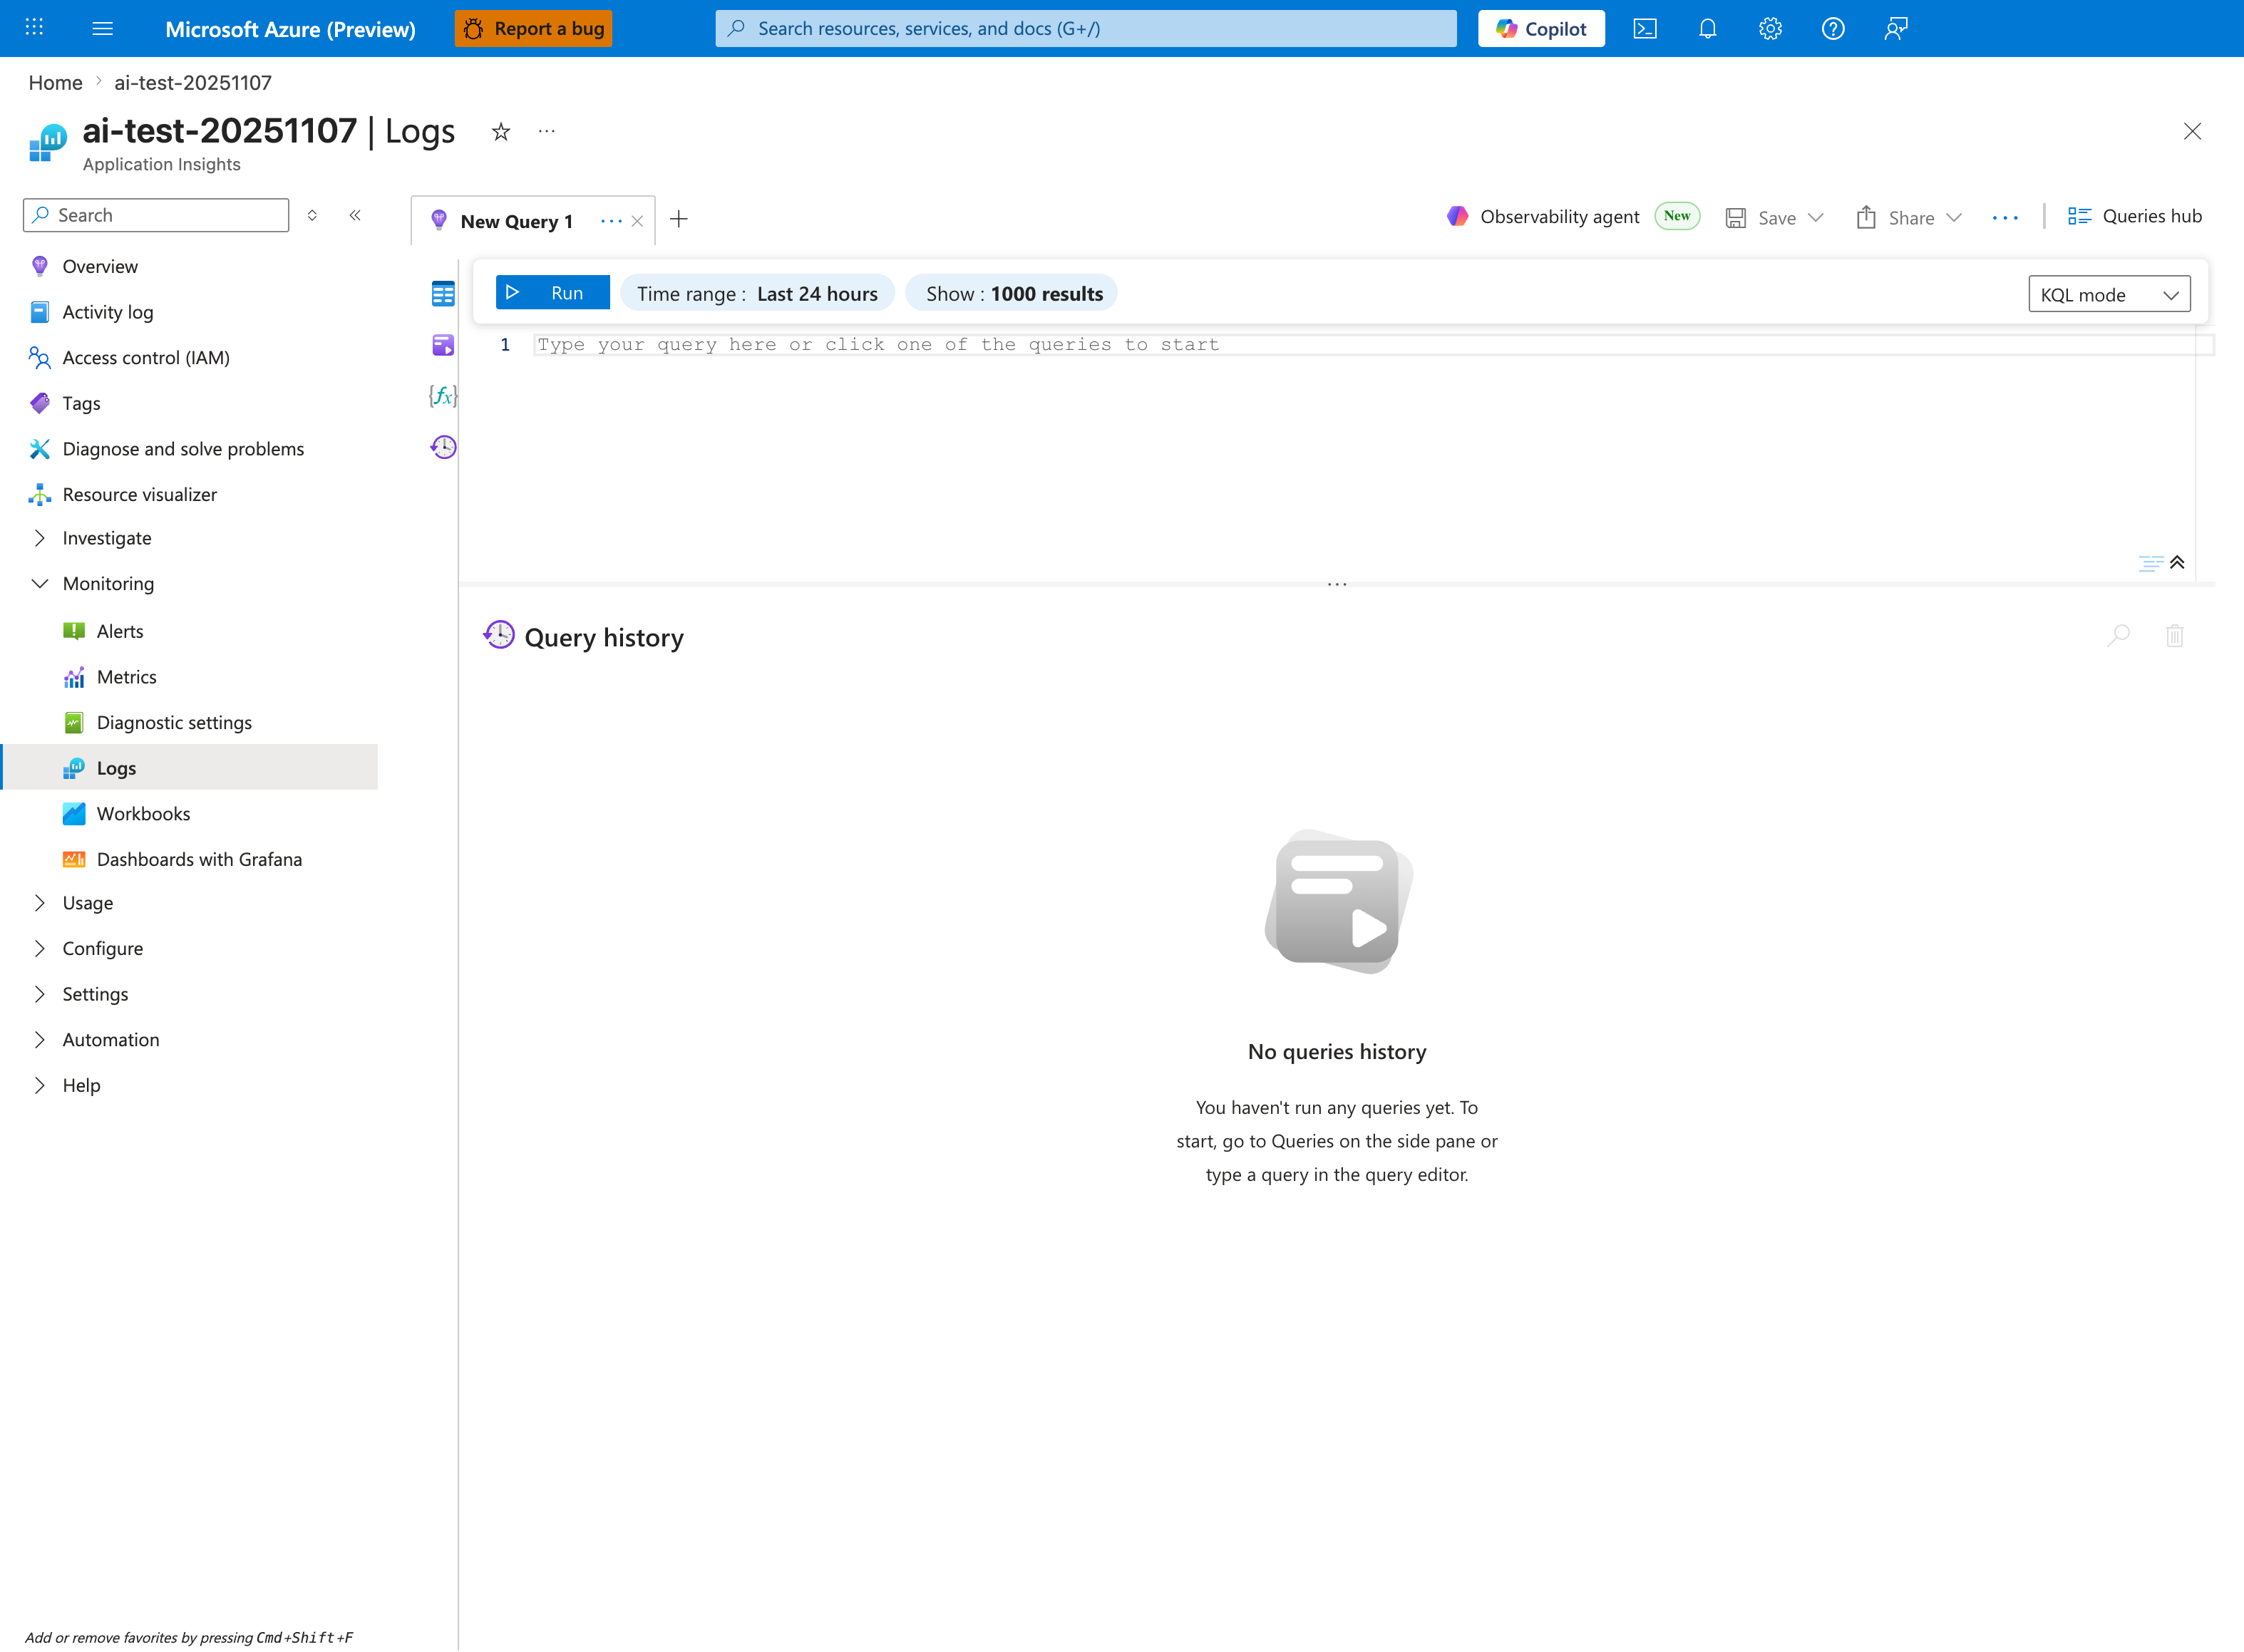
The Logs blade is where the repeated-startup-attempts query below is pasted - this capture shows the Application Insights Logs experience (ai-test-20251107), but the workspace-based Log Analytics blade renders the same New Query 1 tab and Run toolbar. Replace the placeholder Type your query here or click one of the queries to start with the AppServicePlatformLogs | where OperationName has_any ("start", "Start", ...) block; tighten the inline Time range selector from the default Last 24 hours shown here to Last 6 hours so it matches the ago(6h) filter inside the query. The query projects TimeGenerated, OperationName, and ContainerId, so results render as a three-column tabular grid in the lower pane - scan the ContainerId column to verify whether a rapid loop is producing new containers each cycle or reusing one.
Query
AppServicePlatformLogs
| where TimeGenerated > ago(6h)
| where OperationName has_any ("start", "Start", "stop", "Stop", "fail", "Fail")
| project TimeGenerated, OperationName, ContainerId
| order by TimeGenerated desc
Interpretation Notes
- Normal: start events are infrequent and not followed by immediate fail/stop patterns.
- Abnormal: repeated start -> fail/stop loops within short intervals.
- Reading tip: check whether ContainerId changes each cycle (new container attempts) or remains constant.
Limitations
- Ingestion delay can make rapid loops appear incomplete in near-real-time.
- Keyword matching may include non-startup operations that contain similar text.
- This query cannot show application stack traces causing the failure loop.