Slowest Requests by Path
Scenario: Users report slowness, but only for some endpoints. Data Source: AppServiceHTTPLogs Purpose: Ranks request paths by tail latency to identify endpoint-level hotspots.
graph TD
    A[AppServiceHTTPLogs] --> B[Group by CsUriStem]
    B --> C[Avg + P95 Latency per Path]
    C --> D[Top 20 Slowest Endpoints]
Run It in the Portal
Portal view: Logs blade (Log Analytics query editor)
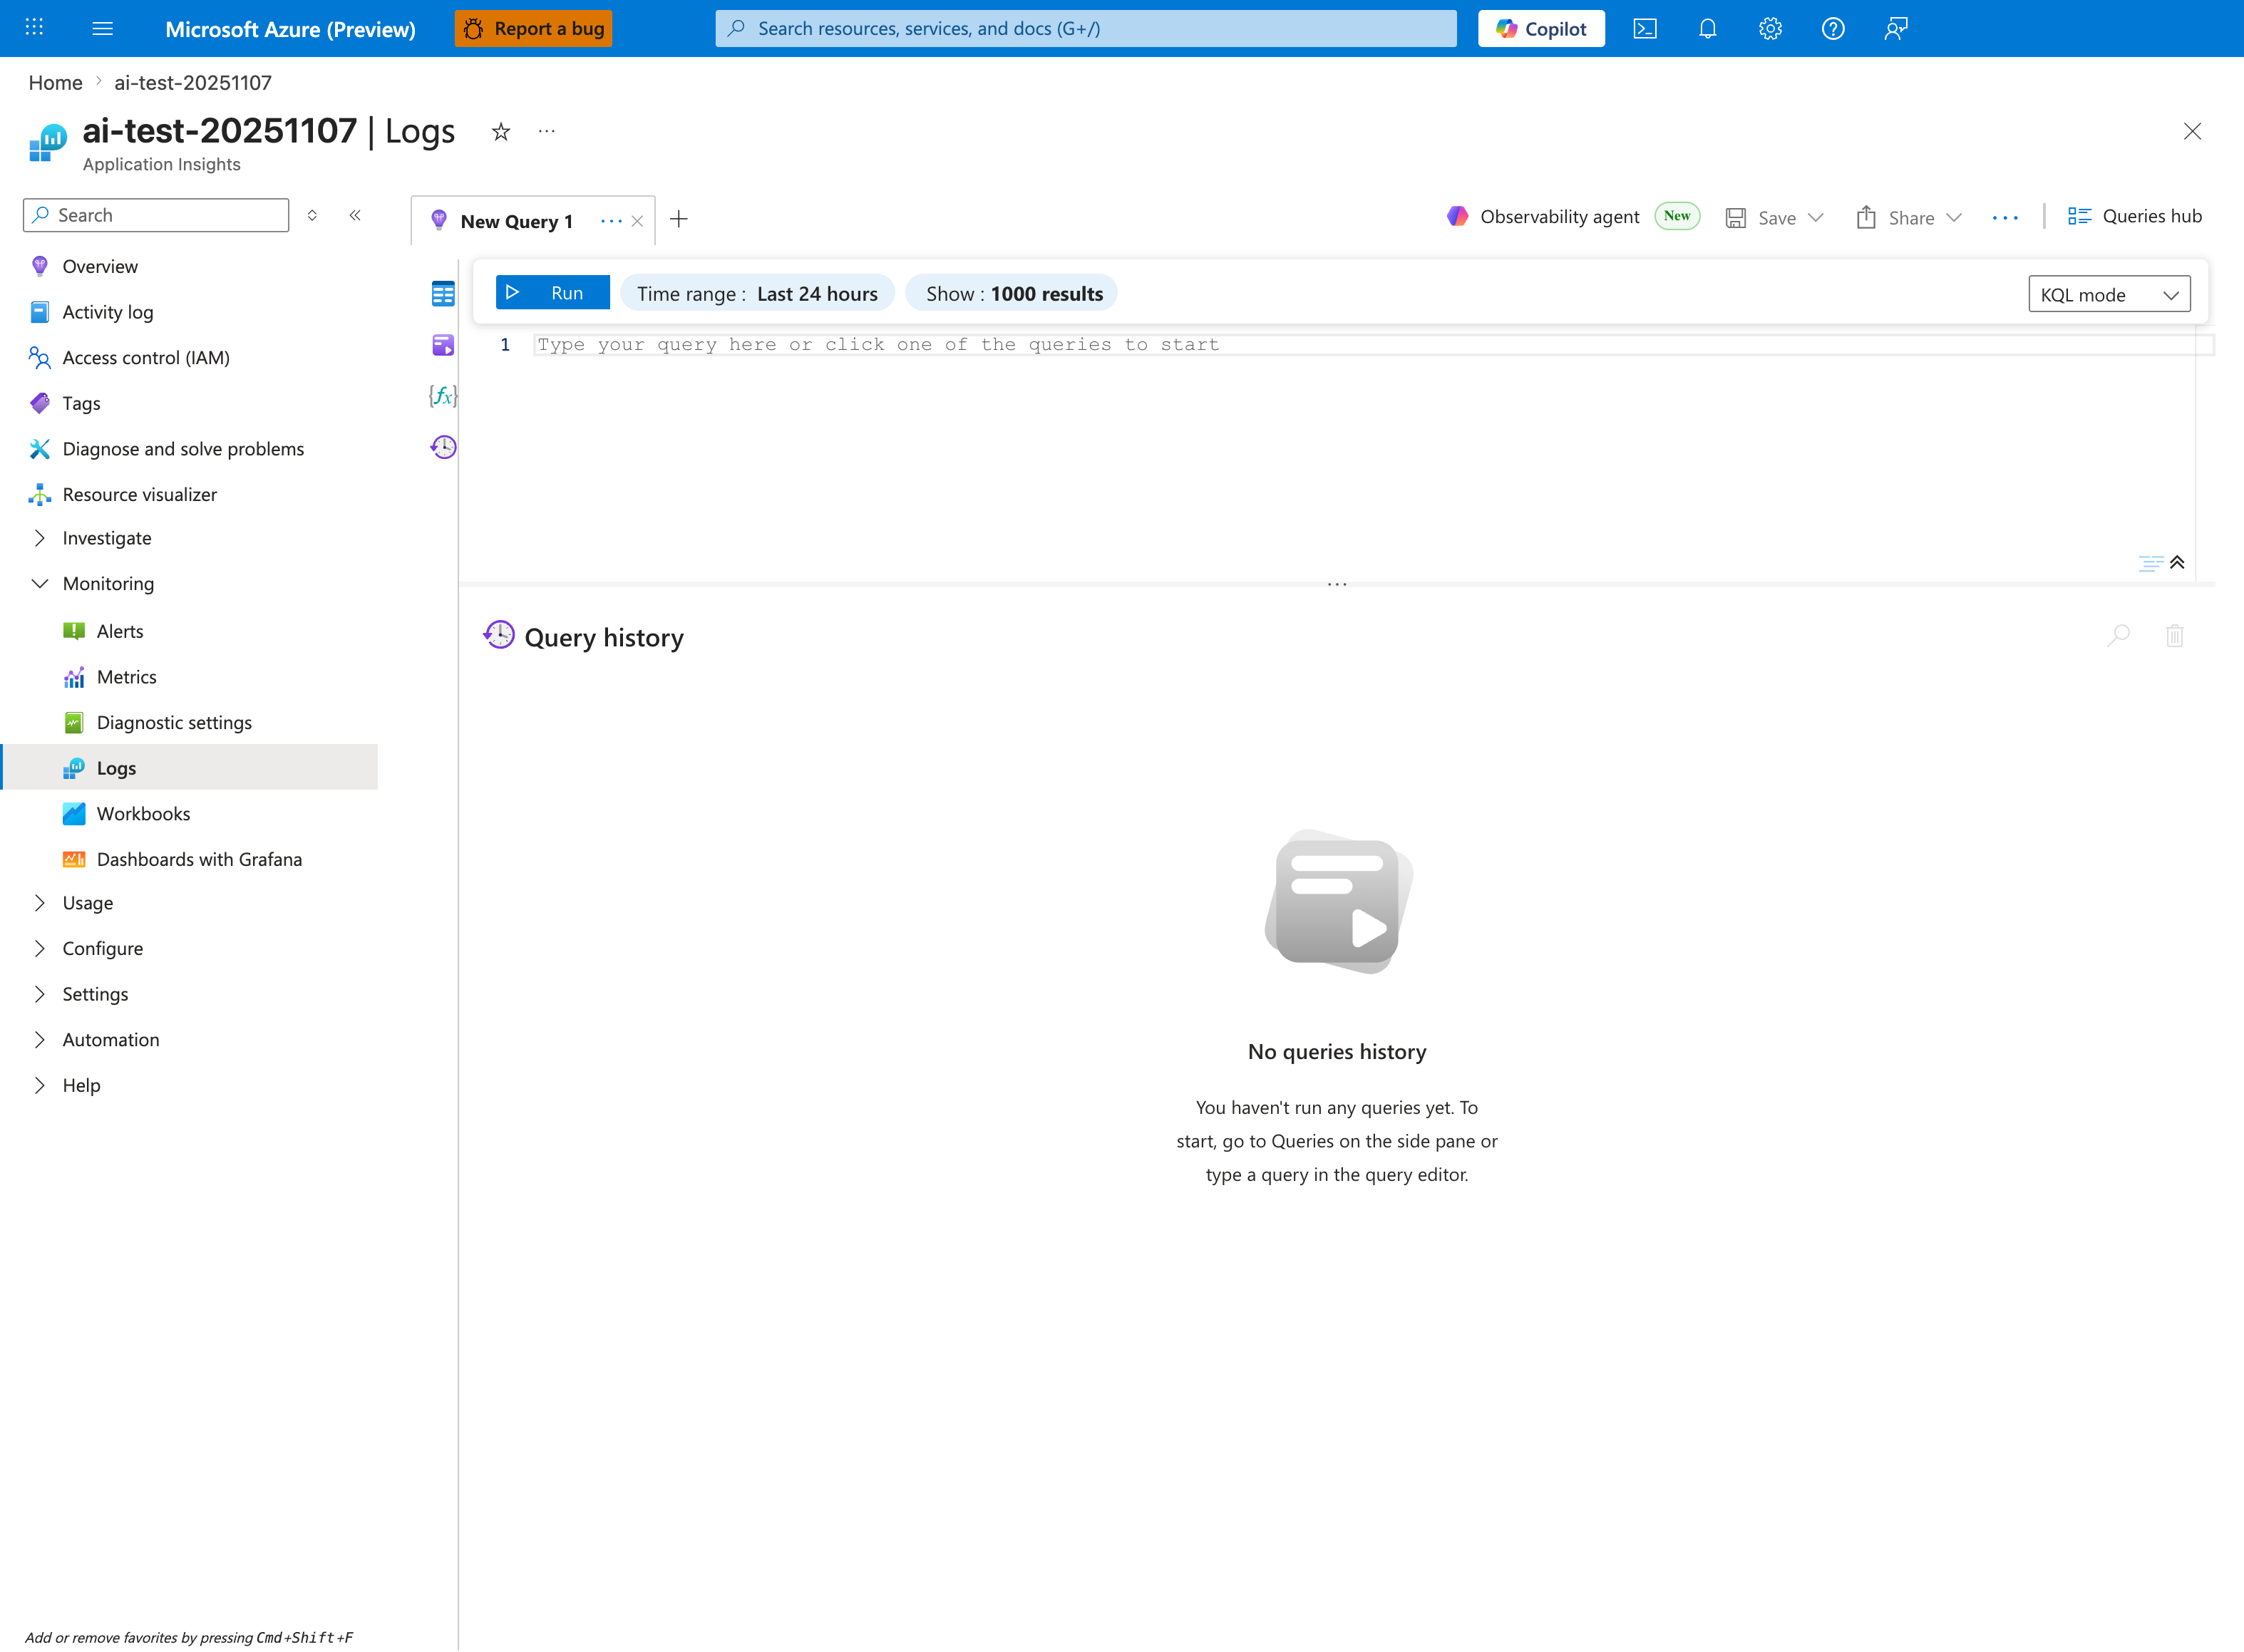
The Logs blade is where the slowest-paths query below is pasted - this capture shows the Application Insights Logs experience (ai-test-20251107), but the workspace-based Log Analytics blade renders the same New Query 1 tab and Run toolbar. The query terminates in top 20 by P95 desc - a ranking far smaller than the Show: 1000 results cap visible on the inline toolbar - so its output renders as a 20-row table (not a timechart) in the lower pane below the placeholder editor. Tighten the inline Time range selector from the default Last 24 hours shown here to Last hour so it matches the ago(1h) filter inside the query (otherwise the P95 percentile is computed over a wider window than the interpretation notes assume). The No queries history message confirms a fresh session.
Query
AppServiceHTTPLogs
| where TimeGenerated > ago(1h)
| summarize AvgTime=avg(TimeTaken), P95=percentile(TimeTaken, 95), Count=count() by CsUriStem
| top 20 by P95 desc
Interpretation Notes
- Normal: top paths have expected P95 relative to their workload type and stable request counts.
- Abnormal: one/few paths show disproportionately high P95 with meaningful request volume.
- Reading tip: prioritize paths with both high P95 and non-trivial Count to avoid chasing one-off outliers.
Limitations
- Freshness depends on logging pipeline delay.
- Paths with very low count can produce unstable percentile values.
- This query cannot reveal internal function-level bottlenecks inside a path.