Latency Trend by Status Code
Scenario: Performance degradation where you need to distinguish normal successful traffic from failing traffic latency. Data Source: AppServiceHTTPLogs Purpose: Shows P50/P95/P99 latency trends split by HTTP status code to identify whether specific status groups are driving tail latency.
graph TD
    A[AppServiceHTTPLogs] --> B[Percentile Calc per Status]
    B --> C[P50 / P95 / P99 by 5m bins]
    C --> D[Timechart: Tail Latency by Status]
Run It in the Portal
Portal view: Logs blade (Log Analytics query editor)
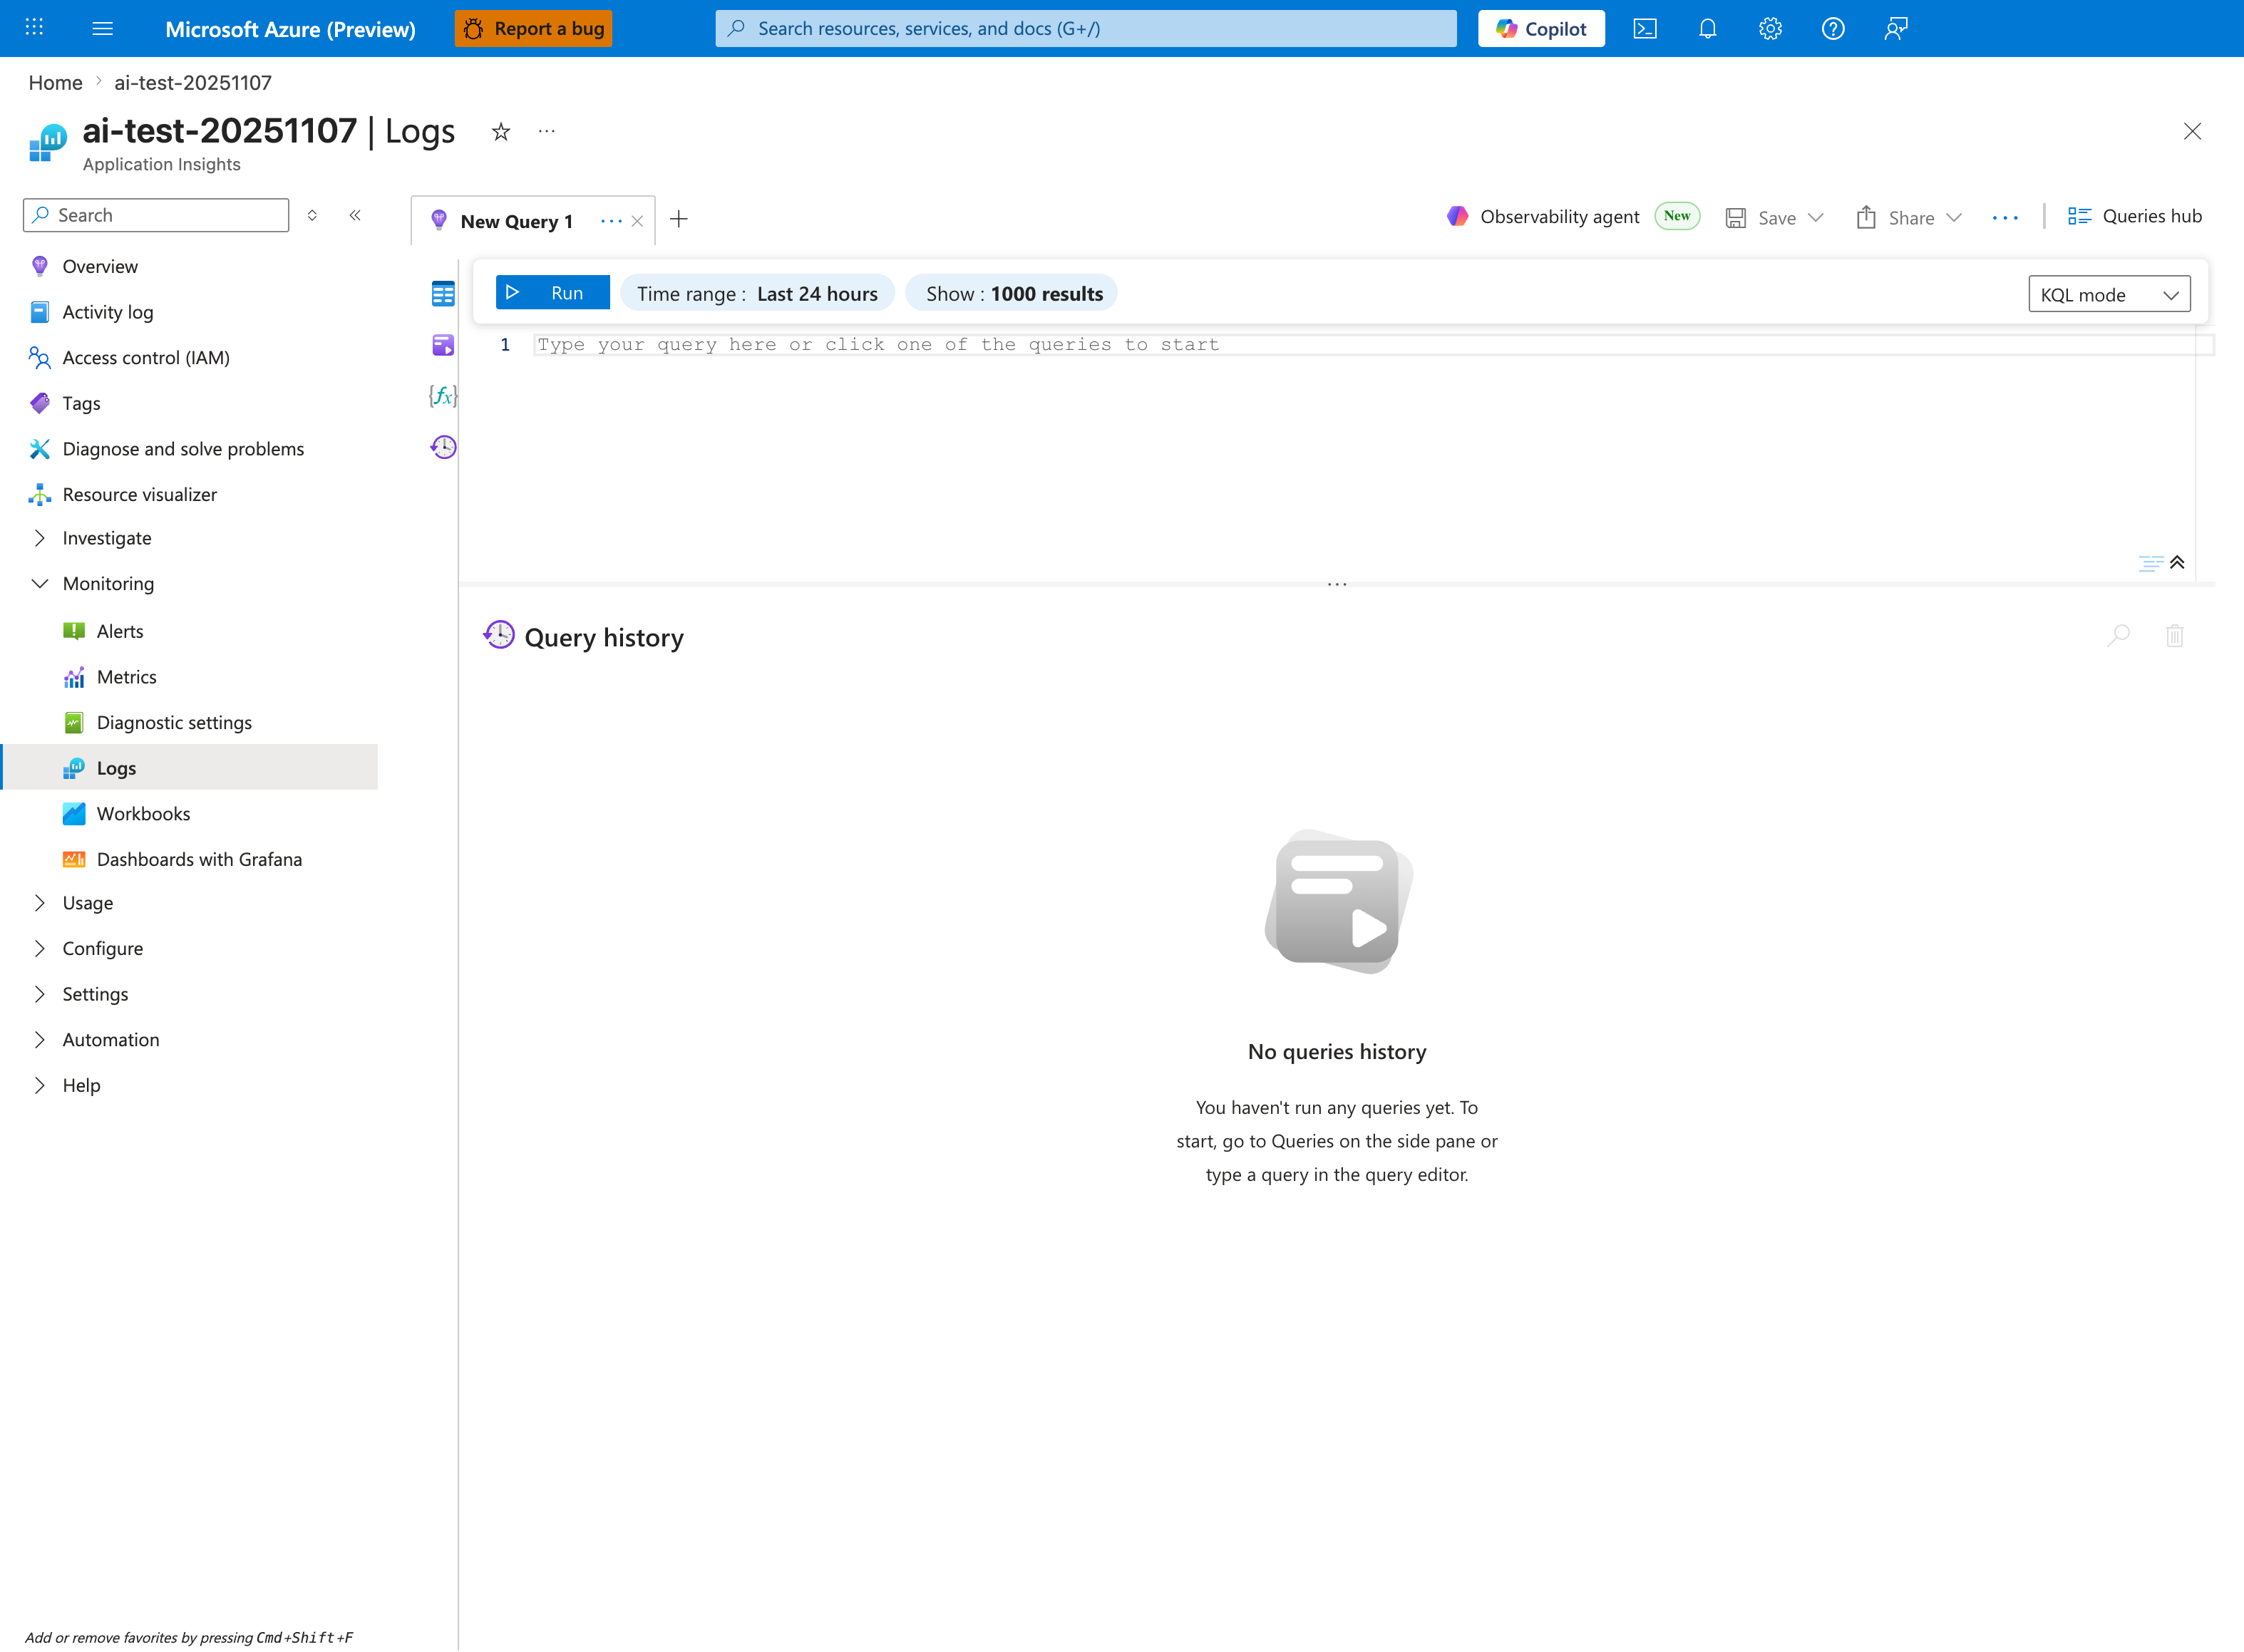
The Logs blade is where the latency-trend query below is pasted - this capture shows the Application Insights Logs experience (ai-test-20251107), but the workspace-based Log Analytics blade renders the same New Query 1 tab and Run toolbar. Replace the placeholder Type your query here or click one of the queries to start with the AppServiceHTTPLogs | summarize P50, P95, P99 ... block; then tighten the inline Time range selector from the default Last 24 hours shown here to Last hour so it matches the ago(1h) filter inside the query (otherwise the percentile bins span a wider window than the interpretation notes assume). The Show: 1000 results cap is sufficient for 5-minute bin output over an hour, and the timechart produced by | render timechart appears inline in the lower pane after Run.
Query
AppServiceHTTPLogs
| where TimeGenerated > ago(1h)
| summarize P50=percentile(TimeTaken, 50), P95=percentile(TimeTaken, 95), P99=percentile(TimeTaken, 99), Count=count() by bin(TimeGenerated, 5m), ScStatus
| render timechart
Interpretation Notes
- Normal: P95/P99 remain relatively stable and do not diverge sharply from P50 for dominant status codes.
- Abnormal: large P95/P99 spikes concentrated in 5xx (or specific 4xx/5xx) indicate error-path slowness or retries.
- Reading tip: compare high-volume status codes first; low-count status groups can look noisy.
Limitations
- Data freshness depends on Diagnostic Settings and Log Analytics ingestion latency.
- Low-traffic periods can distort percentiles because sample size is small.
- This query cannot identify the exact dependency/code path causing latency.