5xx Trend Over Time
Scenario: Intermittent or sustained server-side errors reported by customers. Data Source: AppServiceHTTPLogs Purpose: Tracks 5xx volume over time and separates by status code to detect spikes and dominant failure types.
graph TD
    A[AppServiceHTTPLogs] -->|ScStatus >= 500| B[Filter 5xx]
    B --> C[Count by 15m bins + ScStatus]
    C --> D[Timechart: Spike Detection]
Run It in the Portal
Portal view: Logs blade (Log Analytics query editor)
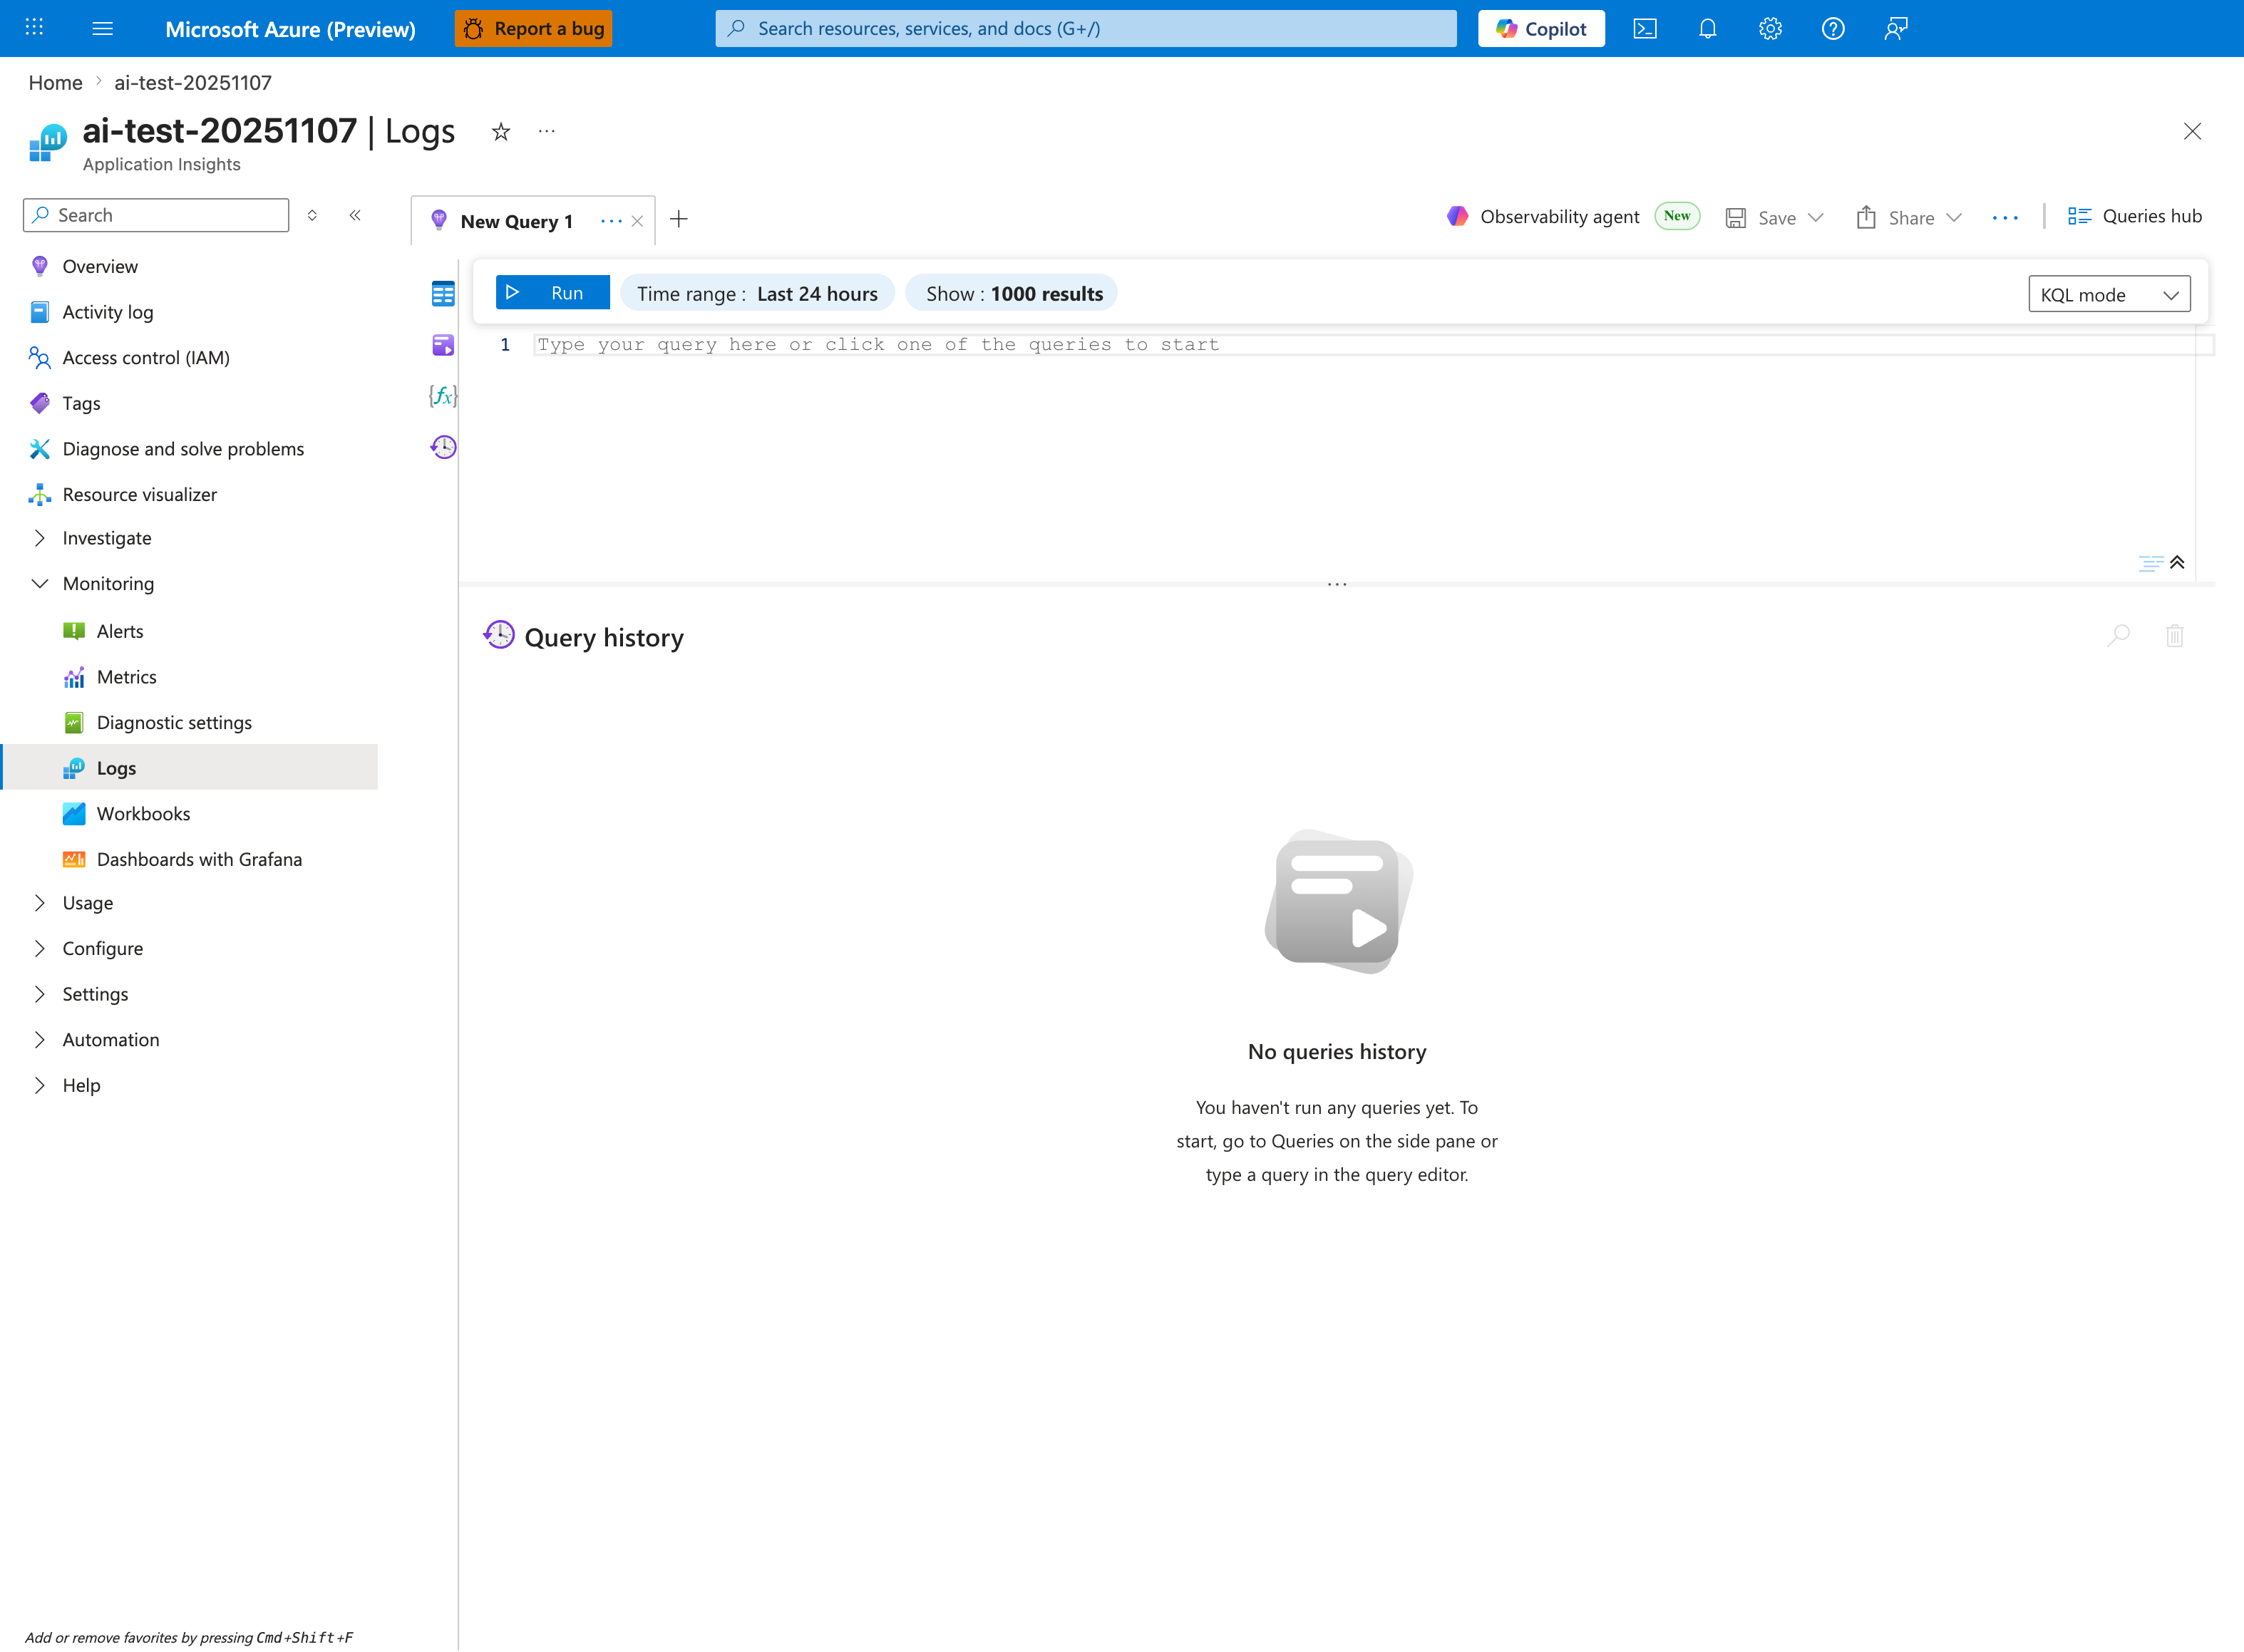
The Logs blade is where the 5xx trend query below is pasted - this capture shows the Application Insights Logs experience (ai-test-20251107), but the workspace-based Log Analytics blade renders the same New Query 1 tab and Run toolbar. Replace the placeholder Type your query here or click one of the queries to start with the AppServiceHTTPLogs | where ScStatus >= 500 | summarize ... block; the inline Time range: Last 24 hours selector already matches the ago(24h) filter inside the query, so no adjustment is required for the default lookback. After Run, the timechart produced by | render timechart appears inline in the lower pane below the placeholder editor. The No queries history message confirms a fresh session - once executed, this query can be recalled or saved via the Queries hub button in the top-right.
Query
AppServiceHTTPLogs
| where TimeGenerated > ago(24h)
| where ScStatus >= 500
| summarize Count=count() by bin(TimeGenerated, 15m), ScStatus
| render timechart
Interpretation Notes
- Normal: low baseline 5xx with occasional isolated blips.
- Abnormal: sustained or bursty 5xx clusters, especially if one status code dominates (for example 502/503/500).
- Reading tip: align spikes with deployments, restarts, and dependency incidents.
Limitations
- Data freshness may lag a few minutes depending on ingestion.
- In low-volume apps, a small number of errors can appear as large percentage impact.
- This query cannot determine whether the error originated in app code, platform, or downstream dependency.