HTTP Queries
Use these queries to quickly establish request latency patterns, error concentration, and endpoint-level hotspots on Azure App Service Linux.
graph TD
    A[AppServiceHTTPLogs] --> B[Latency Trends]
    A --> C[5xx Error Patterns]
    A --> D[Endpoint Hotspots]
    B --> E[Identify Slow Paths]
    C --> E
    D --> E
Run It in the Portal
Portal view: Logs blade (Log Analytics query editor)
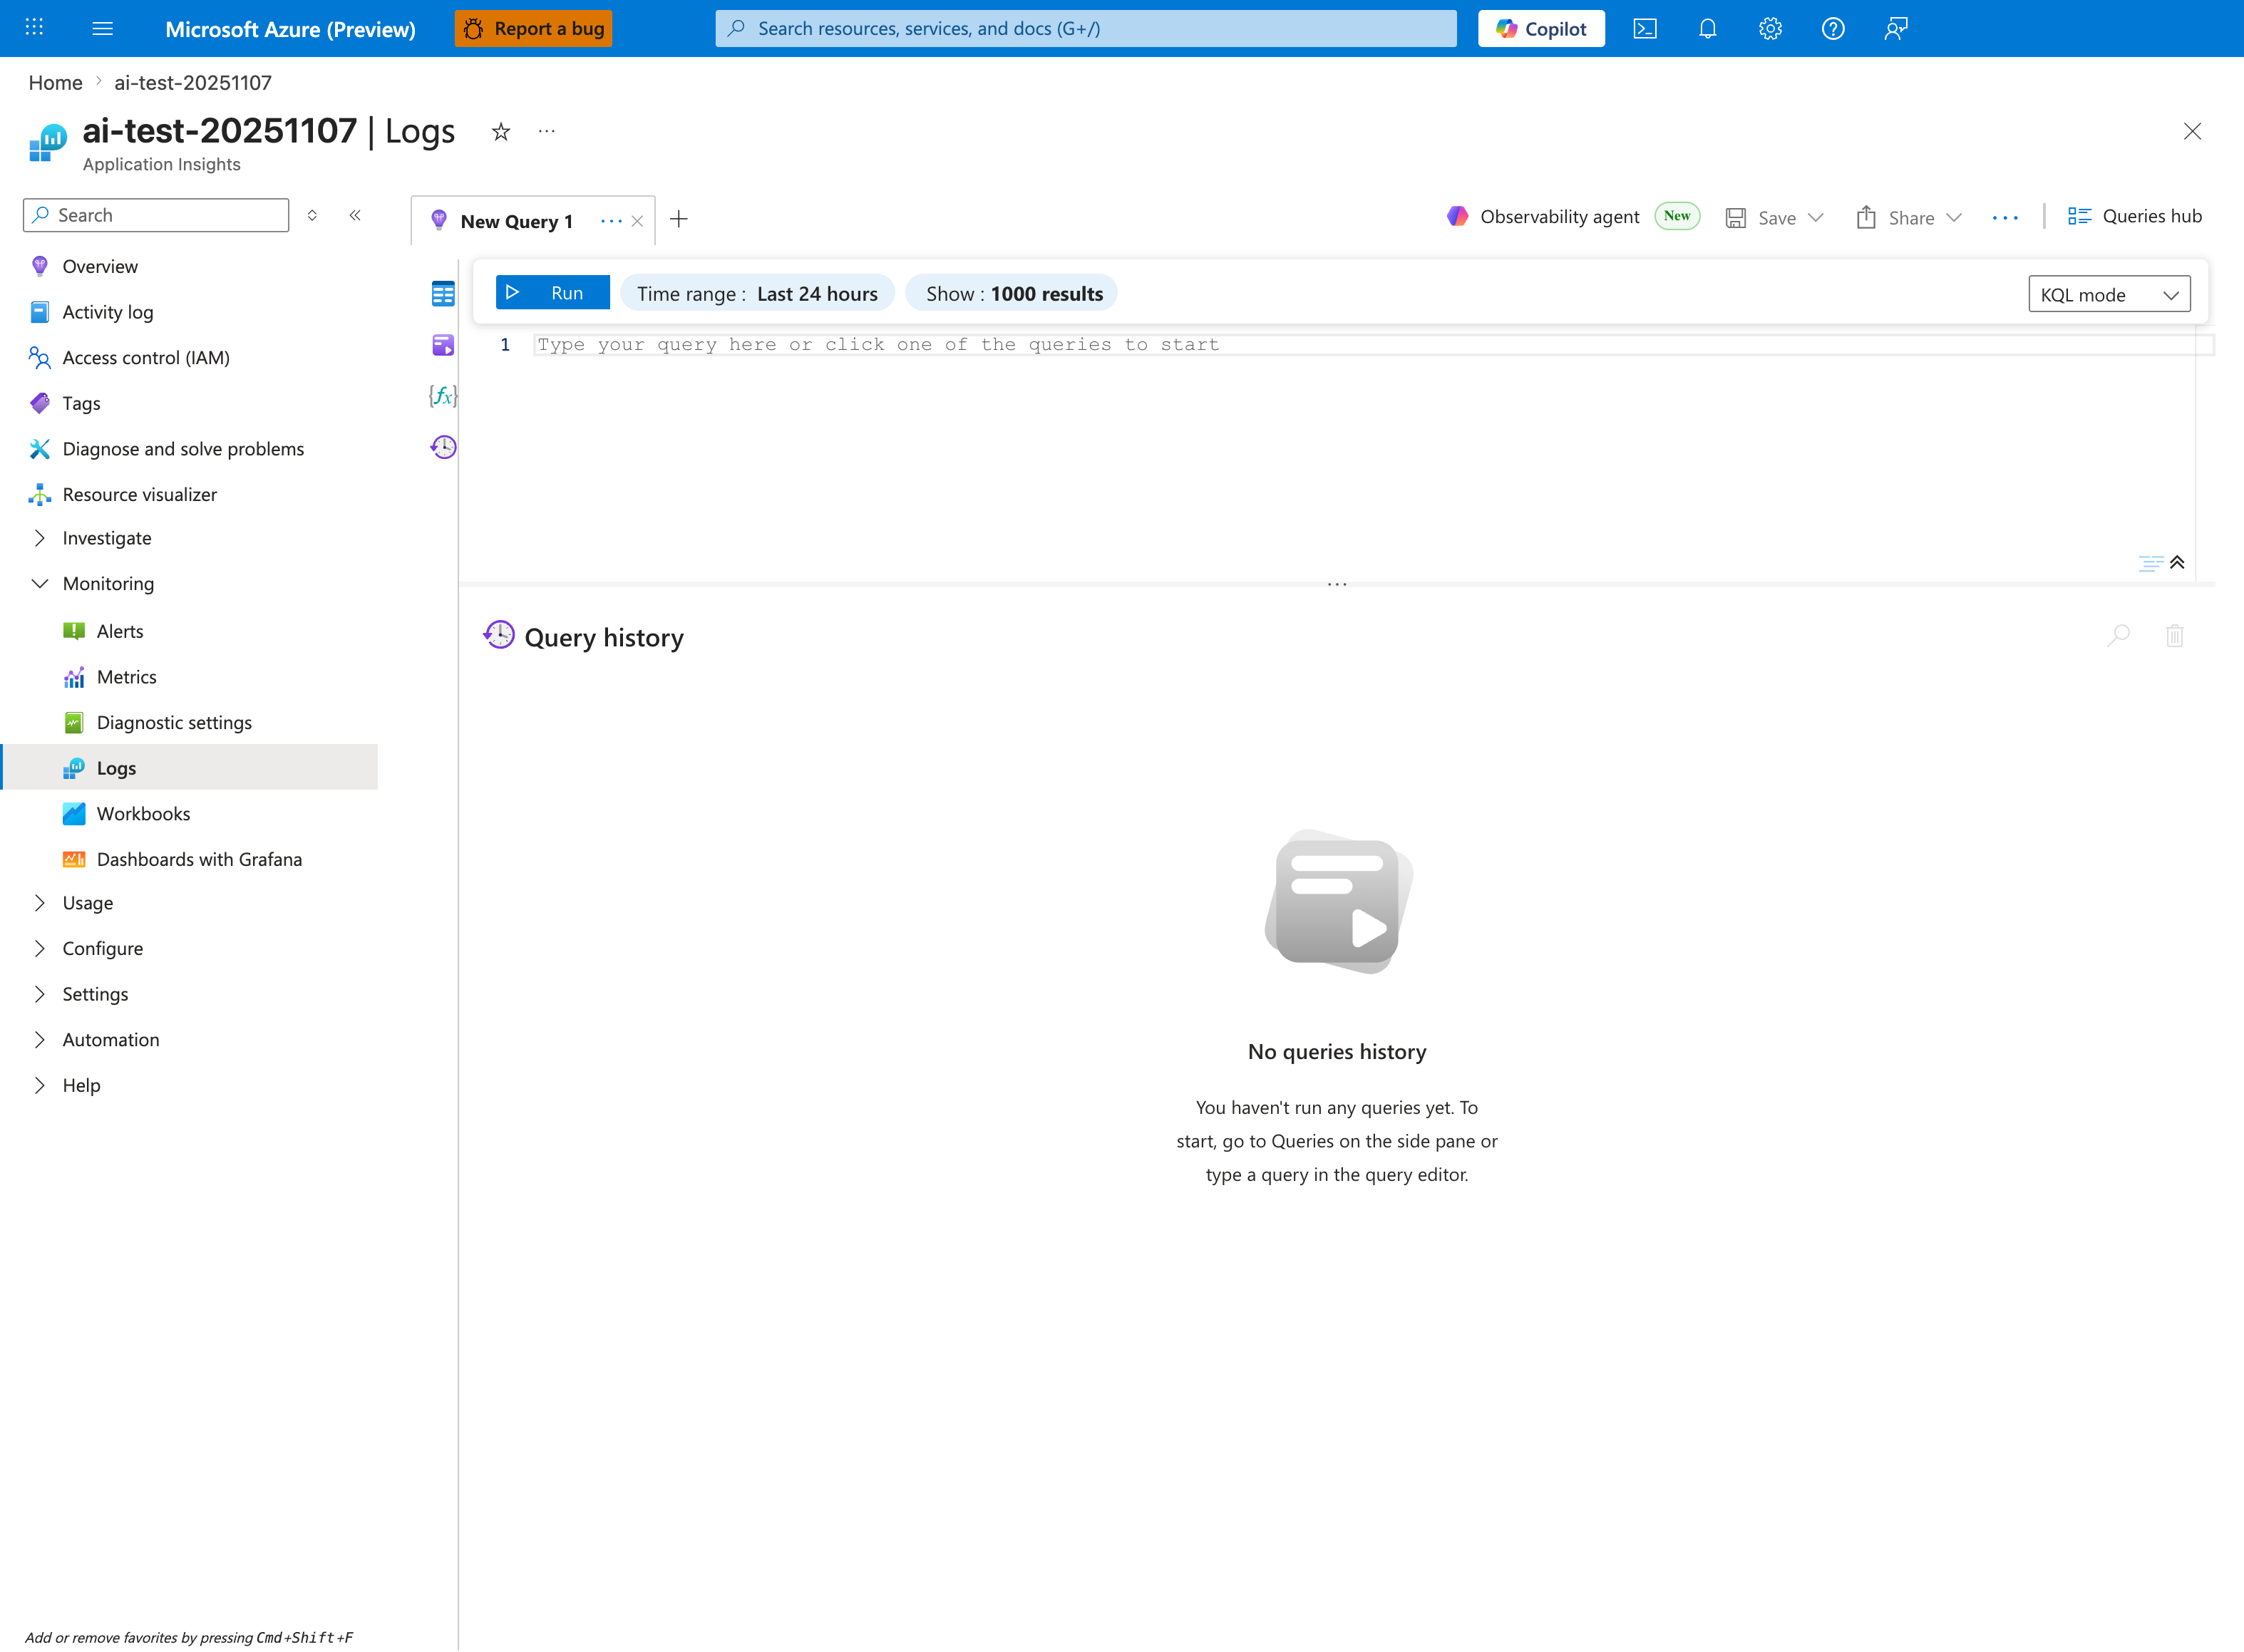
The Logs blade is where all three HTTP queries in this pack are pasted - this capture shows the Application Insights Logs experience (ai-test-20251107), but the workspace-based Log Analytics blade renders the same New Query 1 tab, Run toolbar, and Time range: Last 24 hours selector. Each query in the pack starts from AppServiceHTTPLogs, so the empty Query history pane (currently showing No queries history) will fill with AppServiceHTTPLogs | where ... entries after the first Run. Keep Show: 1000 results selected so latency-percentile bins and status-code distributions are not truncated in the lower result pane; the timechart visualizations produced by | render timechart appear inline once the query completes.