Restarts vs Latency
Scenario: Determine whether restart events align with latency degradation windows. Data Source: AppServiceHTTPLogs and AppServicePlatformLogs Purpose: Combines latency and restart-event signals in a single timeline using union.
graph TD
    A[AppServiceHTTPLogs] --> B[Avg Latency Series]
    C[AppServicePlatformLogs] --> D[Restart Count Series]
    B --> E[Union Timechart]
    D --> E
Run It in the Portal
Portal view: Logs blade (Log Analytics query editor)
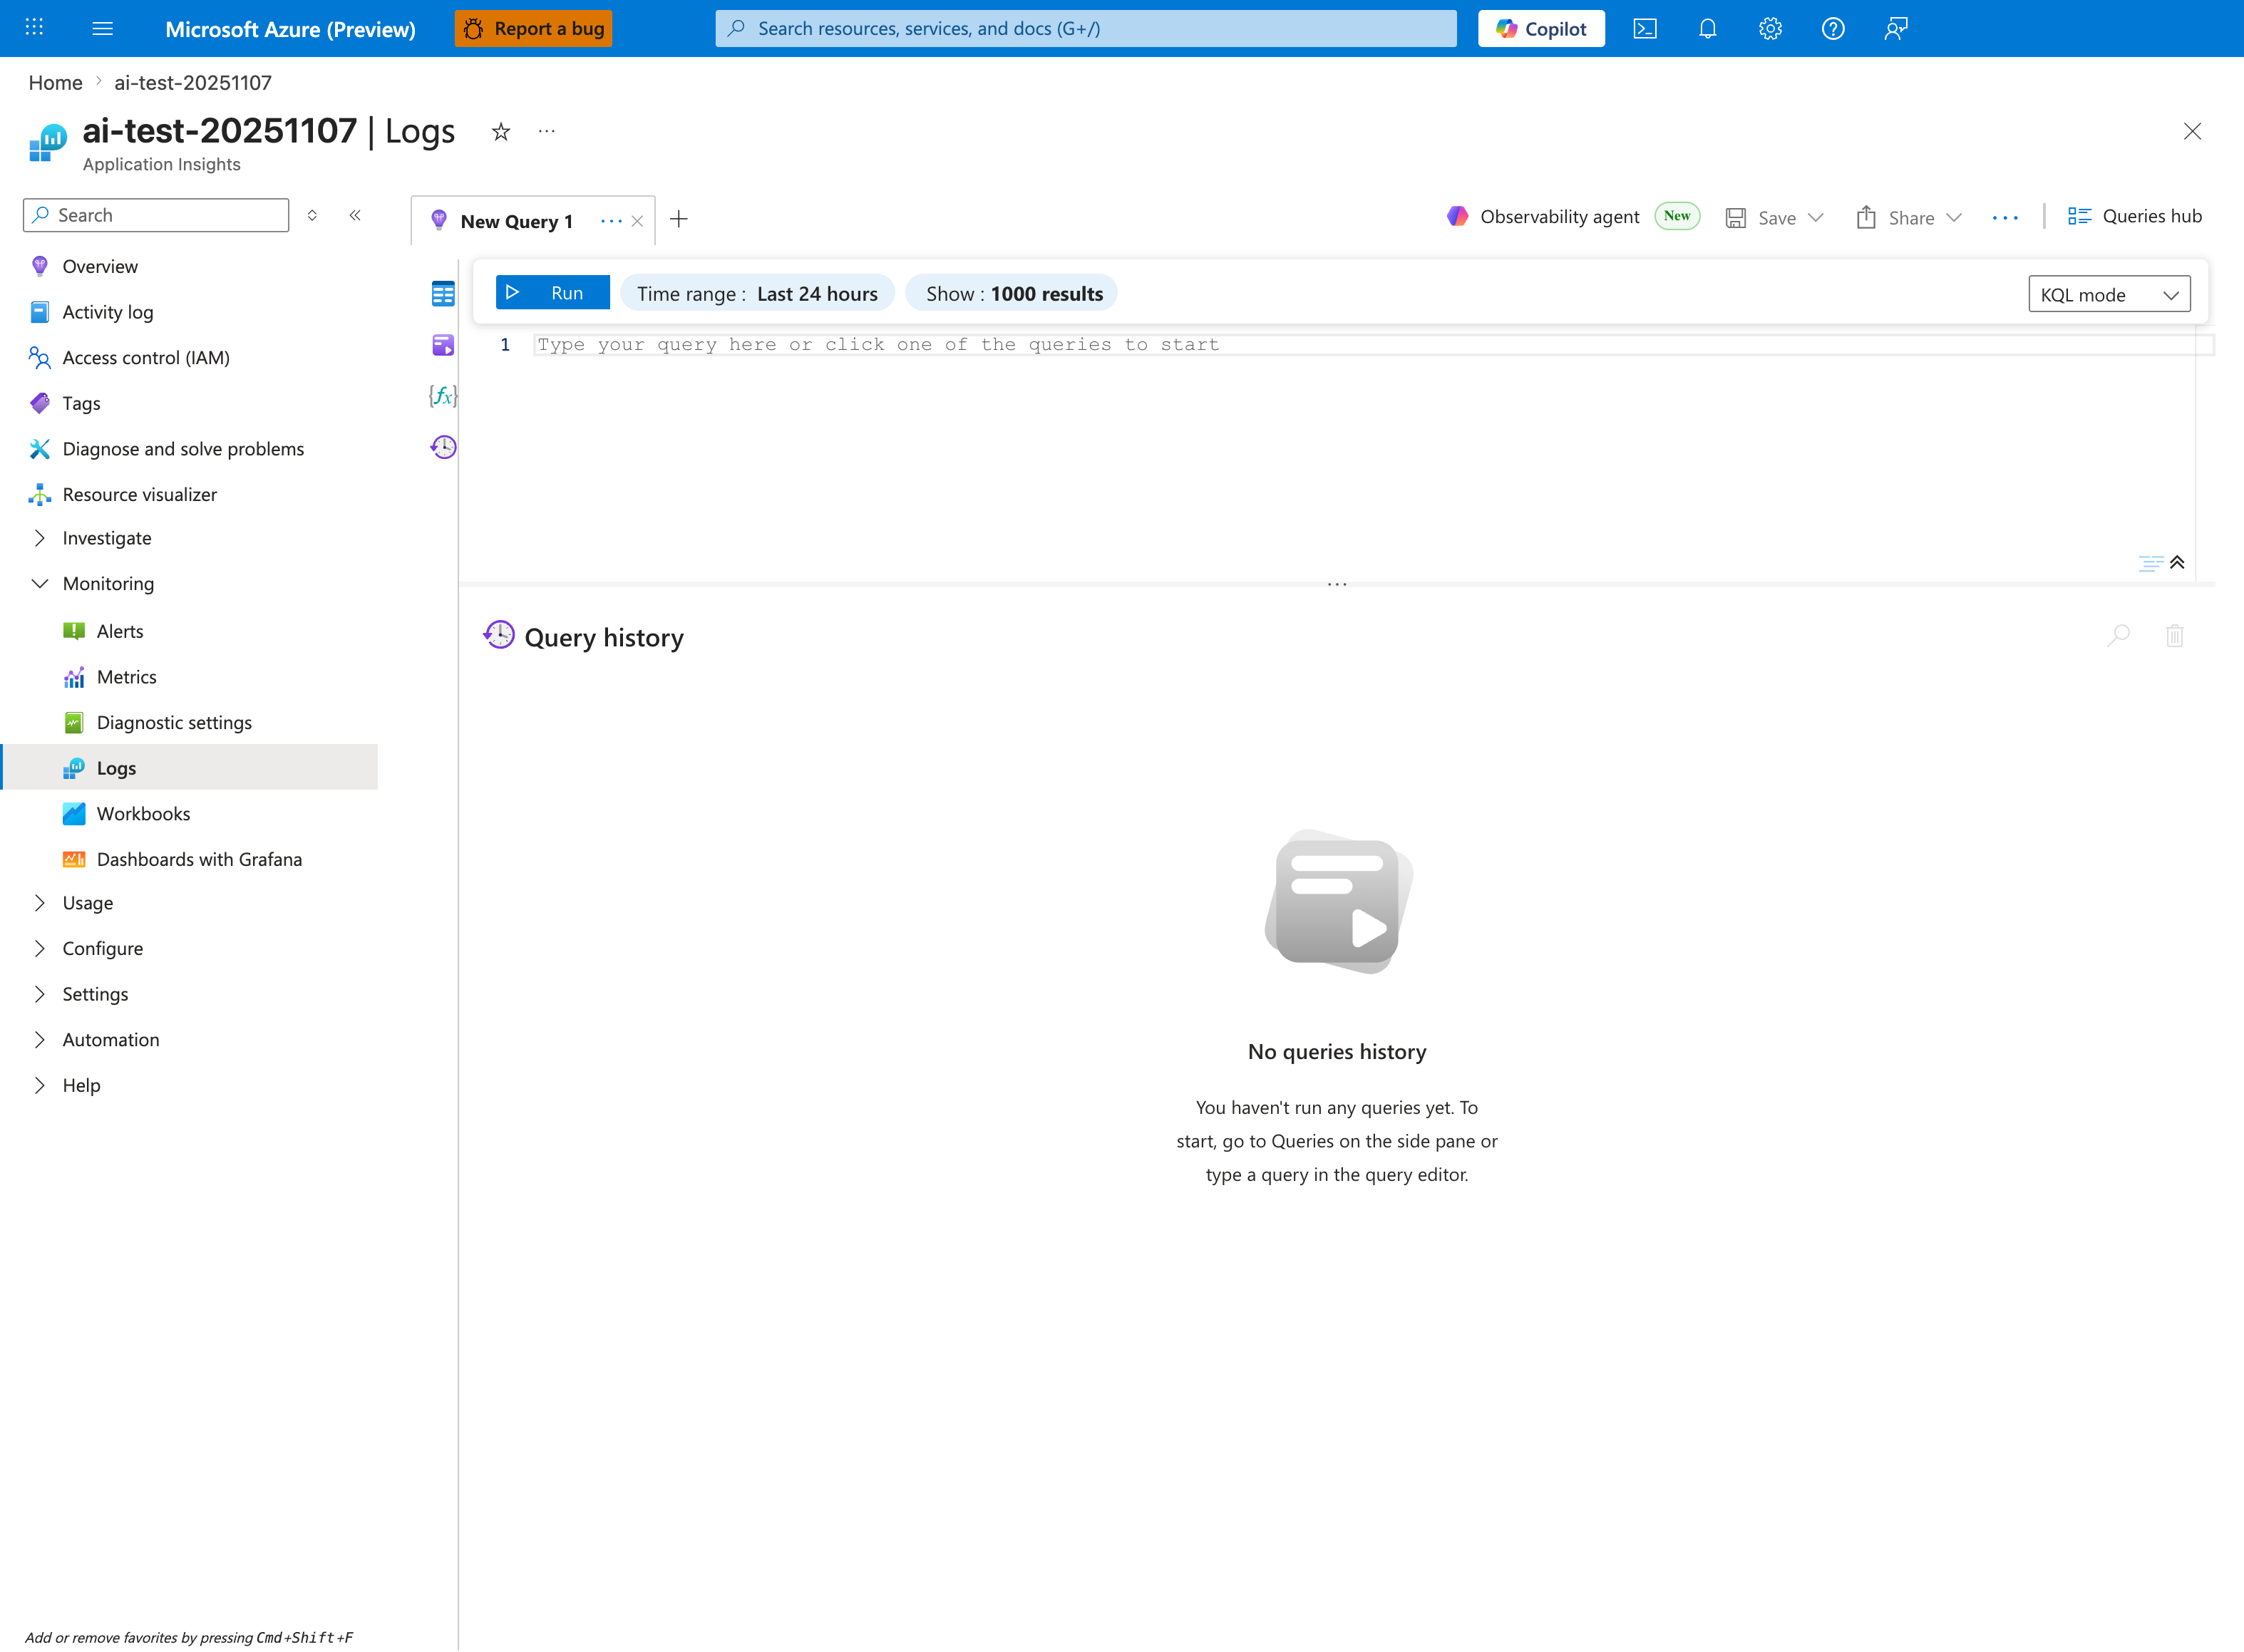
The Logs blade is where the restarts-vs-latency union query below is pasted - this capture shows the Application Insights Logs experience (ai-test-20251107), but the workspace-based Log Analytics blade renders the same New Query 1 tab and Run toolbar. The query is built around let LatencySeries = ...; let RestartSeries = ...; union ...; render timechart, so the two series render together as a single timechart in the lower pane after Run. Tighten the inline Time range selector from the default Last 24 hours shown here to a 6-hour window to match the ago(6h) filter inside each subquery (otherwise the bin(TimeGenerated, 5m) bucketing operates over a wider range than the interpretation notes assume).
Query
let LatencySeries =
    AppServiceHTTPLogs
    | where TimeGenerated > ago(6h)
    | summarize Value=avg(TimeTaken) by bin(TimeGenerated, 5m)
    | project TimeGenerated, Metric="AvgLatencyMs", Value=todouble(Value);
let RestartSeries =
    AppServicePlatformLogs
    | where TimeGenerated > ago(6h)
    | where OperationName has_any ("restart", "Restart", "ContainerRestart")
    | summarize Value=count() by bin(TimeGenerated, 5m)
    | project TimeGenerated, Metric="RestartEvents", Value=todouble(Value);
union LatencySeries, RestartSeries
| order by TimeGenerated asc
| render timechart
Interpretation Notes
- Normal: restart events are rare and latency remains stable before/after isolated events.
- Abnormal: restart-event bins coincide with or immediately precede sustained latency increases.
- Reading tip: treat repeated restart-event clusters with simultaneous latency rise as strong instability signal.
Limitations
- Metric scales differ (milliseconds vs event counts) and may require separate visualization for precision.
- Near-real-time ingestion delays can briefly misalign restart and latency points.
- This query cannot prove causation; correlated events may share a third underlying cause.