Latency vs Errors
Scenario: Need to confirm whether rising latency and 5xx error rate are coupled. Data Source: AppServiceHTTPLogs Purpose: Correlates average latency, error rate, and request volume over the same bins.
graph TD
    A[AppServiceHTTPLogs] --> B[Avg Latency per 5m]
    A --> C[Error Rate per 5m]
    B --> D[Coupled Signal Detection]
    C --> D
Run It in the Portal
Portal view: Logs blade (Log Analytics query editor)
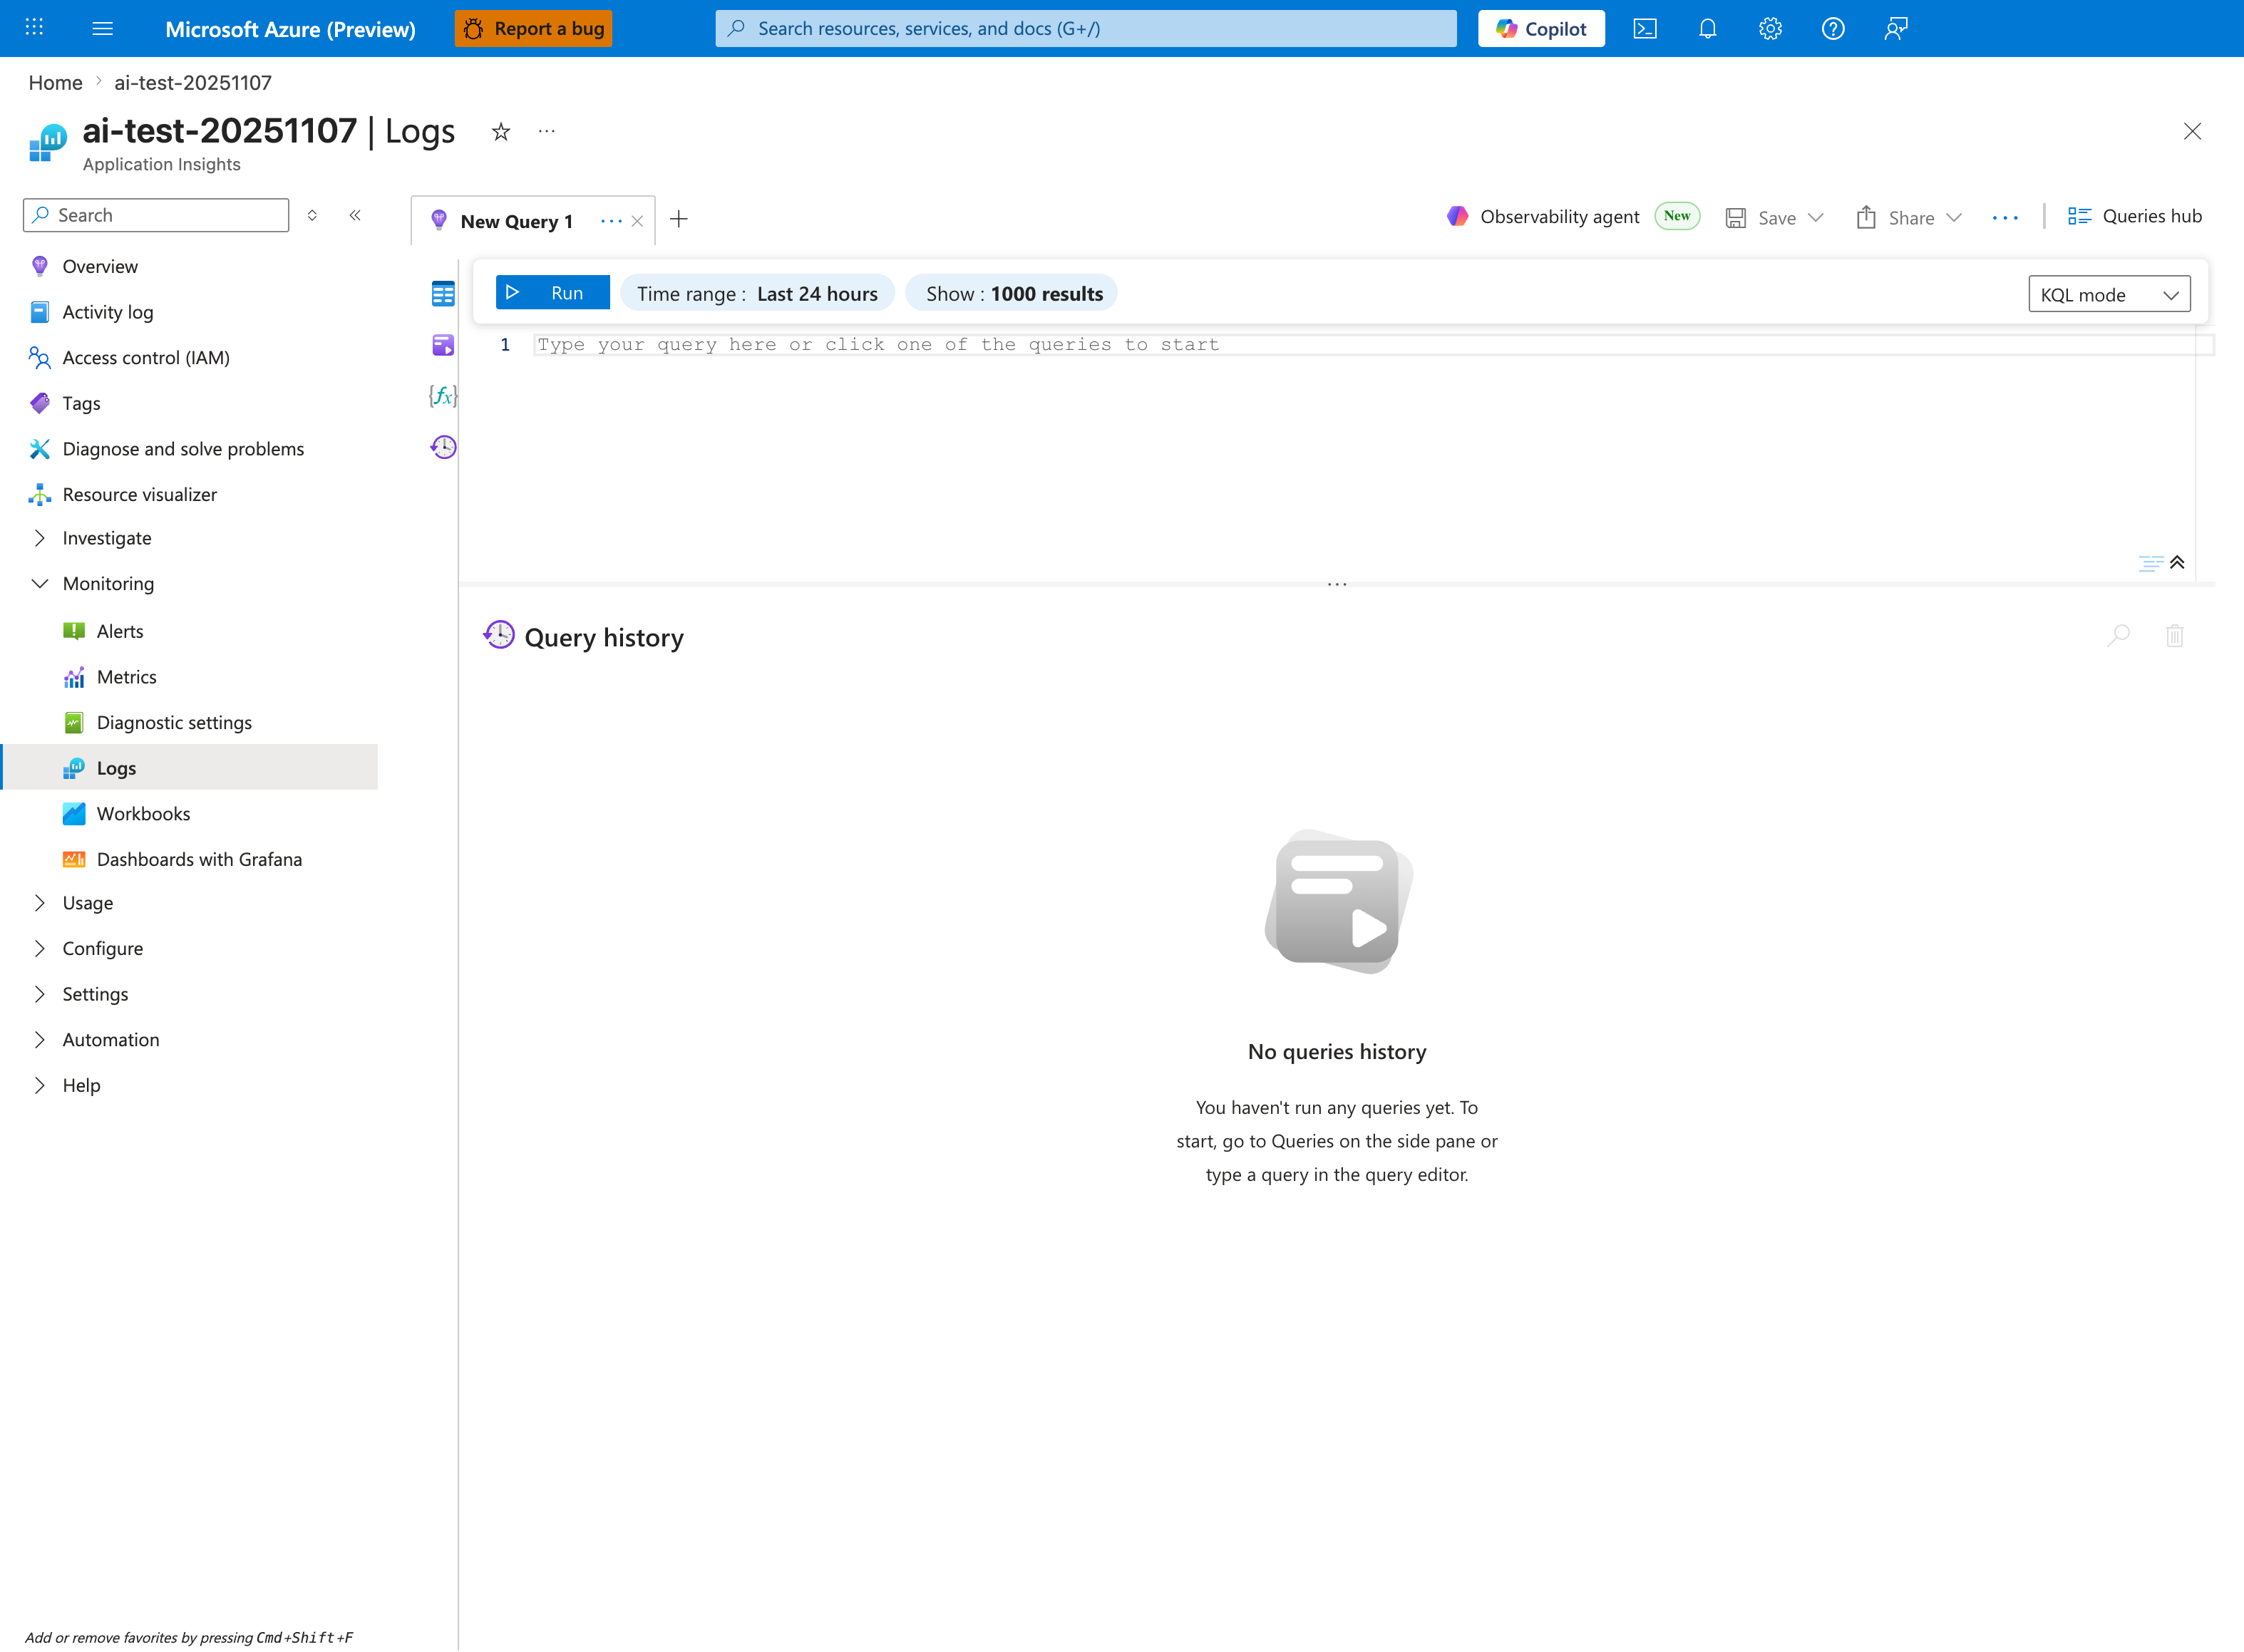
The Logs blade is where the latency-vs-errors correlation query below is pasted - this capture shows the Application Insights Logs experience (ai-test-20251107), but the workspace-based Log Analytics blade renders the same New Query 1 tab and Run toolbar. The query summarizes three series (AvgLatency, ErrorRate, TotalRequests) into one | render timechart, so once executed it draws a three-series chart in the lower pane below the placeholder editor. Tighten the inline Time range selector from the default Last 24 hours shown here to Last hour so it matches the ago(1h) filter inside the query; the empty Query history pane confirms this is a fresh session that the first Run populates.
Query
AppServiceHTTPLogs
| where TimeGenerated > ago(1h)
| summarize AvgLatency=avg(TimeTaken), ErrorRate=countif(ScStatus >= 500) * 100.0 / count(), TotalRequests=count() by bin(TimeGenerated, 5m)
| render timechart
Interpretation Notes
- Normal: latency and error rate remain near baseline; request volume fluctuations do not trigger instability.
- Abnormal: latency and error rate rise together, especially under stable/high request volume.
- Reading tip: if latency rises first and errors follow, investigate queueing/saturation and dependency slowness.
Limitations
- Average latency can hide tail behavior; pair with percentile queries for full picture.
- Short windows with low request count can produce volatile error-rate percentages.
- This query cannot isolate whether errors originate in app runtime, platform, or dependency.