Correlation Queries
Use these queries to correlate major signals (latency, error rate, and restart events) in one timeline.
graph TD
    A[AppServiceHTTPLogs] --> C[Latency + Error Rate]
    B[AppServicePlatformLogs] --> D[Restart Events]
    C --> E[Unified Timeline]
    D --> E
Run It in the Portal
Portal view: Logs blade (Log Analytics query editor)
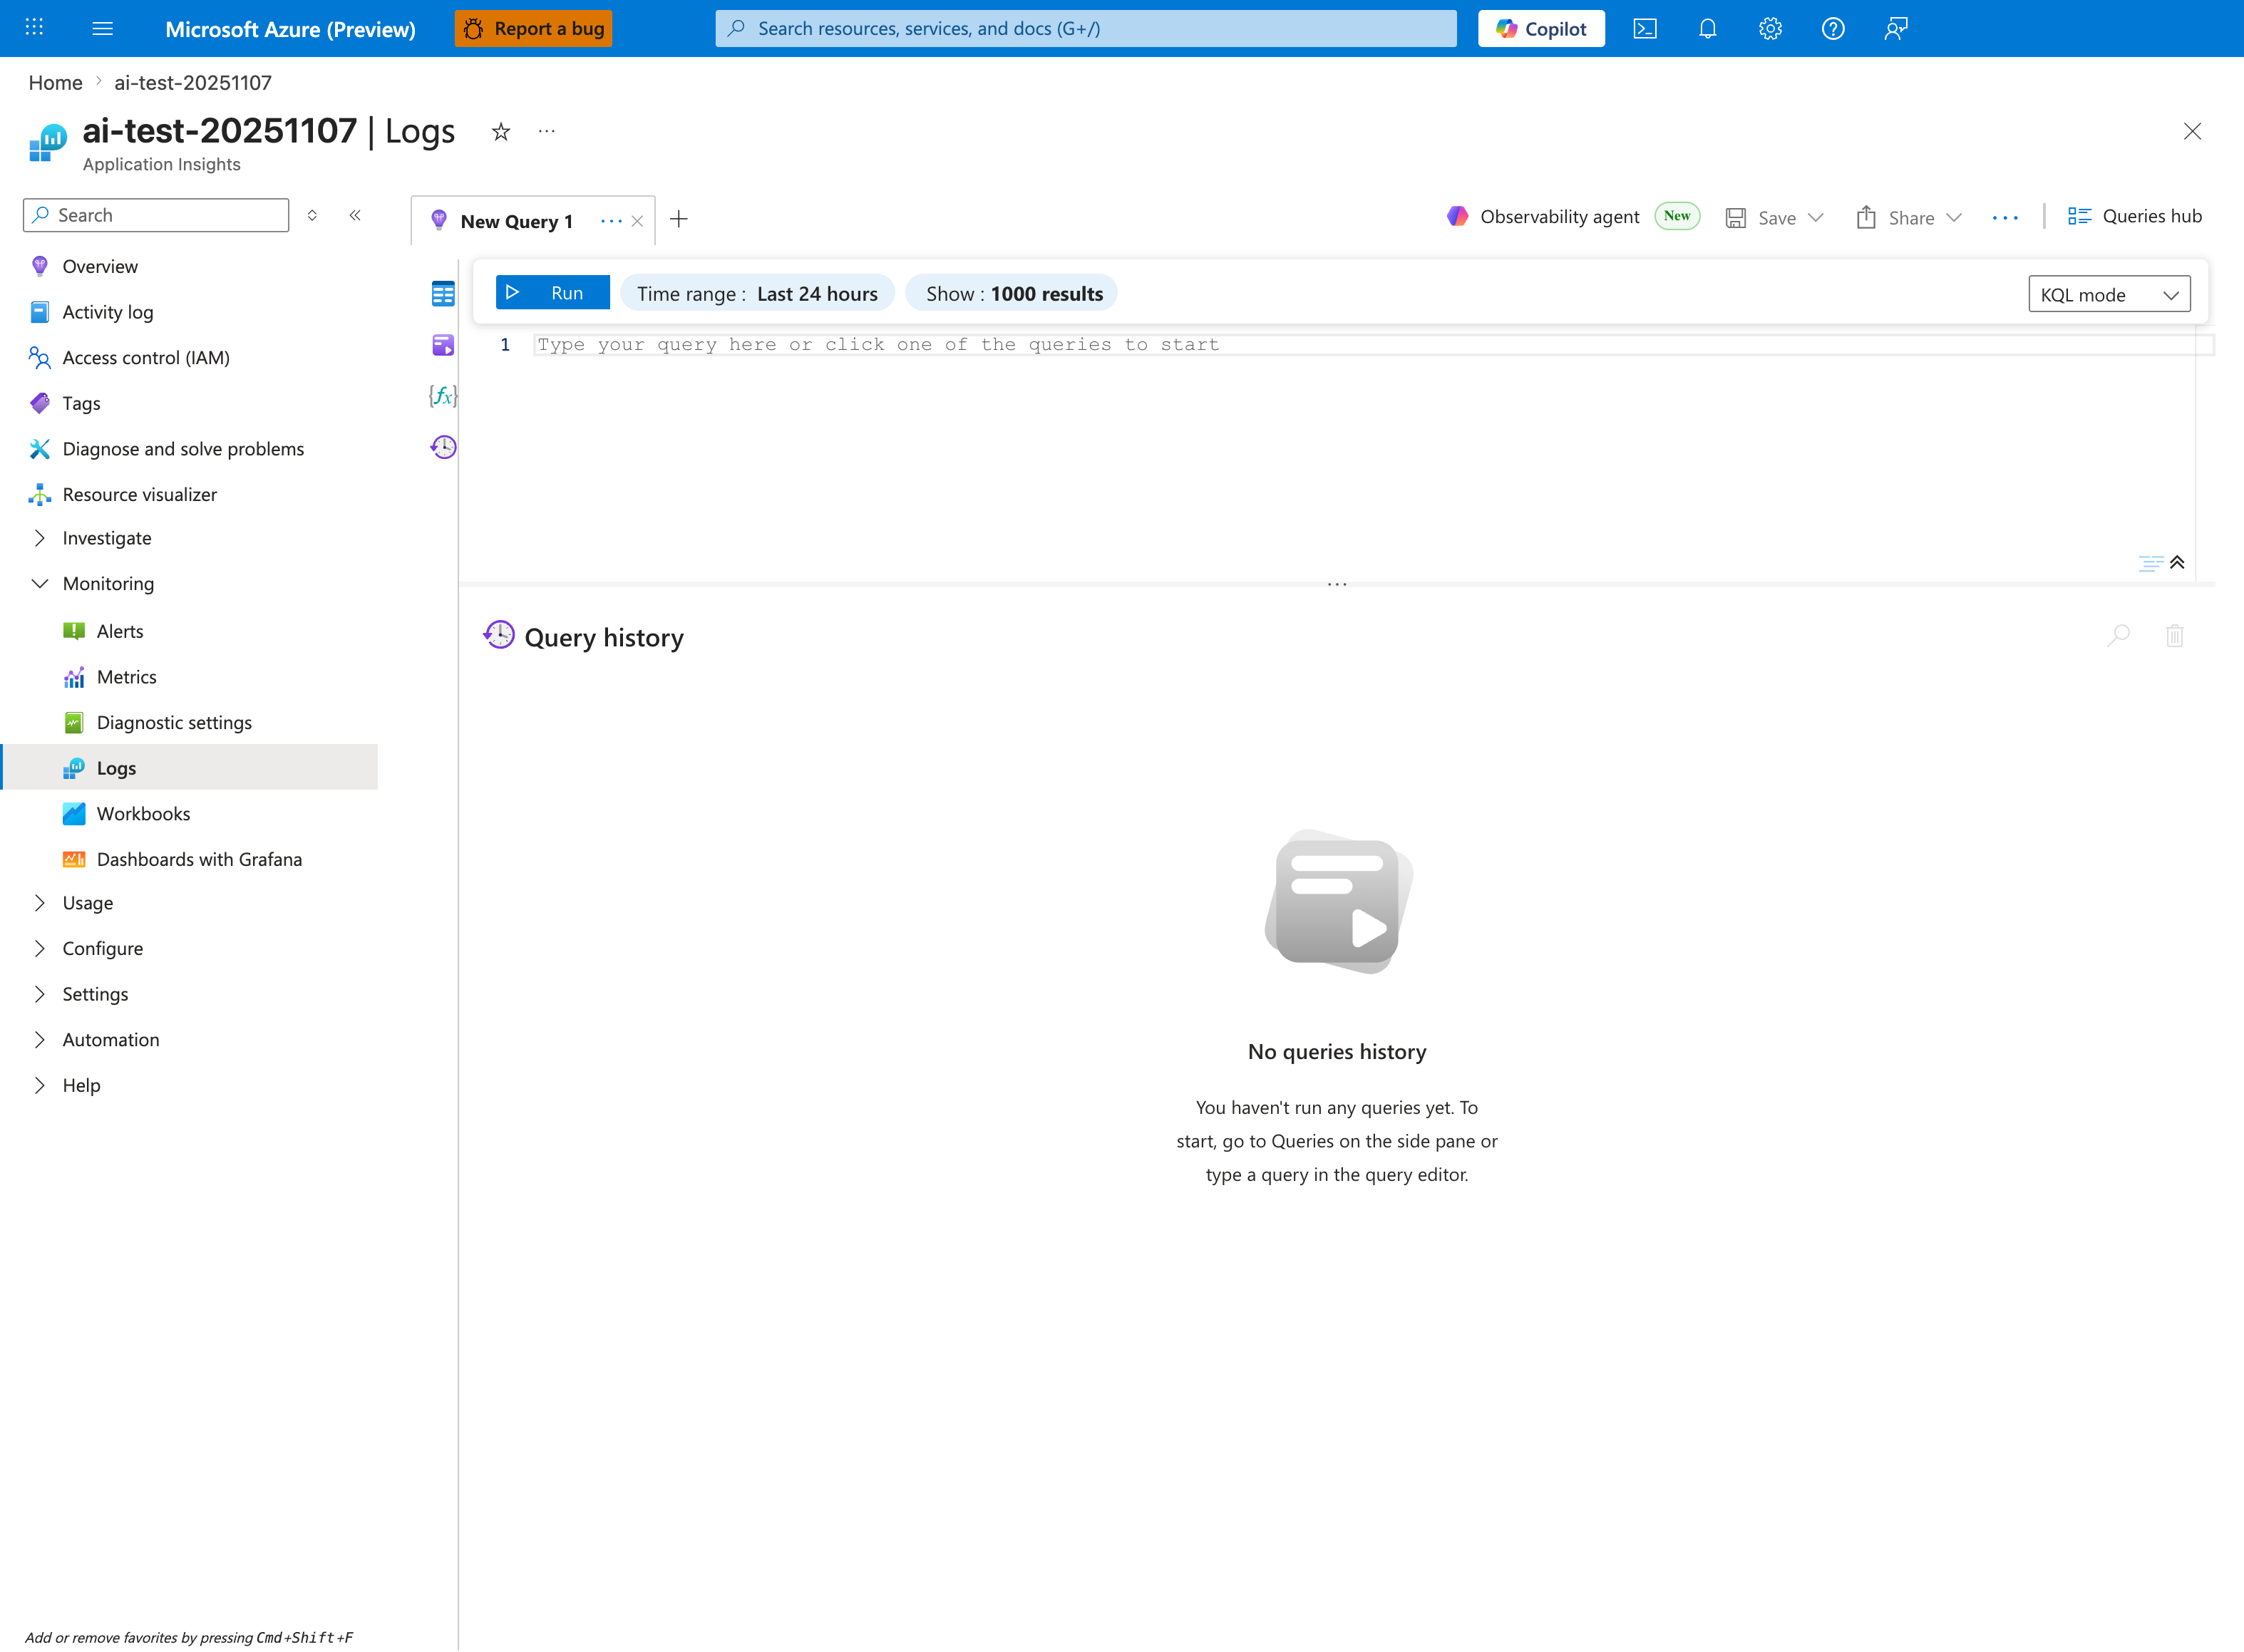
The Logs blade is where the correlation queries below are pasted - this capture shows the Application Insights Logs experience (ai-test-20251107), but the workspace-based Log Analytics blade has the same New Query 1 tab and Run toolbar. This pack includes one query that summarizes multiple HTTP-derived series from AppServiceHTTPLogs and one query that unions AppServiceHTTPLogs with AppServicePlatformLogs, so both docs below render timecharts in the lower pane after Run. Start from the visible Time range: Last 24 hours window, then tighten the inline Time range selector to match each query's own ago(...) filter when you narrow to a specific incident. The empty Query history pane and the placeholder Type your query here or click one of the queries to start confirm a fresh session.