Startup Errors
Scenario: Container startup fails or app never becomes healthy after deployment/restart. Data Source: AppServiceConsoleLogs Purpose: Surfaces recent startup/runtime error signatures from console output.
graph TD
    A[AppServiceConsoleLogs] -->|Keyword Filter| B[error / exception / traceback]
    B --> C[Timeline of Error Messages]
    C --> D[Identify Boot Failure Pattern]
Run It in the Portal
Portal view: Logs blade (Log Analytics query editor)
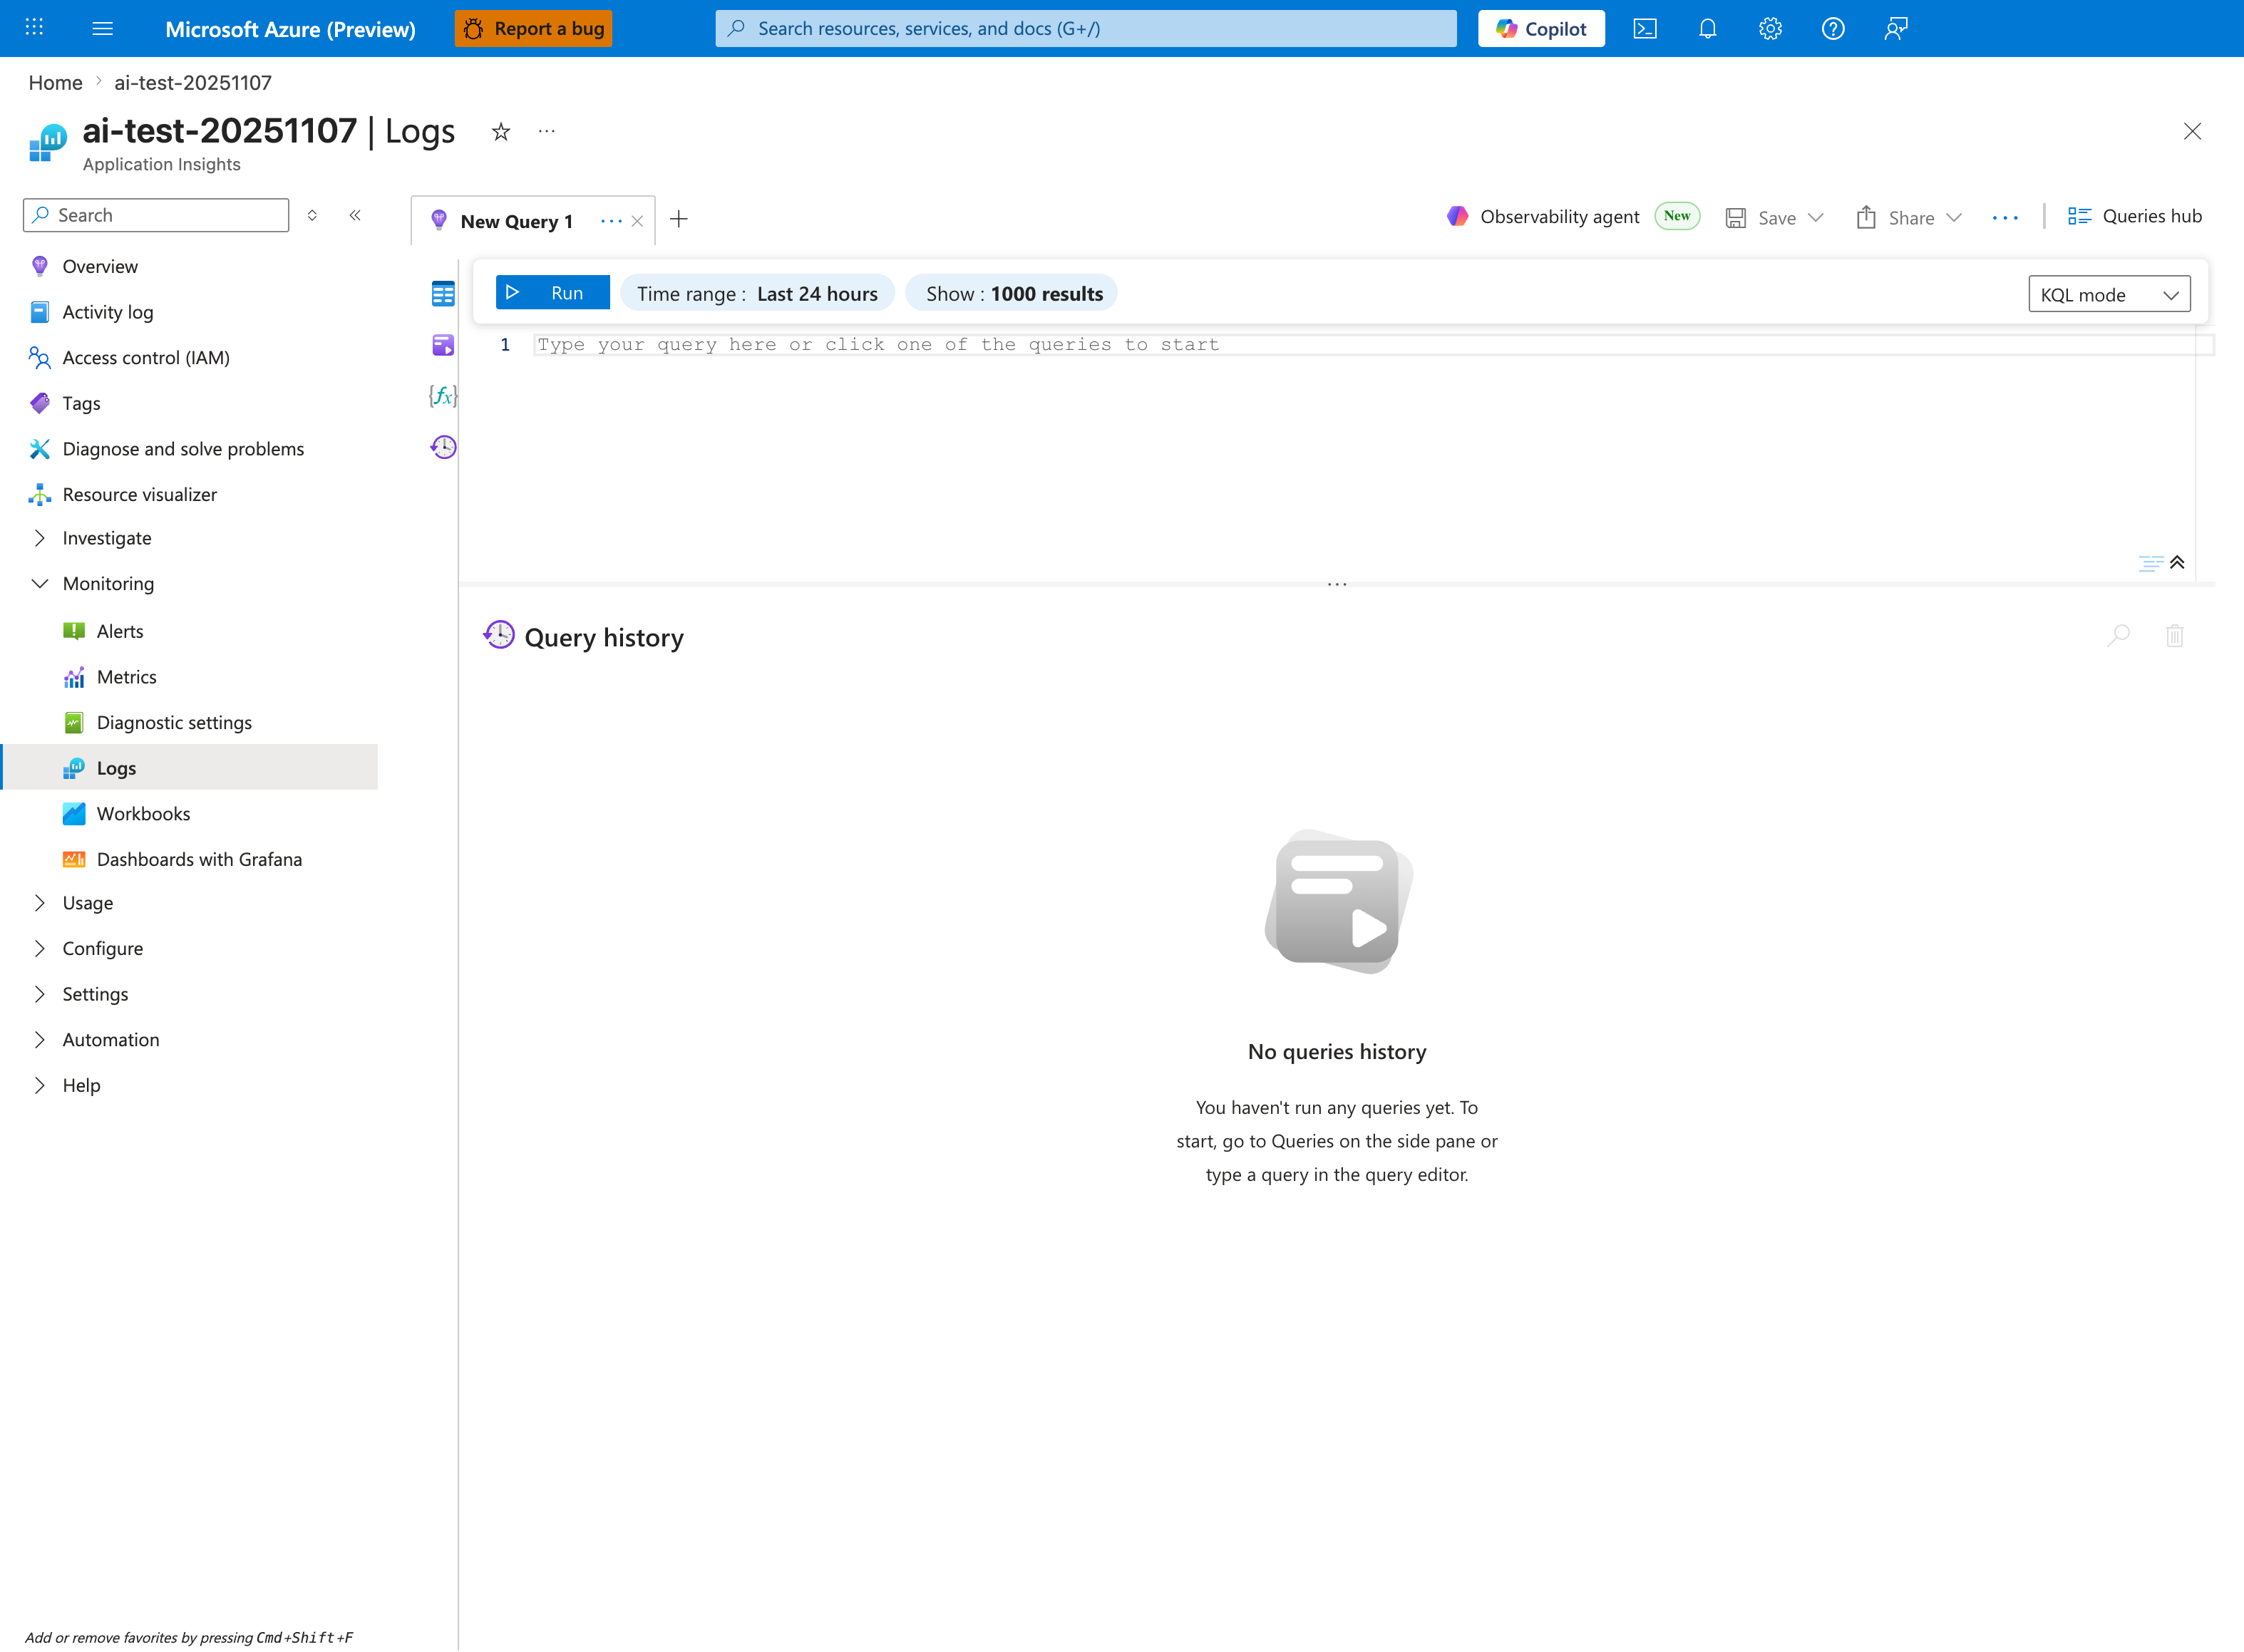
The Logs blade is where the startup-error query below is pasted - this capture shows the Application Insights Logs experience (ai-test-20251107), but the workspace-based Log Analytics blade renders the same New Query 1 tab and Run toolbar. Replace the placeholder Type your query here or click one of the queries to start with the AppServiceConsoleLogs | where ResultDescription has_any ... block; then tighten the inline Time range selector from the default Last 24 hours shown here to Last hour so it matches the ago(1h) filter inside the query. The query projects two columns (TimeGenerated, ResultDescription) and orders them descending, so results render as a tabular grid in the lower pane below the placeholder editor - no timechart is produced.
Query
AppServiceConsoleLogs
| where TimeGenerated > ago(1h)
| where ResultDescription has_any ("error", "Error", "ERROR", "exception", "Exception", "failed", "Failed", "traceback", "Traceback")
| project TimeGenerated, ResultDescription
| order by TimeGenerated desc
Interpretation Notes
- Normal: few/no fatal startup errors; expected informational logs dominate.
- Abnormal: repeated exceptions, traceback bursts, or fatal initialization messages.
- Reading tip: look for repeated identical stack traces to identify deterministic boot failures.
Limitations
- Console log availability depends on diagnostic configuration and app logging behavior.
- Keyword search may include non-fatal lines or miss framework-specific error formats.
- This query cannot prove whether App Service health probes succeeded.