Console Queries
Use these queries to identify startup/runtime failures from container console output in Azure App Service Linux.
graph TD
    A[AppServiceConsoleLogs] --> B[Startup Errors]
    A --> C[Binding Failures]
    B --> D[Identify Boot Issues]
    C --> D
Run It in the Portal
Portal view: Logs blade (Log Analytics query editor)
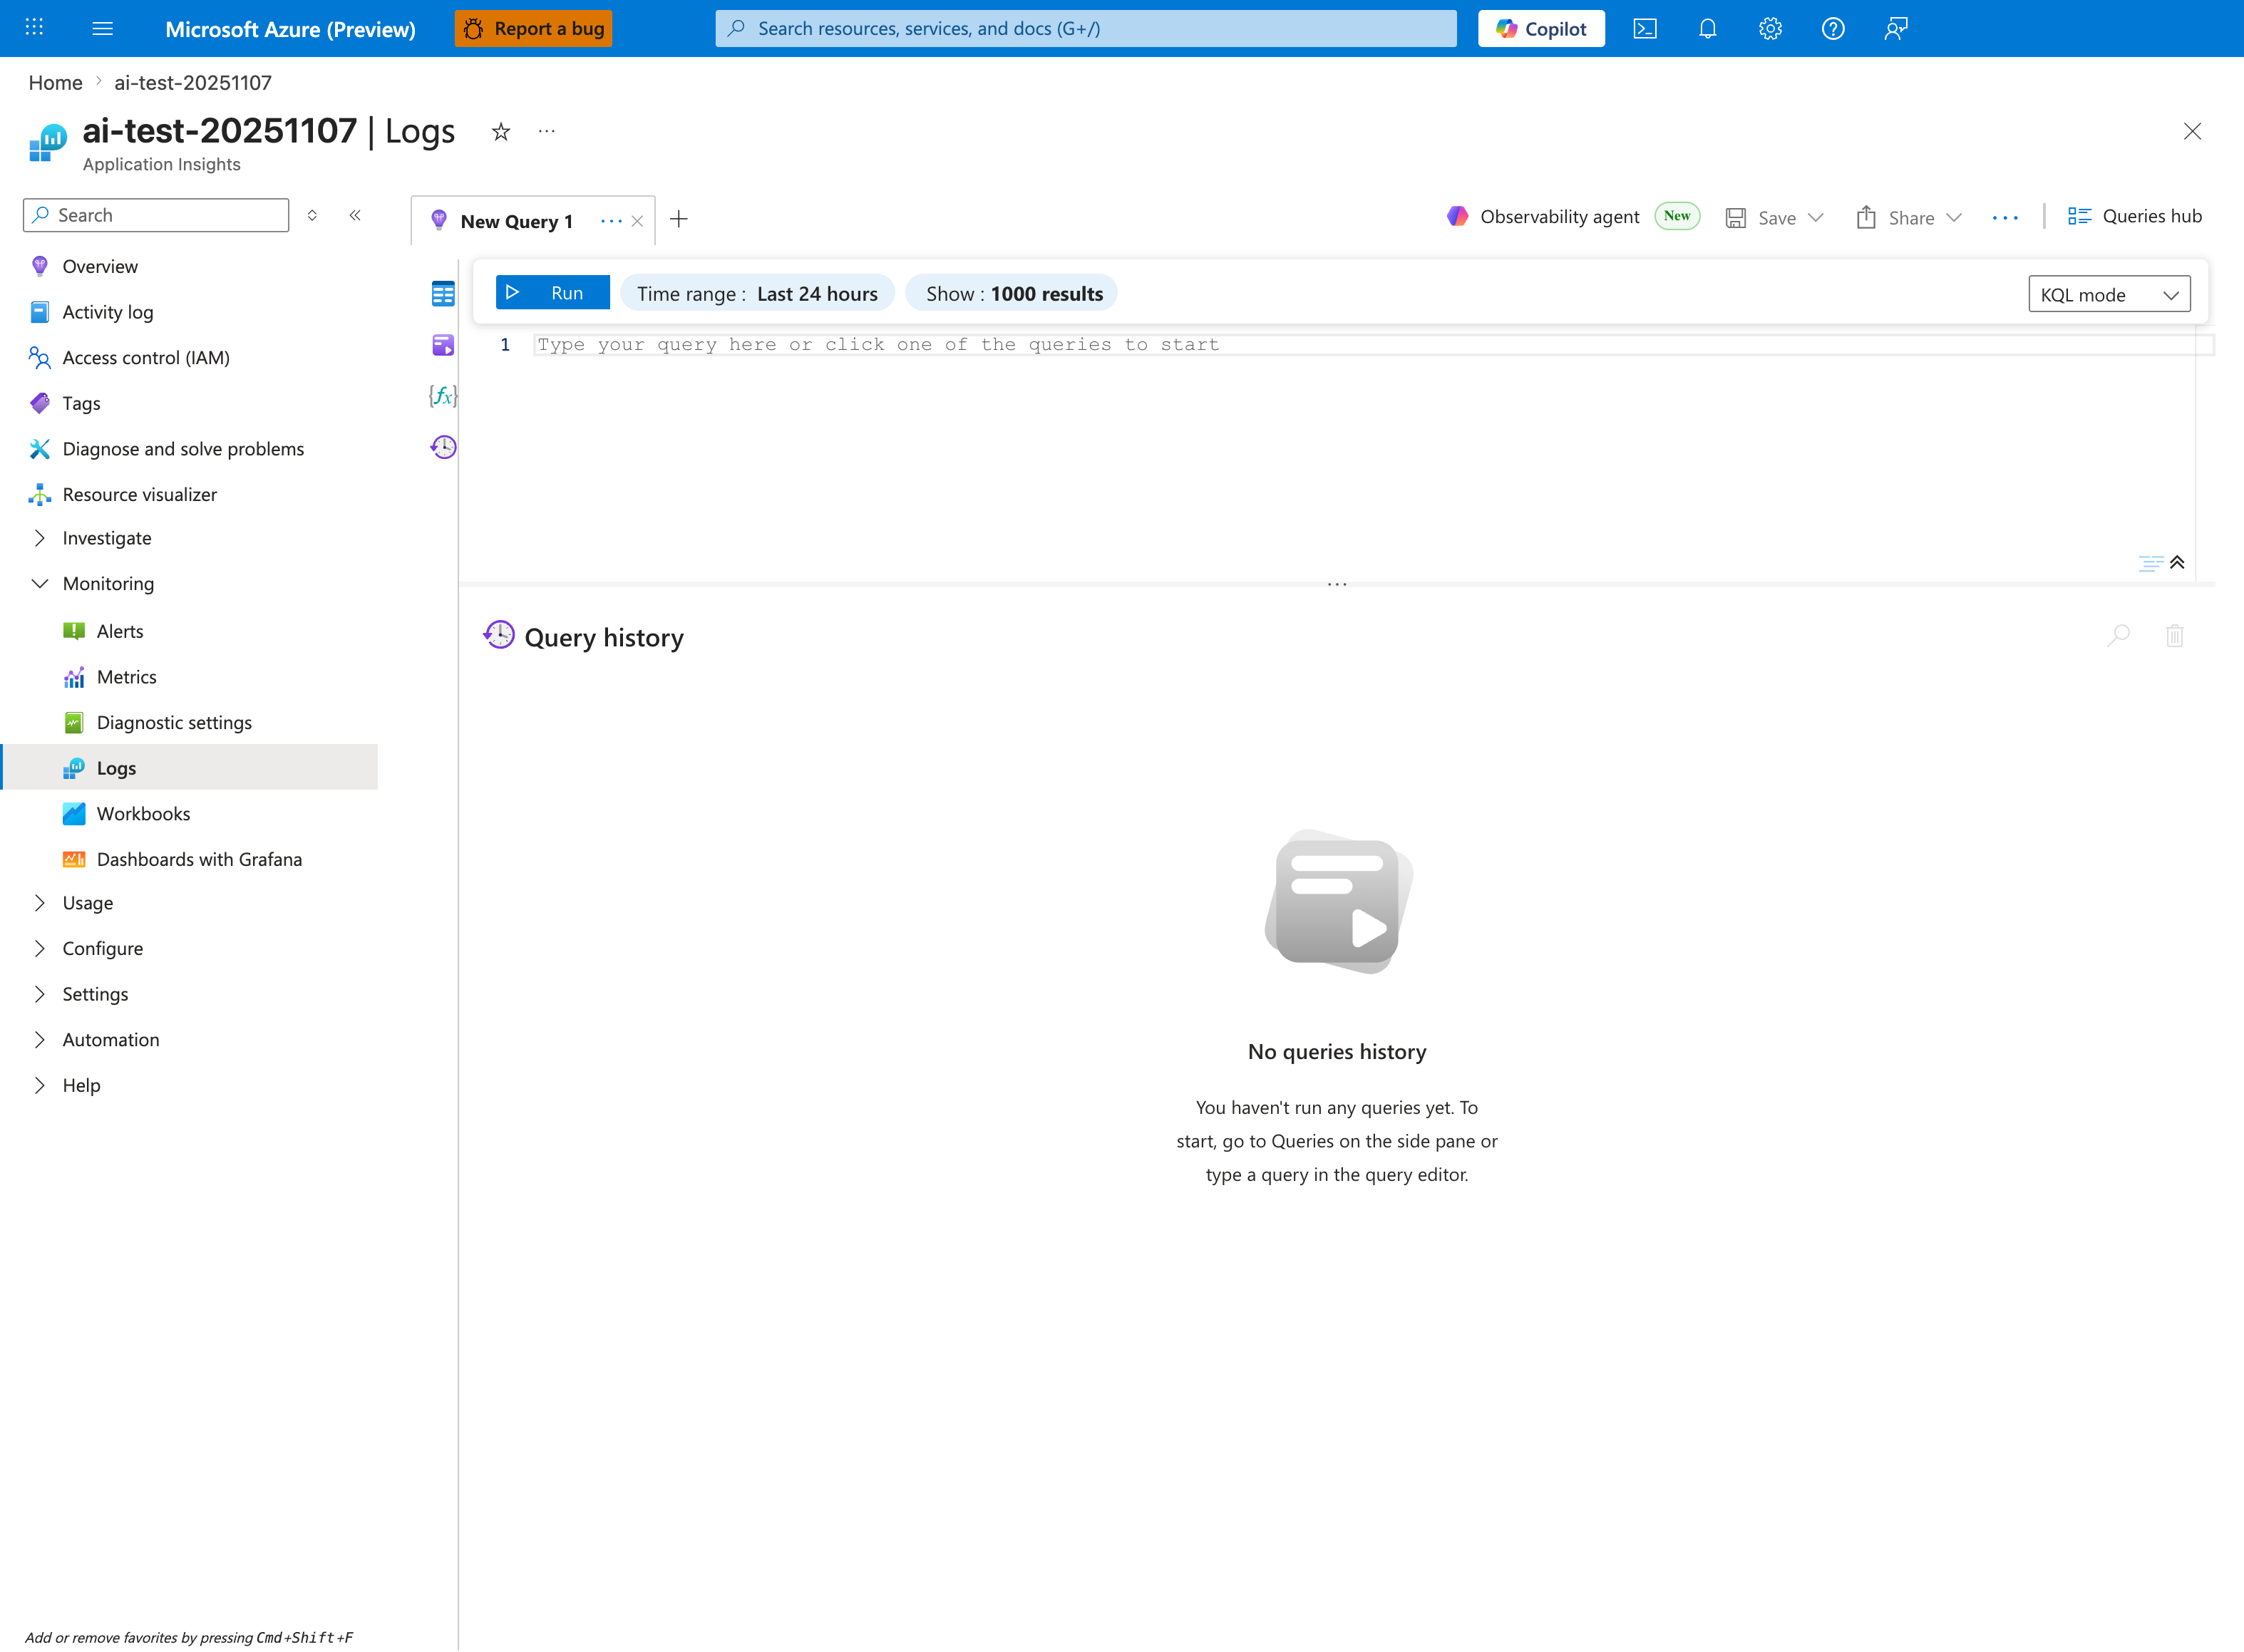
The Logs blade is where the console-log queries below are pasted - this capture shows the Application Insights Logs experience (ai-test-20251107), but the workspace-based Log Analytics blade has the same New Query 1 tab and Run toolbar. Both queries in this pack target AppServiceConsoleLogs, which becomes the first table identifier once you replace the placeholder Type your query here or click one of the queries to start in the editor. The default Time range: Last 24 hours is usually too wide for startup-error triage; tighten it via the inline Time range selector to align with the most recent restart-event window before running. The No queries history message confirms a fresh session - after the first Run, executed queries and their time-ordered rows appear in the lower pane.