Query Library
Reusable KQL queries for Azure App Service Linux investigations.
Use these queries to accelerate evidence collection before entering deep playbook analysis.
graph TD
    A[Query Library] --> B[HTTP queries]
    A --> C[Console queries]
    A --> D[Restart queries]
    A --> E[Correlation queries]
    B --> F[Latency and status trends]
    C --> G[Startup and runtime errors]
    D --> H[Restart loop timing]
    E --> I[Cross-signal validation]
Run It in the Portal
Portal view: Logs blade (Log Analytics query editor)
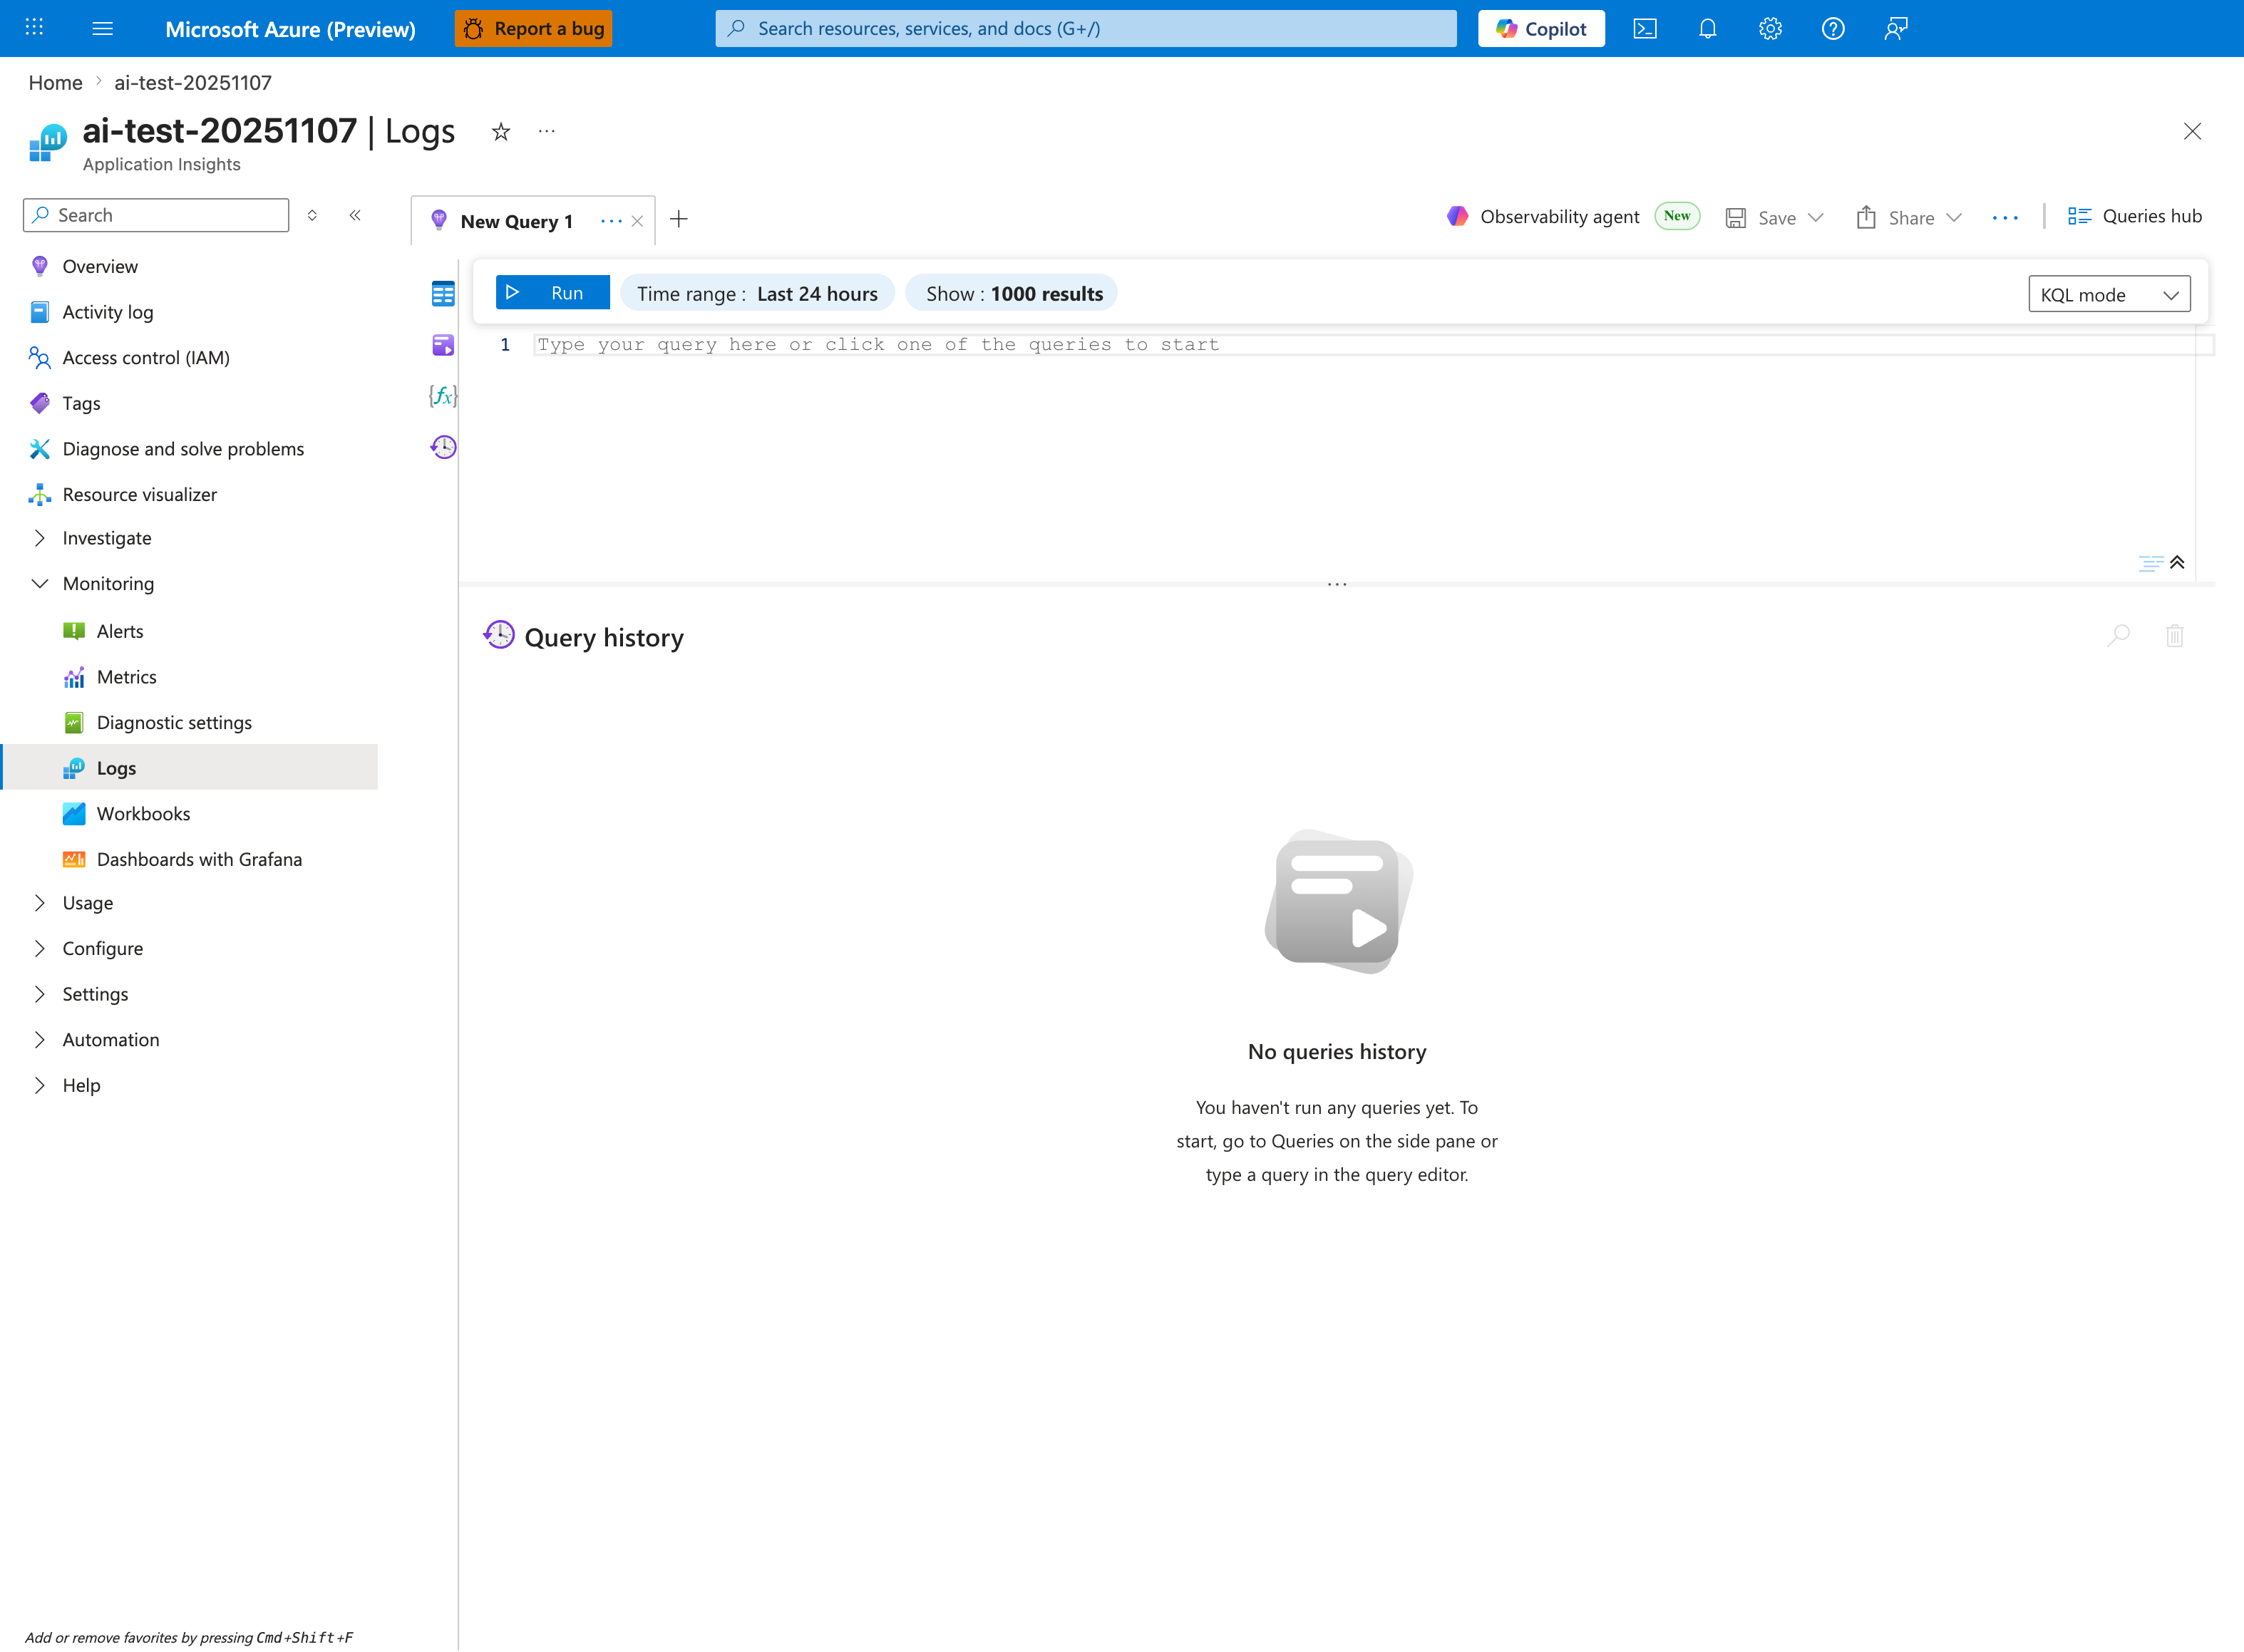
The Logs blade is the single entry point for every query in this library - this capture shows the Application Insights Logs experience (ai-test-20251107), but the workspace-based Log Analytics blade renders the same New Query 1 tab, Run toolbar, and KQL mode dropdown. The placeholder Type your query here or click one of the queries to start and the empty Query history pane confirm a fresh session: paste any of the snippets from the HTTP, Console, Restart, or Correlation packs below into the editor to populate it. The default Time range: Last 24 hours matches the wider triage windows in this library; tighten it via the inline Time range selector when running short-burn queries with ago(1h) filters. The Queries hub button in the top-right is the visible entry point for saving or reopening investigation snippets once you start running the library queries.
Categories
| Category | Focus | Index |
|---|---|---|
| HTTP | Latency, status-code trends, slow endpoints | HTTP Queries |
| Console | Startup/runtime error signatures from container output | Console Queries |
| Restarts | Container restart timing and startup loop detection | Restart Queries |
| Correlation | Cross-signal views (latency, errors, restart events) | Correlation Queries |
Usage Notes
- Default time windows are intentionally short (1h to 24h) for first-response triage.
- Adjust
ago(...)windows and bin size for low-traffic or long-burn incidents. - Validate table availability in your Log Analytics workspace before use.