First 10 Minutes: Startup / Availability
Quick Context
Use this checklist when an Azure App Service Linux app does not come up cleanly after deployment/restart, returns startup-related 5xx, or fails health pings. In the first 10 minutes, establish whether this is a startup crash, wrong port/binding, startup timeout, or recent image/config regression.
graph TD
    A[Symptom: Startup failures or health ping errors] --> B{Startup logs present?}
    B -- No --> C[Suspect crash or launch failure]
    B -- Yes --> D{Start-fail-restart loop?}
    D -- Yes --> E[Platform restart-loop hypothesis]
    D -- No --> F{Linux port config consistent with listener?}
    F -- No --> G[Port mismatch hypothesis]
    F -- Yes --> H{Binding is 0.0.0.0?}
    H -- No --> I[Binding mismatch hypothesis]
    H -- Yes --> J{Startup exceeds time limit?}
    J -- Yes --> K[Startup timeout hypothesis]
    J -- No --> L[Check recent image/config regression]
Step 1: Check AppServiceConsoleLogs for startup output
First question: is the containerized app producing any startup logs at all?
Portal view: Web App Down detector confirms the availability symptom
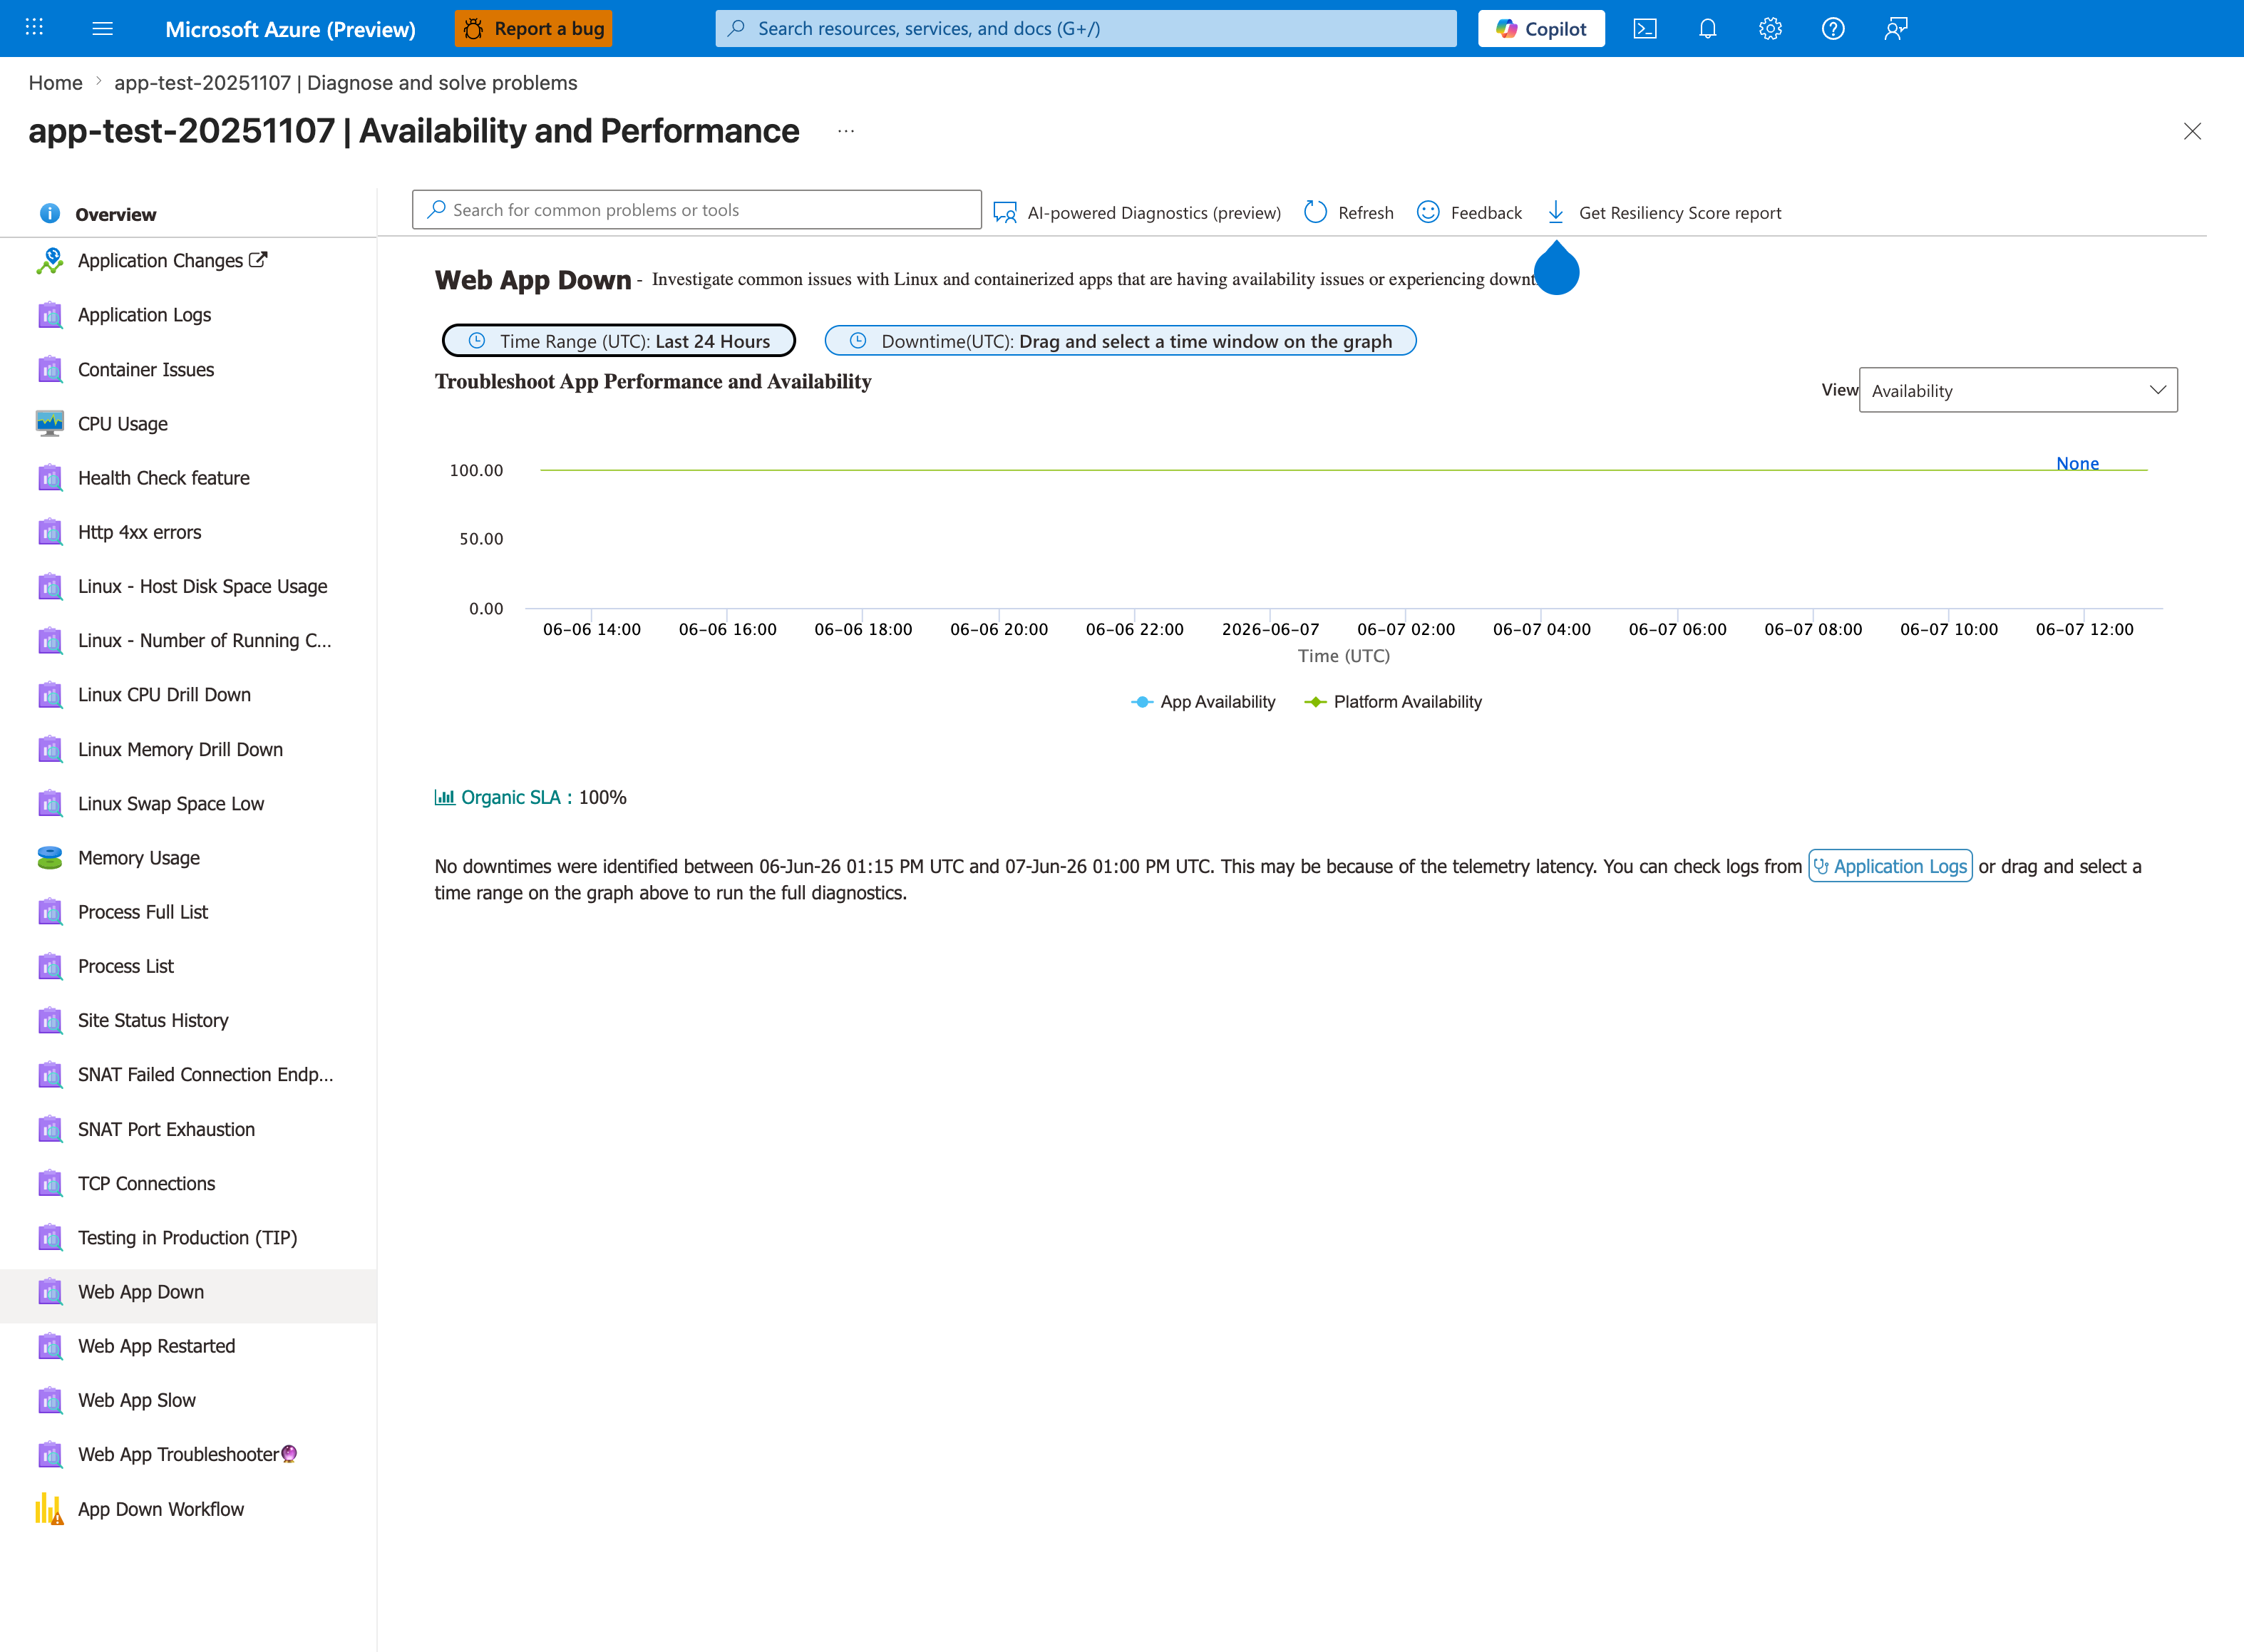
Before running the KQL query below, confirm the symptom is observable from the platform's perspective using the Web App Down detector. The App Availability and Platform Availability lines distinguish your app's HTTP availability from the platform infrastructure — when App Availability drops but Platform Availability stays at 100%, the failure is in your container or code, not the App Service platform. The Drag and select a time window on the graph action runs the full availability diagnostic against the selected window and surfaces correlated detector results. When Organic SLA: 100% and the chart is flat, the symptom has not been observed by the platform yet — proceed to the console logs below to look for in-progress startup failures.
- KQL:
AppServiceConsoleLogs
| where TimeGenerated > ago(1h)
| project TimeGenerated, ResultDescription
| order by TimeGenerated desc
Portal view: Log stream for real-time startup output
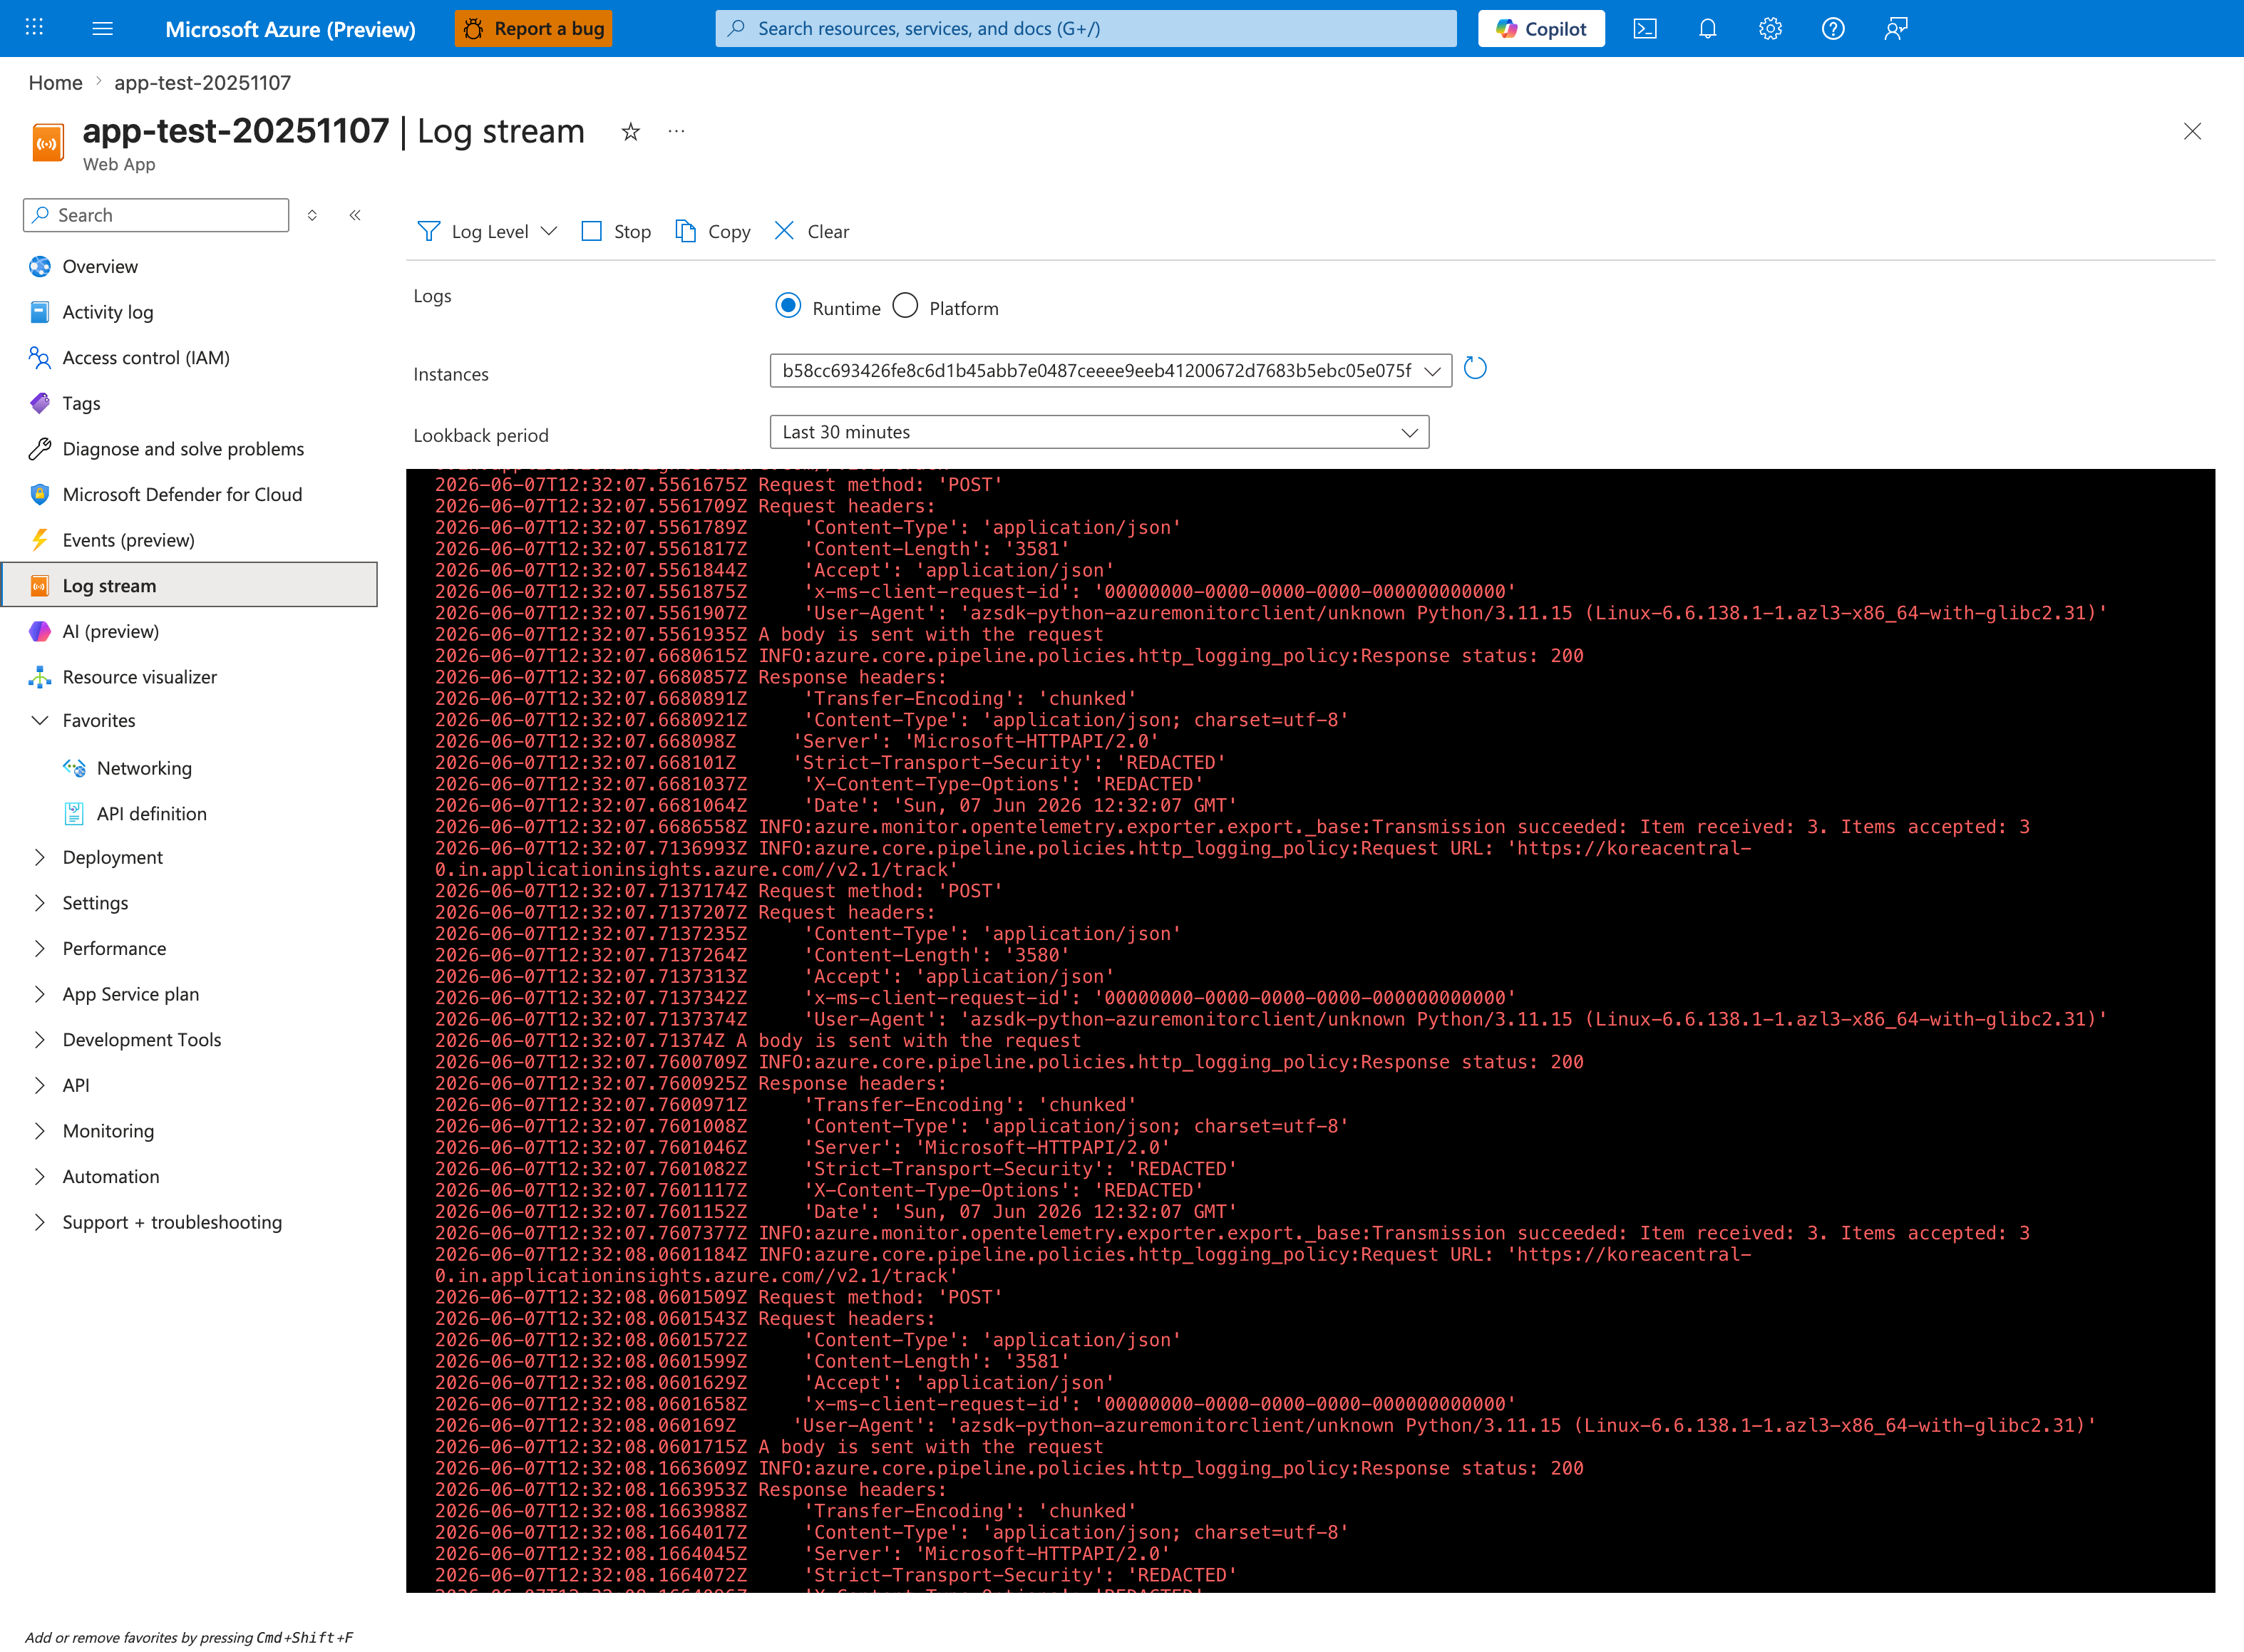
The Log stream blade is the real-time complement to the historical KQL query above and the fastest way to confirm whether the container is producing any startup output at all. The Runtime radio captures stdout/stderr from your application — this is where Python tracebacks, Node.js Error: listen EADDRINUSE, and Java BindException appear within seconds of restart. The Platform radio shows App Service platform messages (container lifecycle, health probe results). If Log stream is silent during a restart cycle, the container is failing before any logging framework initializes — proceed to Step 2 to check platform events. The az webapp log tail CLI below produces the same stream without browser-side UI lag.
- Good signal: clear startup sequence logs (framework boot, server start, listening message).
- Bad signal: no output, repeated fatal exceptions, or immediate process exits.
Step 2: Check platform events for container start/fail loop
Platform logs confirm if App Service can start and keep the container alive. - KQL:
AppServicePlatformLogs
| where TimeGenerated > ago(6h)
| where OperationName has_any ("Container", "start", "Start", "fail", "Fail", "restart", "Restart")
| project TimeGenerated, OperationName, ContainerId
| order by TimeGenerated desc
- Good signal: normal start with no immediate fail/restart cycle.
- Bad signal: rapid start-fail-restart patterns.
Step 3: Verify Linux port configuration against the actual listener
For Linux custom containers, startup reachability is more nuanced than a simple WEBSITES_PORT mismatch model. Check the actual listener together with both WEBSITES_PORT and the runtime-injected PORT value. See Container HTTP Pings Lab for experimental evidence on Linux port behavior. - Portal path: App Service -> Configuration -> Application settings -> WEBSITES_PORT - CLI:
- Good signal: the app binds to
0.0.0.0on the port App Service exposes throughPORT, and any configuredWEBSITES_PORTdoes not contradict that listener. - Bad signal: logs show a different port or localhost-only binding than the effective Linux startup path can reach.
Step 4: Verify binding address is 0.0.0.0 (not 127.0.0.1)
Binding to loopback prevents App Service front-end probe from reaching the process. - Check startup logs for bind/listen line. - Common bad pattern: Listening on 127.0.0.1:<port>. - Good signal: 0.0.0.0:<port> listener. - Bad signal: loopback-only bind.
Step 5: Check WEBSITES_CONTAINER_START_TIME_LIMIT
Large images, migrations, or cold startup overhead can exceed default timeout. - Portal path: App Service -> Configuration -> Application settings -> WEBSITES_CONTAINER_START_TIME_LIMIT - CLI:
az webapp config appsettings list --resource-group "$RG" --name "$APP_NAME" --query "[?name=='WEBSITES_CONTAINER_START_TIME_LIMIT']"
- Good signal: timeout value fits startup profile.
- Bad signal: container initialization consistently exceeds limit.
Step 6: Check recent image/config changes
Confirm if failure started after deployment, base image update, or setting change. - Portal path: Deployment Center -> Logs and Configuration -> Last modified - CLI examples:
az webapp config container show --resource-group "$RG" --name "$APP_NAME"
az webapp deployment source show --resource-group "$RG" --name "$APP_NAME"
- Good signal: no risky change near first failure timestamp.
- Bad signal: issue starts immediately after image tag/config update.
Step 7: SSH into container and verify process state
Direct process check quickly distinguishes crash-loop from healthy process with routing issue. - Portal path: App Service -> Development Tools -> SSH - Commands inside container:
- Good signal: expected app process running and listening on configured port/address.
- Bad signal: no app process, repeated exits, or wrong listen socket.
Step 8: Pull startup error signatures from console logs
Extract concrete crash reasons to choose the next deep-dive playbook. - KQL:
AppServiceConsoleLogs
| where TimeGenerated > ago(1h)
| where ResultDescription has_any ("error", "exception", "failed", "traceback", "EADDRINUSE", "address already in use")
| project TimeGenerated, ResultDescription
| order by TimeGenerated desc
- Good signal: no repeated fatal startup signatures.
- Bad signal: repeatable stack traces or bind errors explaining startup failure.
Decision Points
After these checks, you should be able to: - Narrow to 1-2 hypotheses: - Port/listener contract issue -> verify PORT, WEBSITES_PORT, and actual bind behavior together - Binding mismatch -> bind to 0.0.0.0 - Startup timeout -> increase time limit and reduce startup work - Crash on boot -> investigate stack trace/runtime dependency error - Select immediate corrective path before full deep dive.