First 10 Minutes: Outbound / Network
Quick Context
Use this checklist when Azure App Service Linux can serve some traffic but fails calling dependencies (timeouts, connection failures, DNS errors). In the first 10 minutes, determine whether the issue is SNAT pressure, DNS resolution, routing/Private Endpoint configuration, or upstream dependency instability.
graph TD
    A[Symptom: Dependency calls fail] --> B{Inbound reachable?}
    B -- No --> C[Also investigate ingress path]
    B -- Yes --> D{SNAT detector near exhaustion?}
    D -- Yes --> E[SNAT pressure hypothesis]
    D -- No --> F{DNS resolution healthy?}
    F -- No --> G[DNS issue hypothesis]
    F -- Yes --> H{VNet or PE routing aligned?}
    H -- No --> I[Route or Private Endpoint issue]
    H -- Yes --> J[Check upstream dependency stability]
    E --> K[SNAT playbook]
    G --> L[DNS playbook]
    I --> M[PE/custom DNS playbook]
Step 1: Classify inbound vs outbound symptom first
Avoid losing time on ingress when the failure is dependency egress. - Quick check: - Inbound issue: clients cannot reach your app endpoint. - Outbound issue: app endpoint is reachable, but dependency calls fail.- Validate with app logs or synthetic call path. - Good signal: clear isolation to outbound-only failure. - Bad signal: mixed signals (both inbound and outbound), requiring parallel checks.
Step 2: Check SNAT Port Exhaustion detector
SNAT exhaustion is one of the most common App Service Linux outbound failure causes under load. - Portal path: App Service -> Diagnose and solve problems -> Availability and Performance -> SNAT Port Exhaustion - Good signal: utilization is comfortably below limits during incident. - Bad signal: near/at exhaustion when failures occur.
Step 3: Check TCP Connections metric trend
High connection churn with poor reuse often precedes SNAT incidents. - Portal path: App Service -> Metrics -> TCP Connections - Azure CLI:
az monitor metrics list --resource "$APP_ID" --metric "TcpConnections" --interval PT1M --aggregation Average Maximum
Portal view: Metrics blade (TCP Connections starting point)
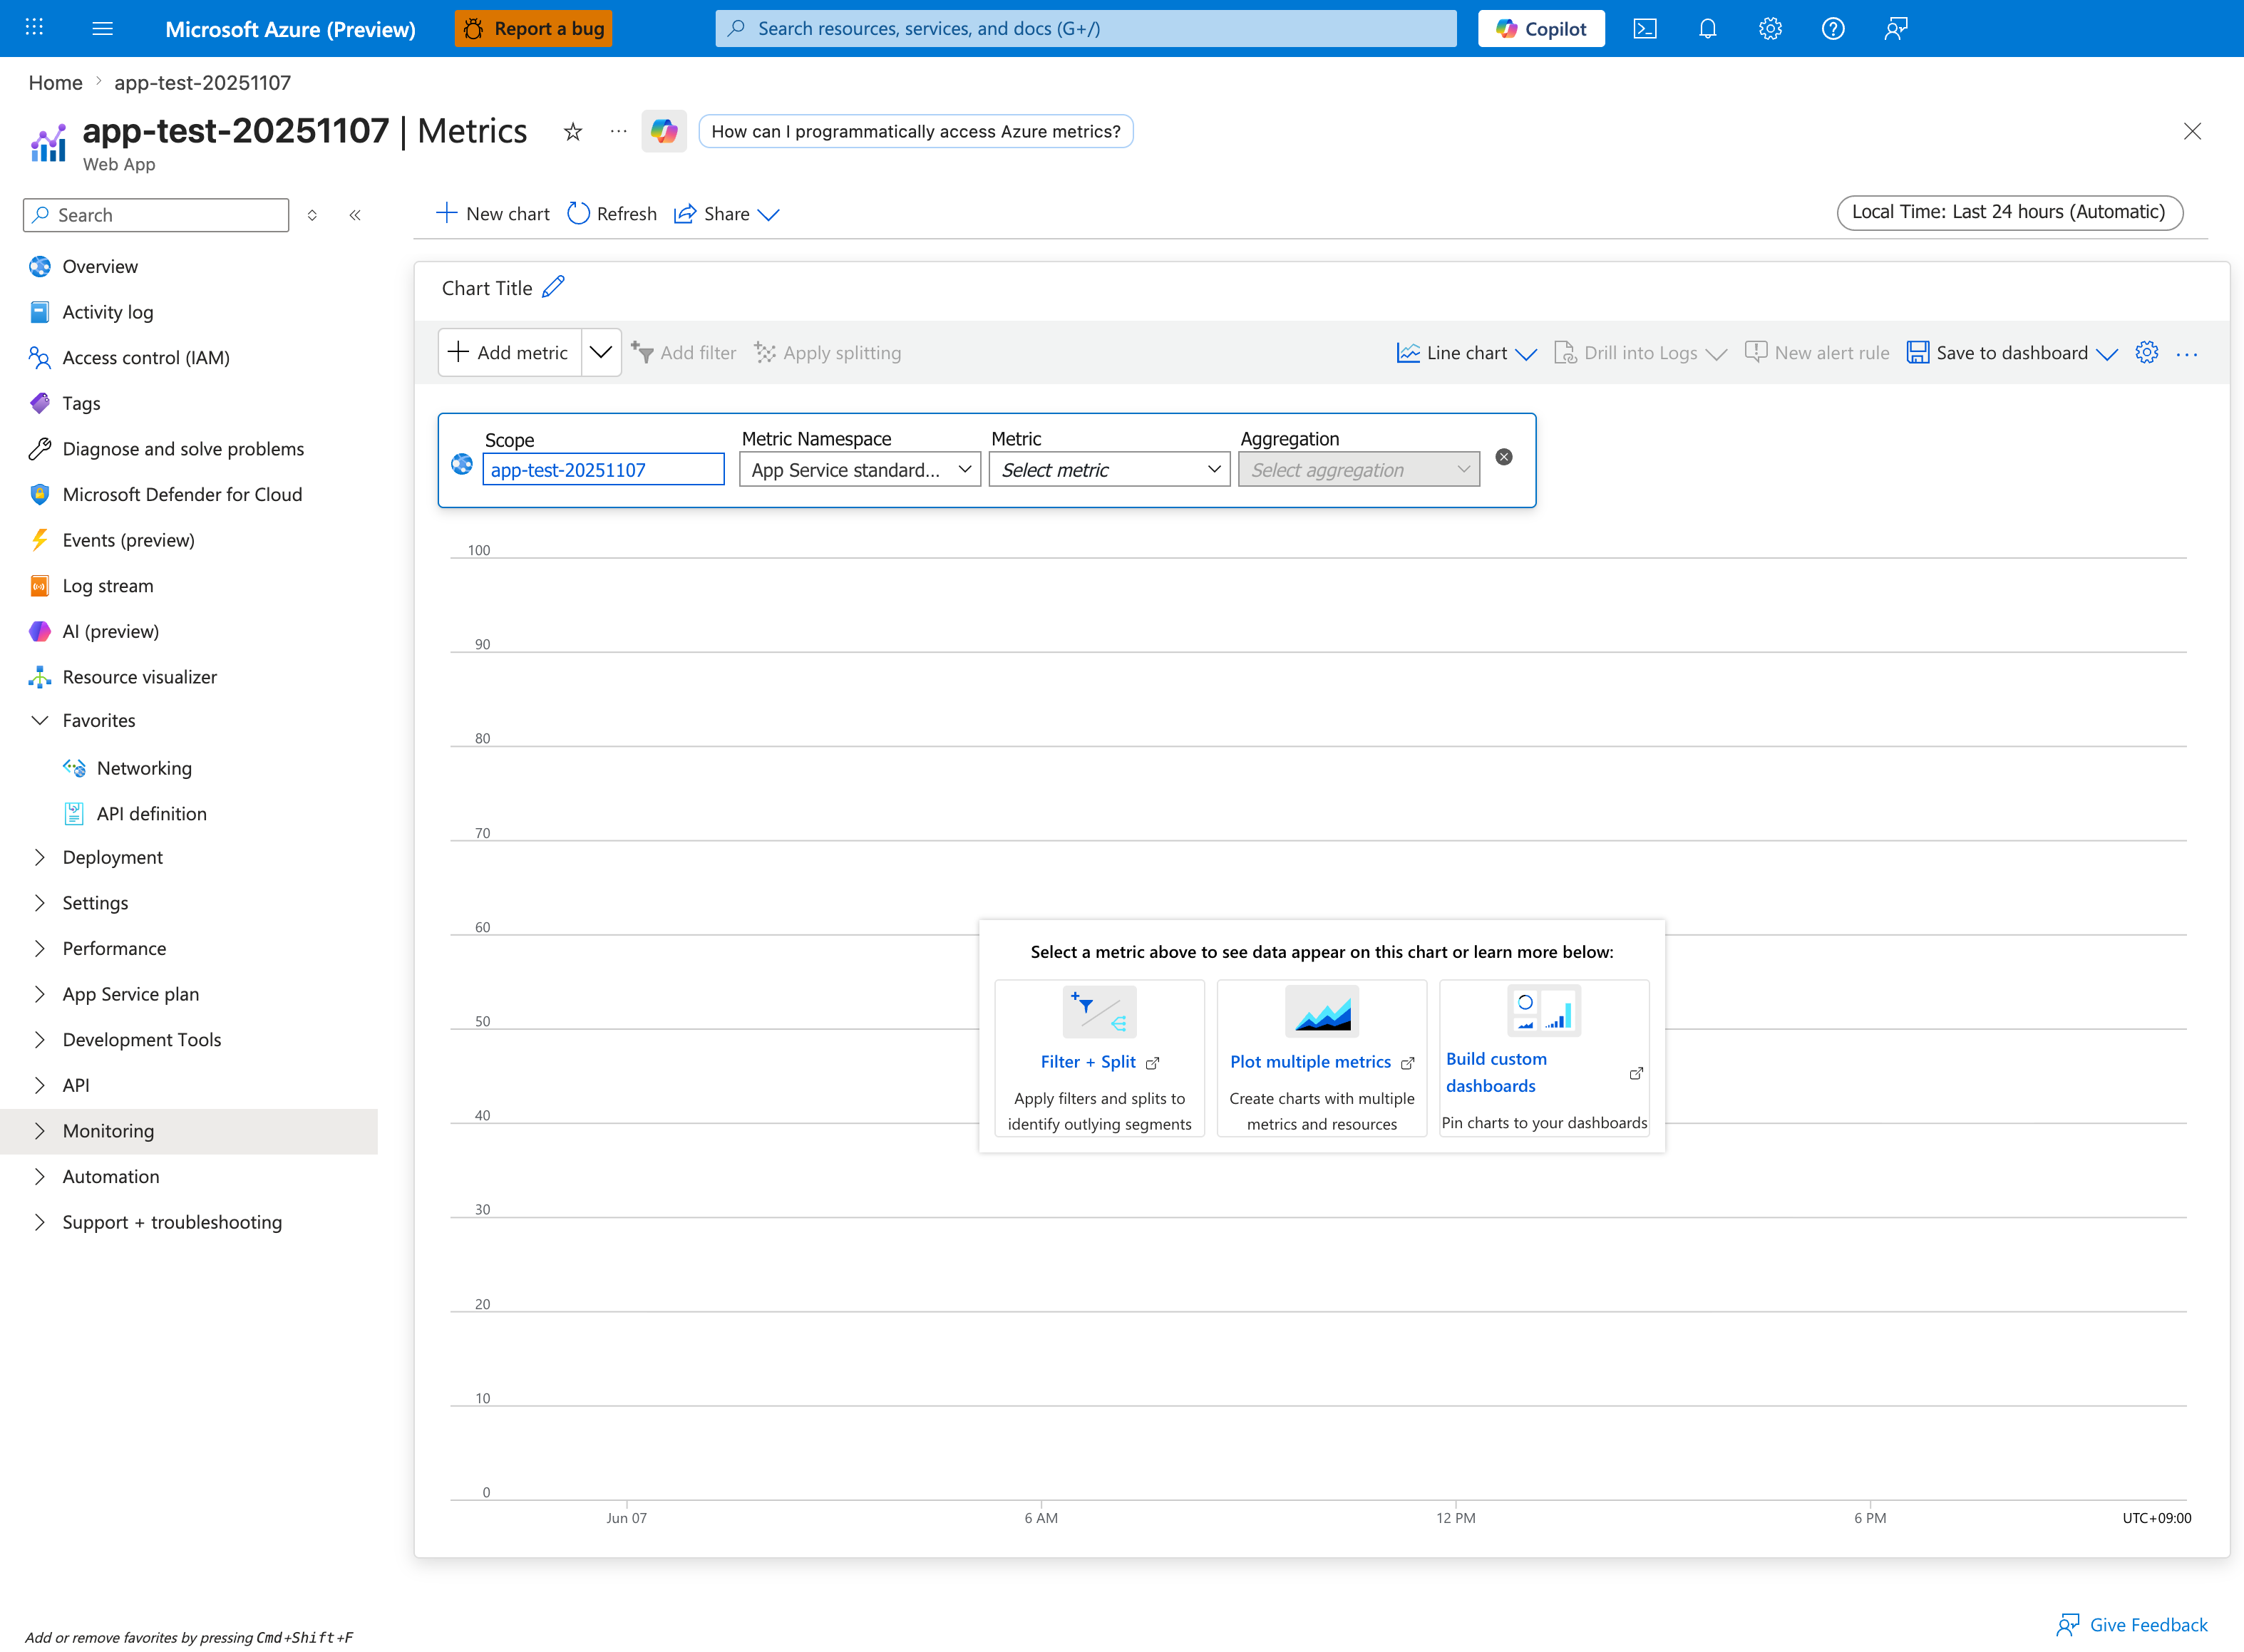
From this blade, select TCP Connections from the metric dropdown and add both Avg and Max aggregations. The default Last 24 hours window is usually too wide for SNAT triage - narrow to the incident window. Apply splitting by Instance so a single noisy worker doesn't get averaged away; SNAT exhaustion is per-instance, not per-plan. Pair this with the SNAT Port Exhaustion detector from Step 2 - both signals must align for the SNAT pressure hypothesis to hold.
- Good signal: stable connection profile.
- Bad signal: sharp step-ups aligned to timeouts/failures.
Step 4: Check VNet integration status (if used)
Misconfigured or unhealthy integration causes asymmetric dependency failures. - Portal path: App Service -> Networking -> VNet integration - Azure CLI:
Portal view: Networking hub (inbound + outbound at a glance)
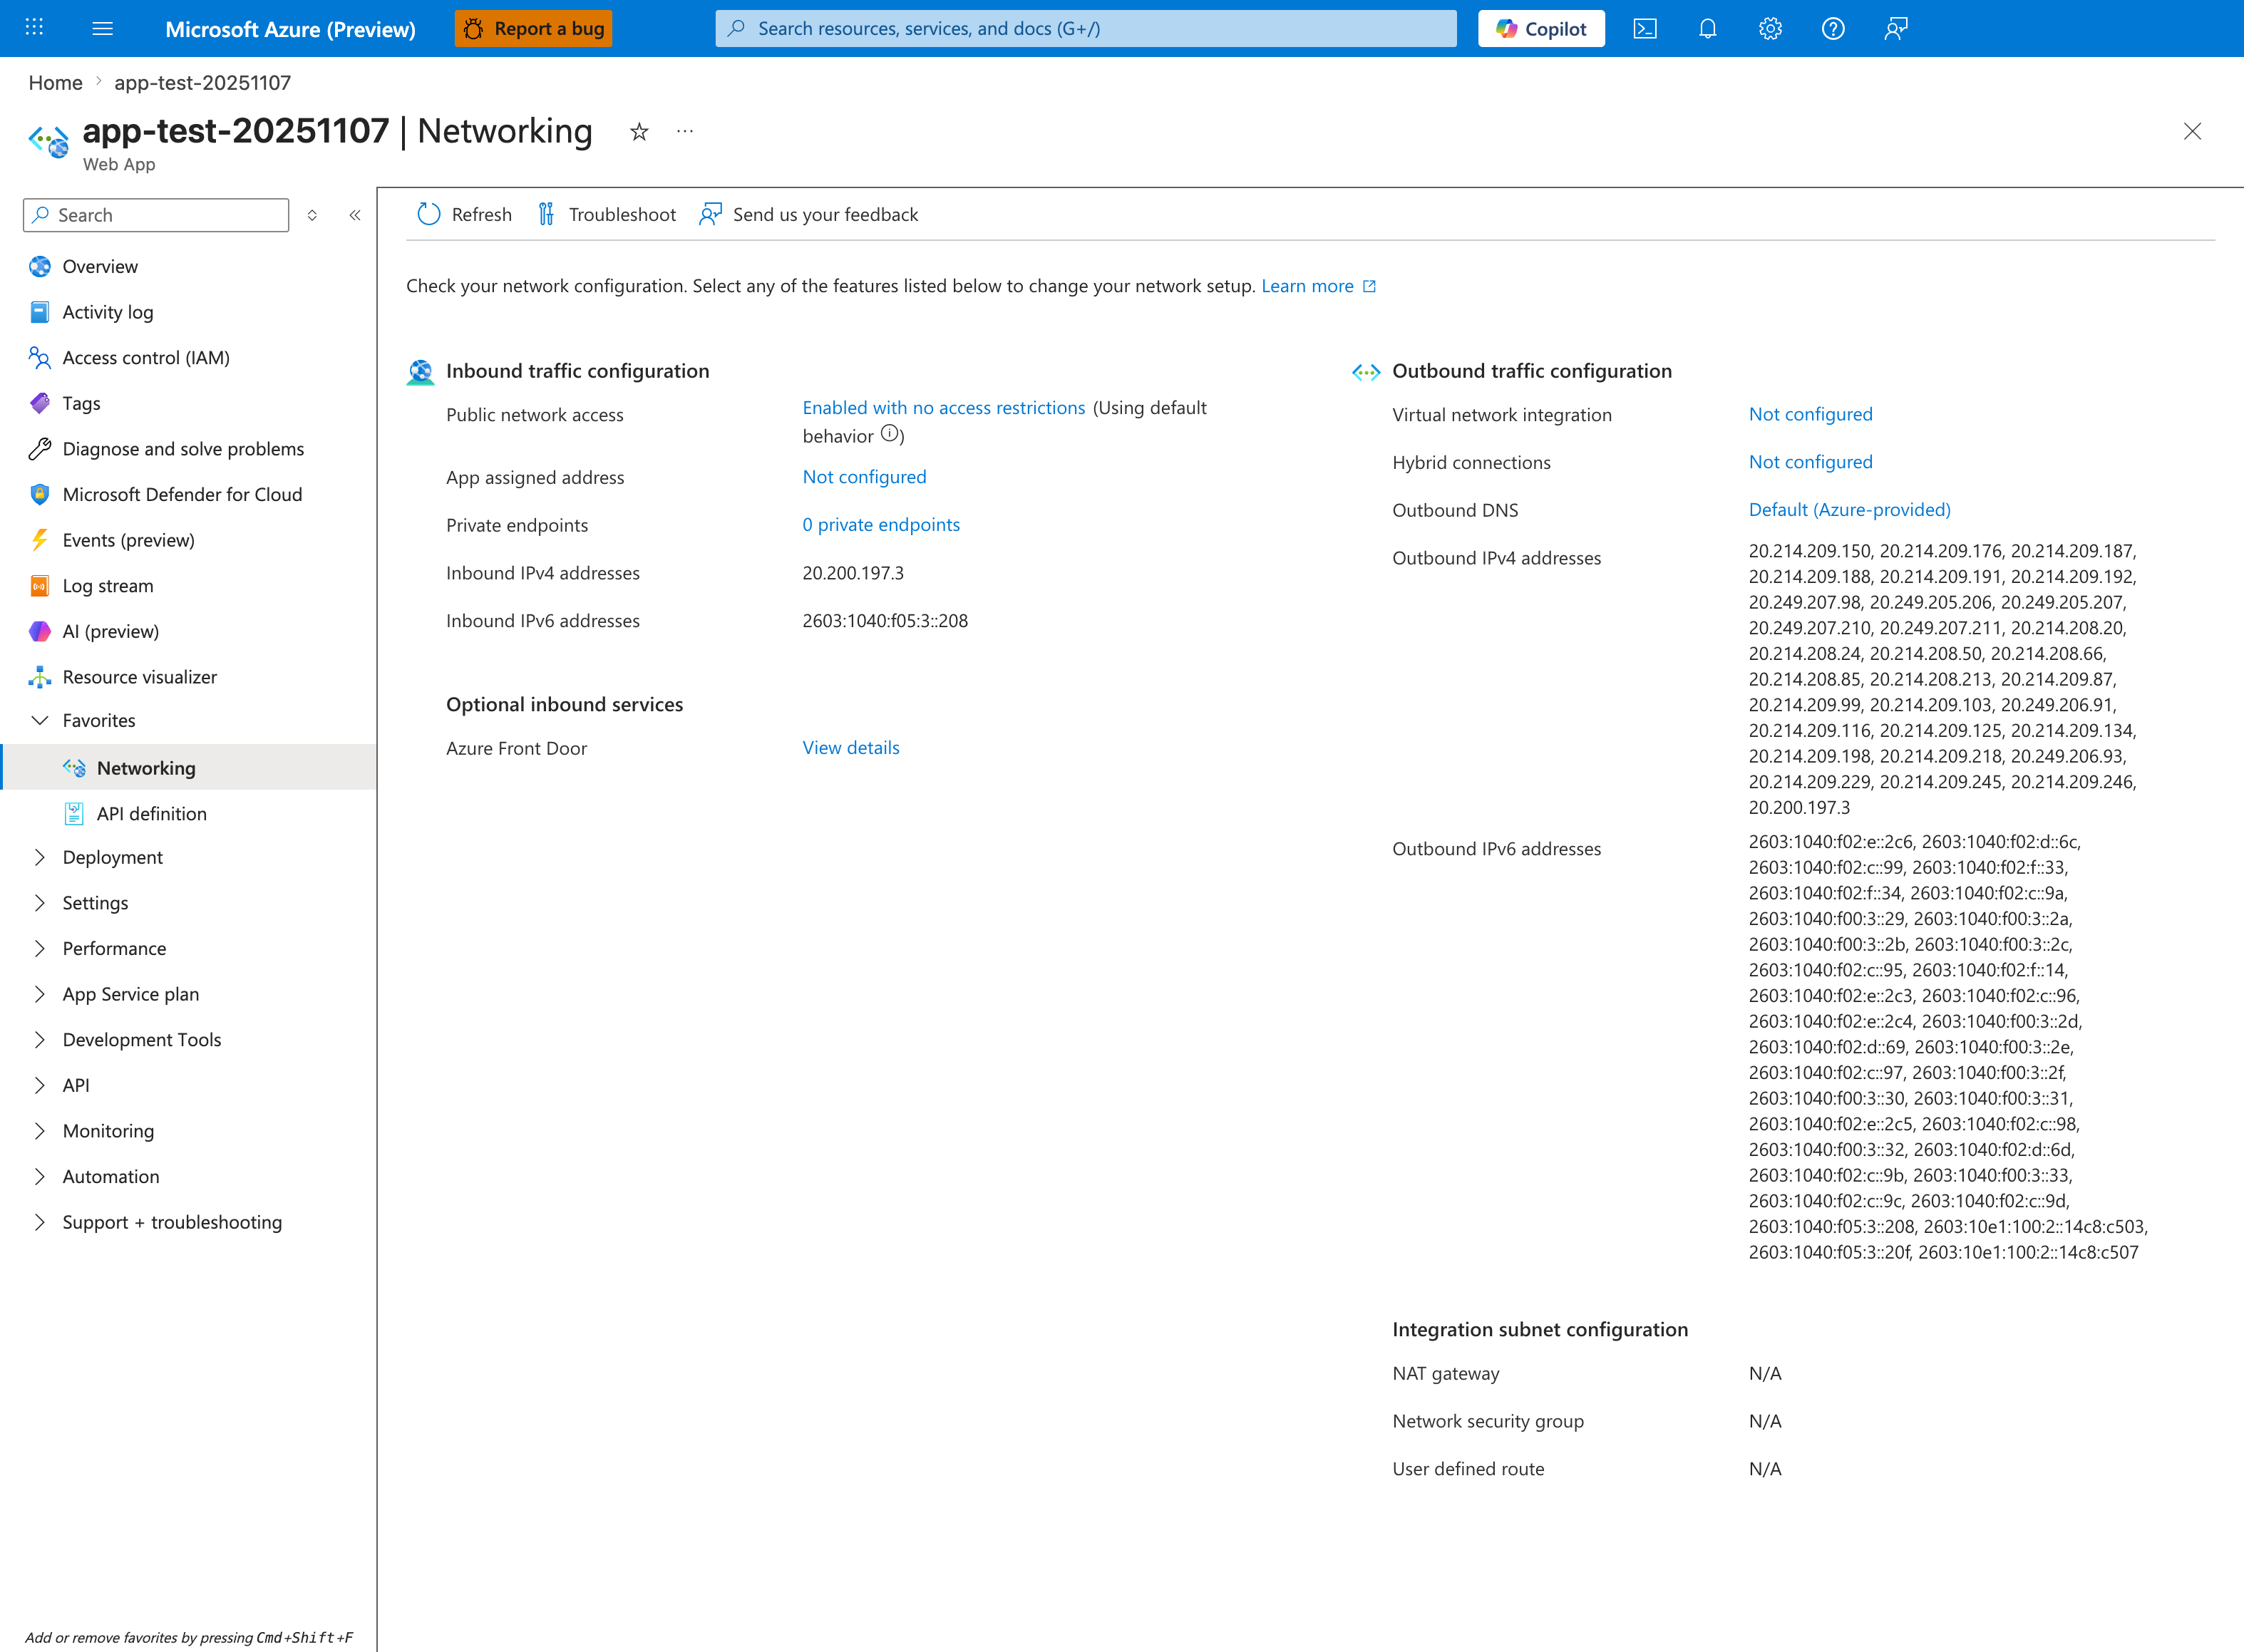
The Networking hub is the single pane that decides whether your outbound failure is a routing problem or a dependency problem. The Outbound traffic configuration column on the right is the first thing to check: Virtual network integration: Not configured plus Outbound DNS: Default (Azure-provided) plus the long list of Outbound IPv4 addresses means traffic egresses directly from the App Service shared outbound pool, NOT through your VNet - so private endpoints, NSGs, and custom DNS in your VNet have zero effect on it. If this app was supposed to reach a database via VNet integration, this screen would have proven the misconfiguration in 10 seconds. Note the Integration subnet configuration card showing NAT gateway: N/A - that line only populates when VNet integration is active.
- Good signal: expected subnet integration and healthy state.
- Bad signal: disconnected/misconfigured integration, wrong subnet, or route mismatch.
Step 5: Validate DNS resolution from Kudu/SSH
Prove whether failures happen before connect (resolution) or after connect (network/dependency). - Portal path: App Service -> Development Tools -> SSH (or Kudu SSH) - Commands:
- Good signal: consistent, expected DNS answer.
- Bad signal: NXDOMAIN, intermittent SERVFAIL, or wrong IP family/target.
Step 6: Check Private Endpoint + DNS mapping (if applicable)
Private Endpoint without correct DNS zone linkage can silently route to wrong targets. - Portal path: - Dependency resource -> Networking -> Private endpoint connections - Private DNS zones -> Virtual network links- Good signal: approved Private Endpoint and correct private DNS zone links. - Bad signal: pending/rejected endpoint, missing DNS link, or public IP resolution when private expected.
Step 7: Check NAT Gateway attachment and health (if applicable)
If NAT Gateway is expected but not applied, outbound behavior may differ from design. - Portal path: VNet -> Subnets ->
- Good signal: correct NAT Gateway association and healthy outbound path.
- Bad signal: no NAT association when expected, or wrong subnet association.
Step 8: Confirm timeout/error signatures in console logs
Use log signatures to separate DNS, connect, and upstream timeout patterns. - KQL:
AppServiceConsoleLogs
| where TimeGenerated > ago(1h)
| where ResultDescription has_any ("timeout", "timed out", "ENOTFOUND", "Name or service not known", "connection refused", "ECONNRESET")
| project TimeGenerated, ResultDescription
| order by TimeGenerated desc
- Good signal: no concentrated outbound error pattern.
- Bad signal: repeated DNS or connect-timeout errors in incident window.
Decision Points
After these checks, you should be able to: - Narrow to 1-2 hypotheses: - SNAT pressure: detector + TCP connection trend support exhaustion - DNS issue: nslookup failures or wrong resolution path - Route/Private Endpoint issue: VNet/PE/DNS zone mismatch- Choose next playbook: - SNAT -> connection reuse/SNAT playbook - DNS -> DNS resolution playbook - Route/PE -> Private Endpoint and custom DNS playbook