Checklists
Fast triage guides for the first 10 minutes of an investigation.
These checklists help you quickly narrow down the problem category and identify which playbook to follow for deeper analysis.
graph TD
    A[Initial incident signal] --> B{Choose first-response checklist}
    B --> C[Performance checklist]
    B --> D[Outbound or Network checklist]
    B --> E[Startup or Availability checklist]
    C --> F[Performance playbooks]
    D --> G[Network playbooks]
E --> H[Startup playbooks]| Checklist | When to Use |
|---|---|
| Performance | Slow responses, high latency, elevated error rates |
| Outbound / Network | Outbound connection failures, DNS issues, SNAT |
| Startup / Availability | Container won't start, site down, deployment failures |
Portal views
Each checklist row above has a corresponding entry surface in the Azure Portal. The following blades render rows that overlap with the checklist's "When to Use" wording without leaving the Portal navigation.
Portal view: Performance checklist
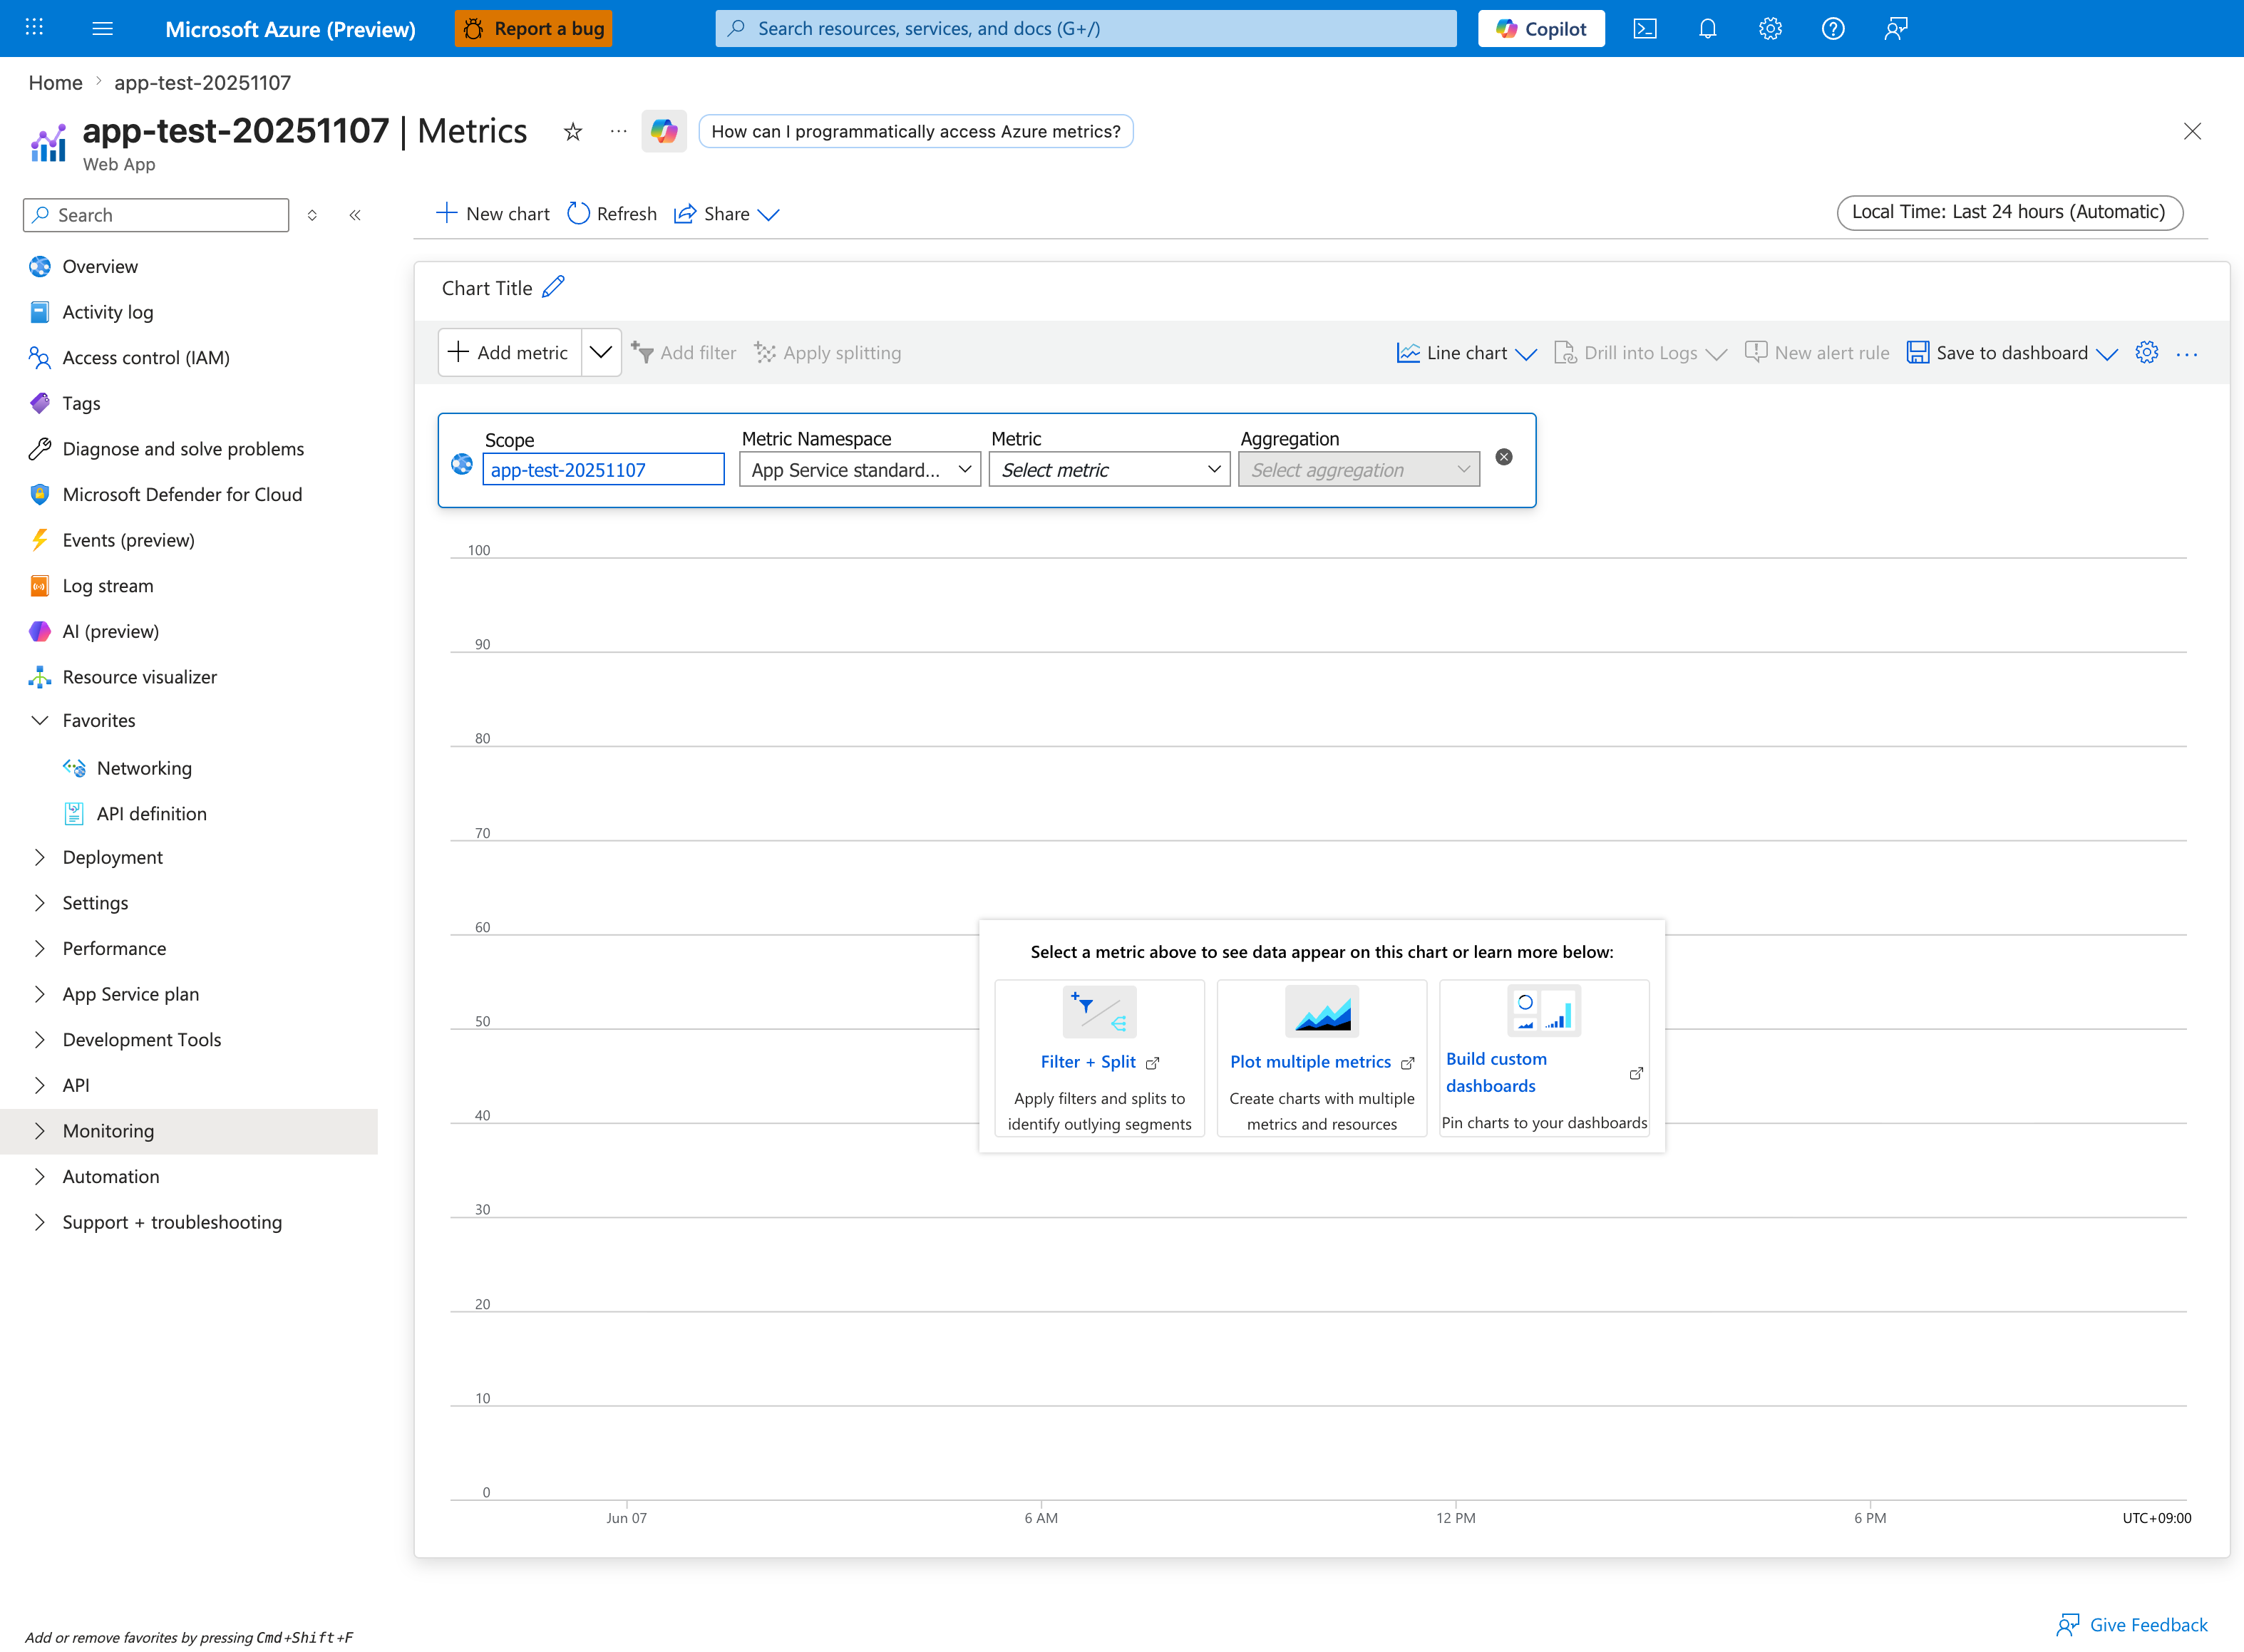
[Observed] app-test-20251107 | Metrics Web App New chart Refresh Share Local Time: Last 24 hours (Automatic) Chart Title Add metric Add filter Apply splitting Line chart Drill into Logs New alert rule Save to dashboard Scope app-test-20251107 Metric Namespace App Service standard... Metric Select metric Aggregation Select aggregation Select a metric above to see data appear on this chart or learn more below: Filter + Split Apply filters and splits to identify outlying segments Plot multiple metrics Create charts with multiple metrics and resources Build custom dashboards Pin charts to your dashboards Jun 07 6 AM 12 PM 6 PM UTC+09:00.
[Inferred] The metric-definition row labels Scope, Metric Namespace, Metric, and Aggregation are consistent with the per-chart configuration steps suggested by the Performance checklist row above ("Slow responses, high latency, elevated error rates"). The Local Time: Last 24 hours (Automatic) time range chip is consistent with the first-10-minutes triage window scope of this index page.
[Not Proven] Additional metric value detail, data series detail, and historical detail are not visible on this view.
Portal view: Outbound / Network checklist
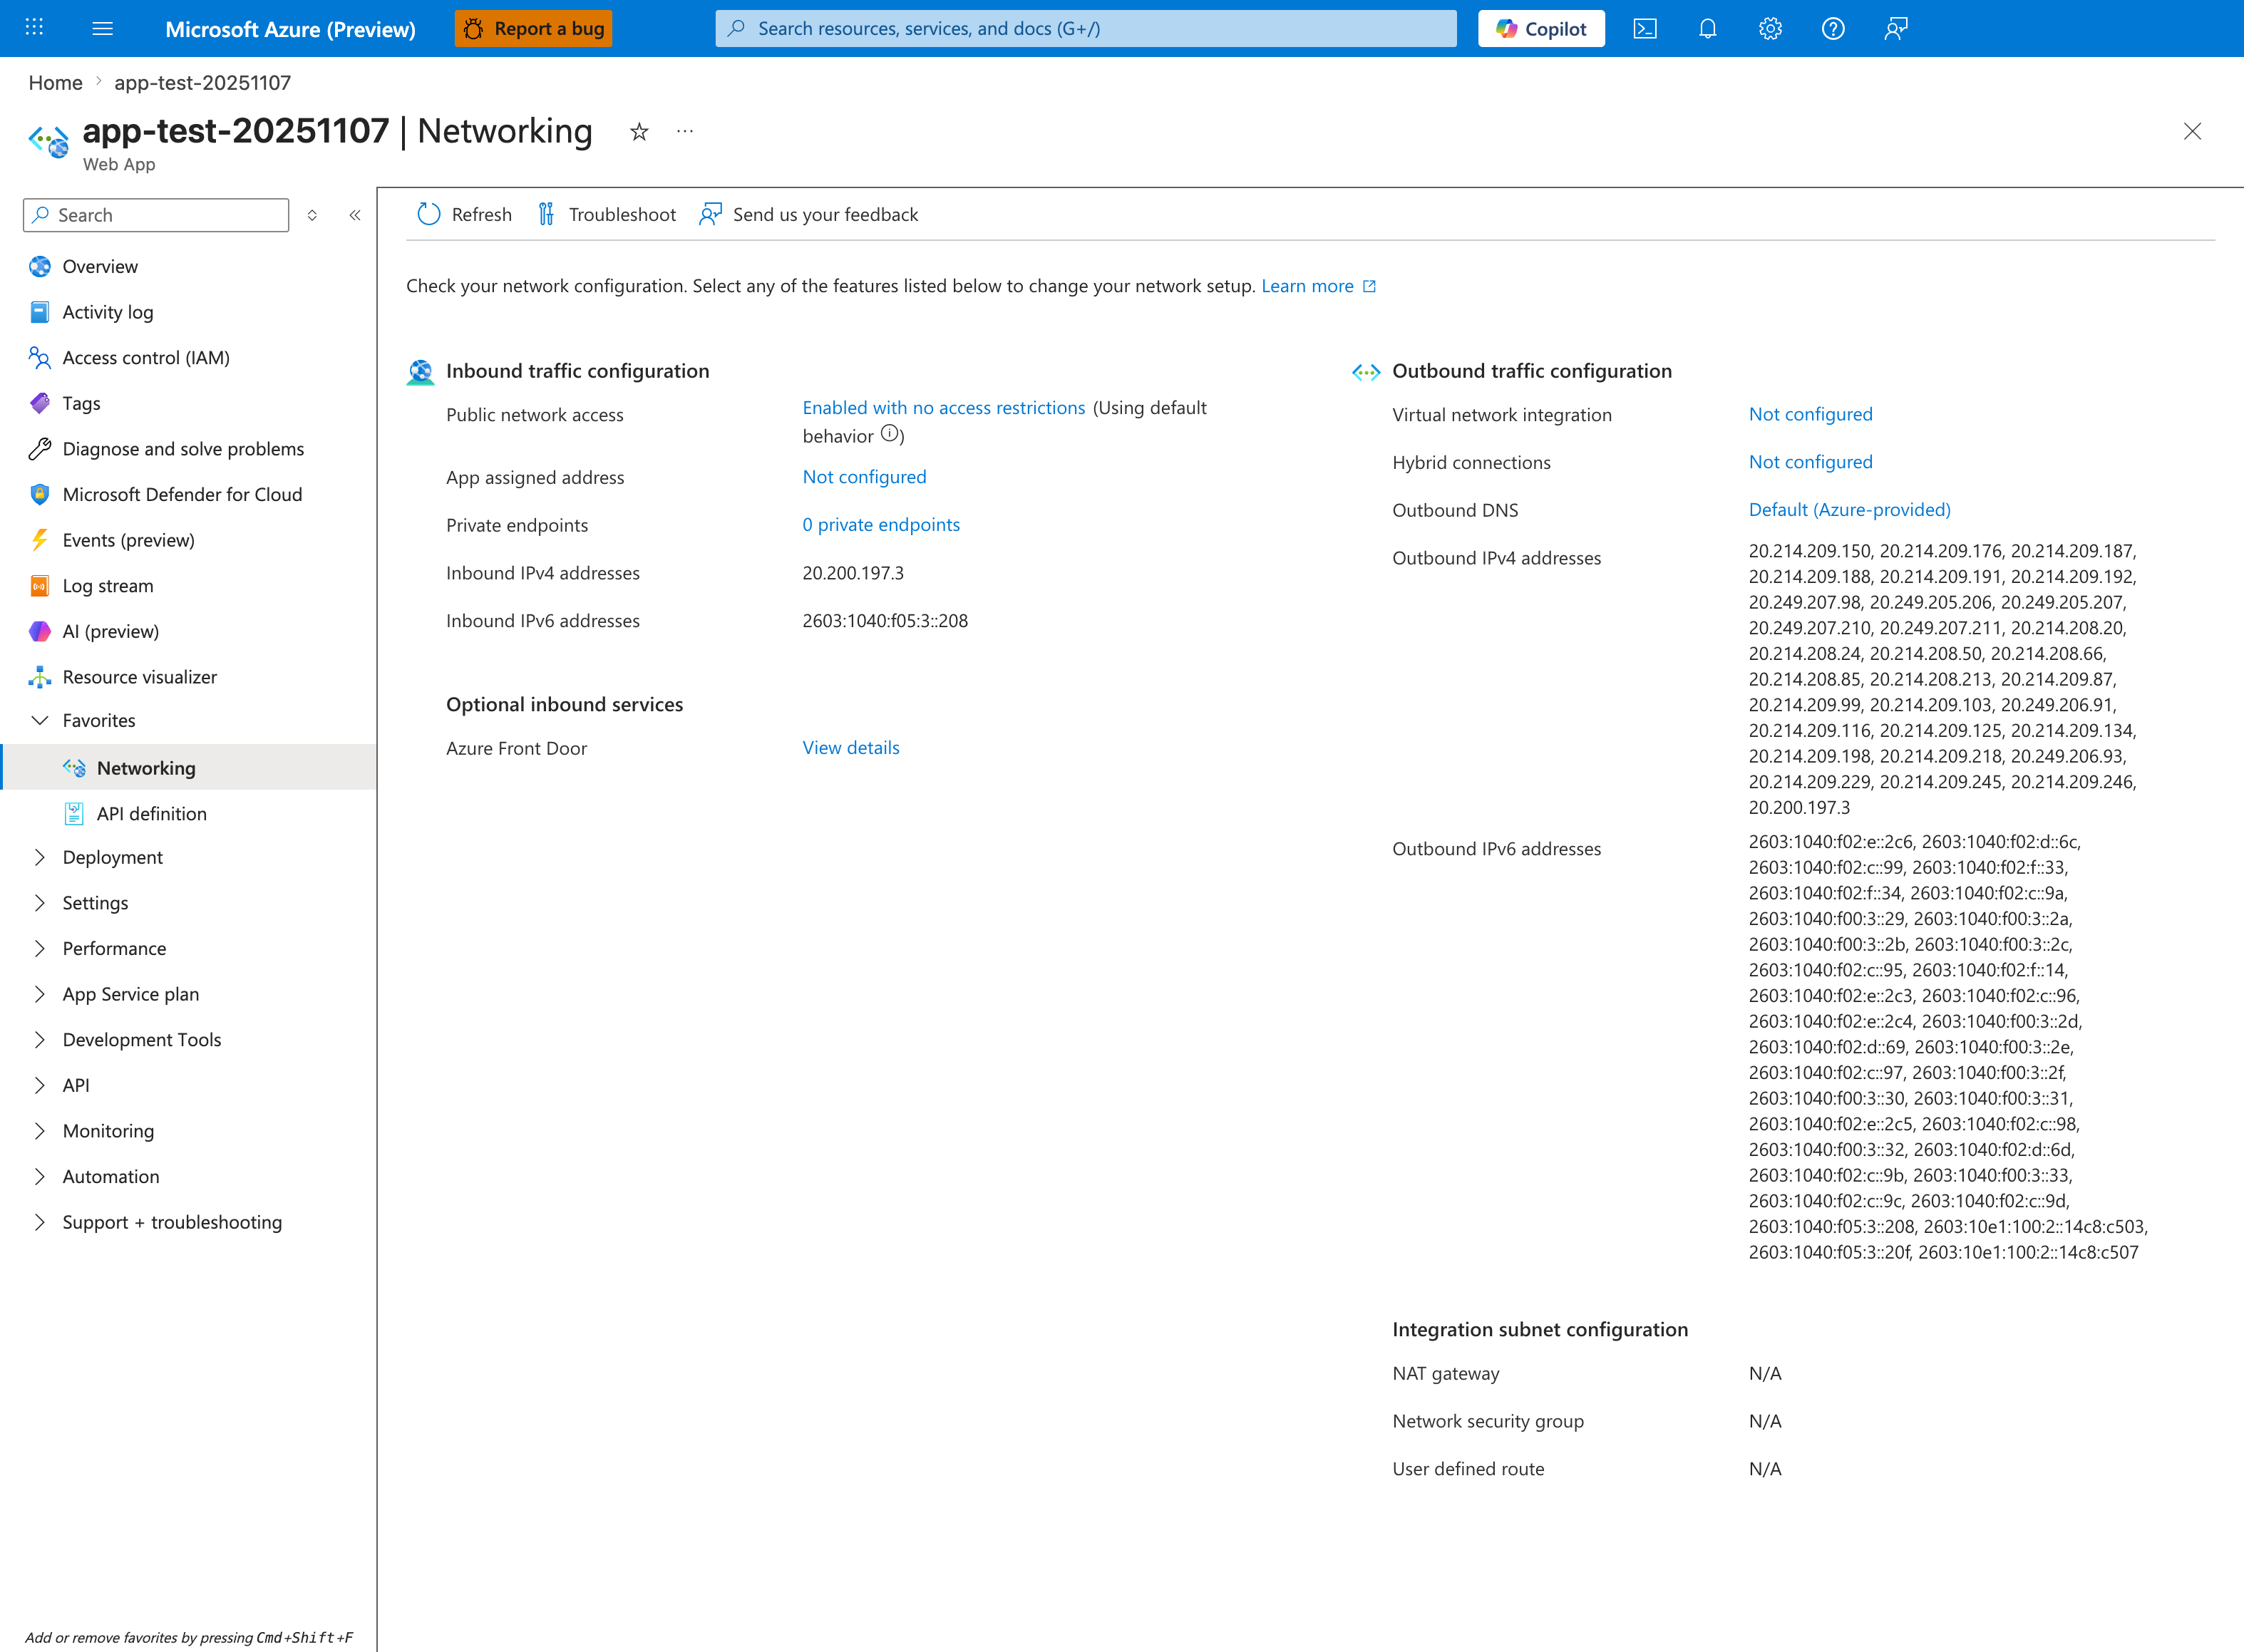
[Observed] app-test-20251107 | Networking Web App Refresh Troubleshoot Send us your feedback Check your network configuration. Select any of the features listed below to change your network setup. Learn more Inbound traffic configuration Public network access Enabled with no access restrictions Using default behavior App assigned address Not configured Private endpoints 0 private endpoints Inbound IPv4 addresses 20.200.197.3 Inbound IPv6 addresses 2603:1040:f05:3::208 Optional inbound services Azure Front Door View details Outbound traffic configuration Virtual network integration Not configured Hybrid connections Not configured Outbound DNS Default (Azure-provided) Outbound IPv4 addresses Outbound IPv6 addresses Integration subnet configuration NAT gateway N/A Network security group N/A User defined route N/A.
[Inferred] The Outbound traffic configuration section labels Virtual network integration, Hybrid connections, Outbound DNS, and the Outbound IPv4 addresses list are consistent with the outbound-related topics listed in the Outbound / Network checklist row above ("Outbound connection failures, DNS issues, SNAT"). The Integration subnet configuration section with its NAT gateway, Network security group, and User defined route rows all showing N/A is consistent with the Virtual network integration row showing Not configured directly above.
[Not Proven] Additional outbound-configuration detail beyond the visible summary is not shown on this view.
Portal view: Startup / Availability checklist
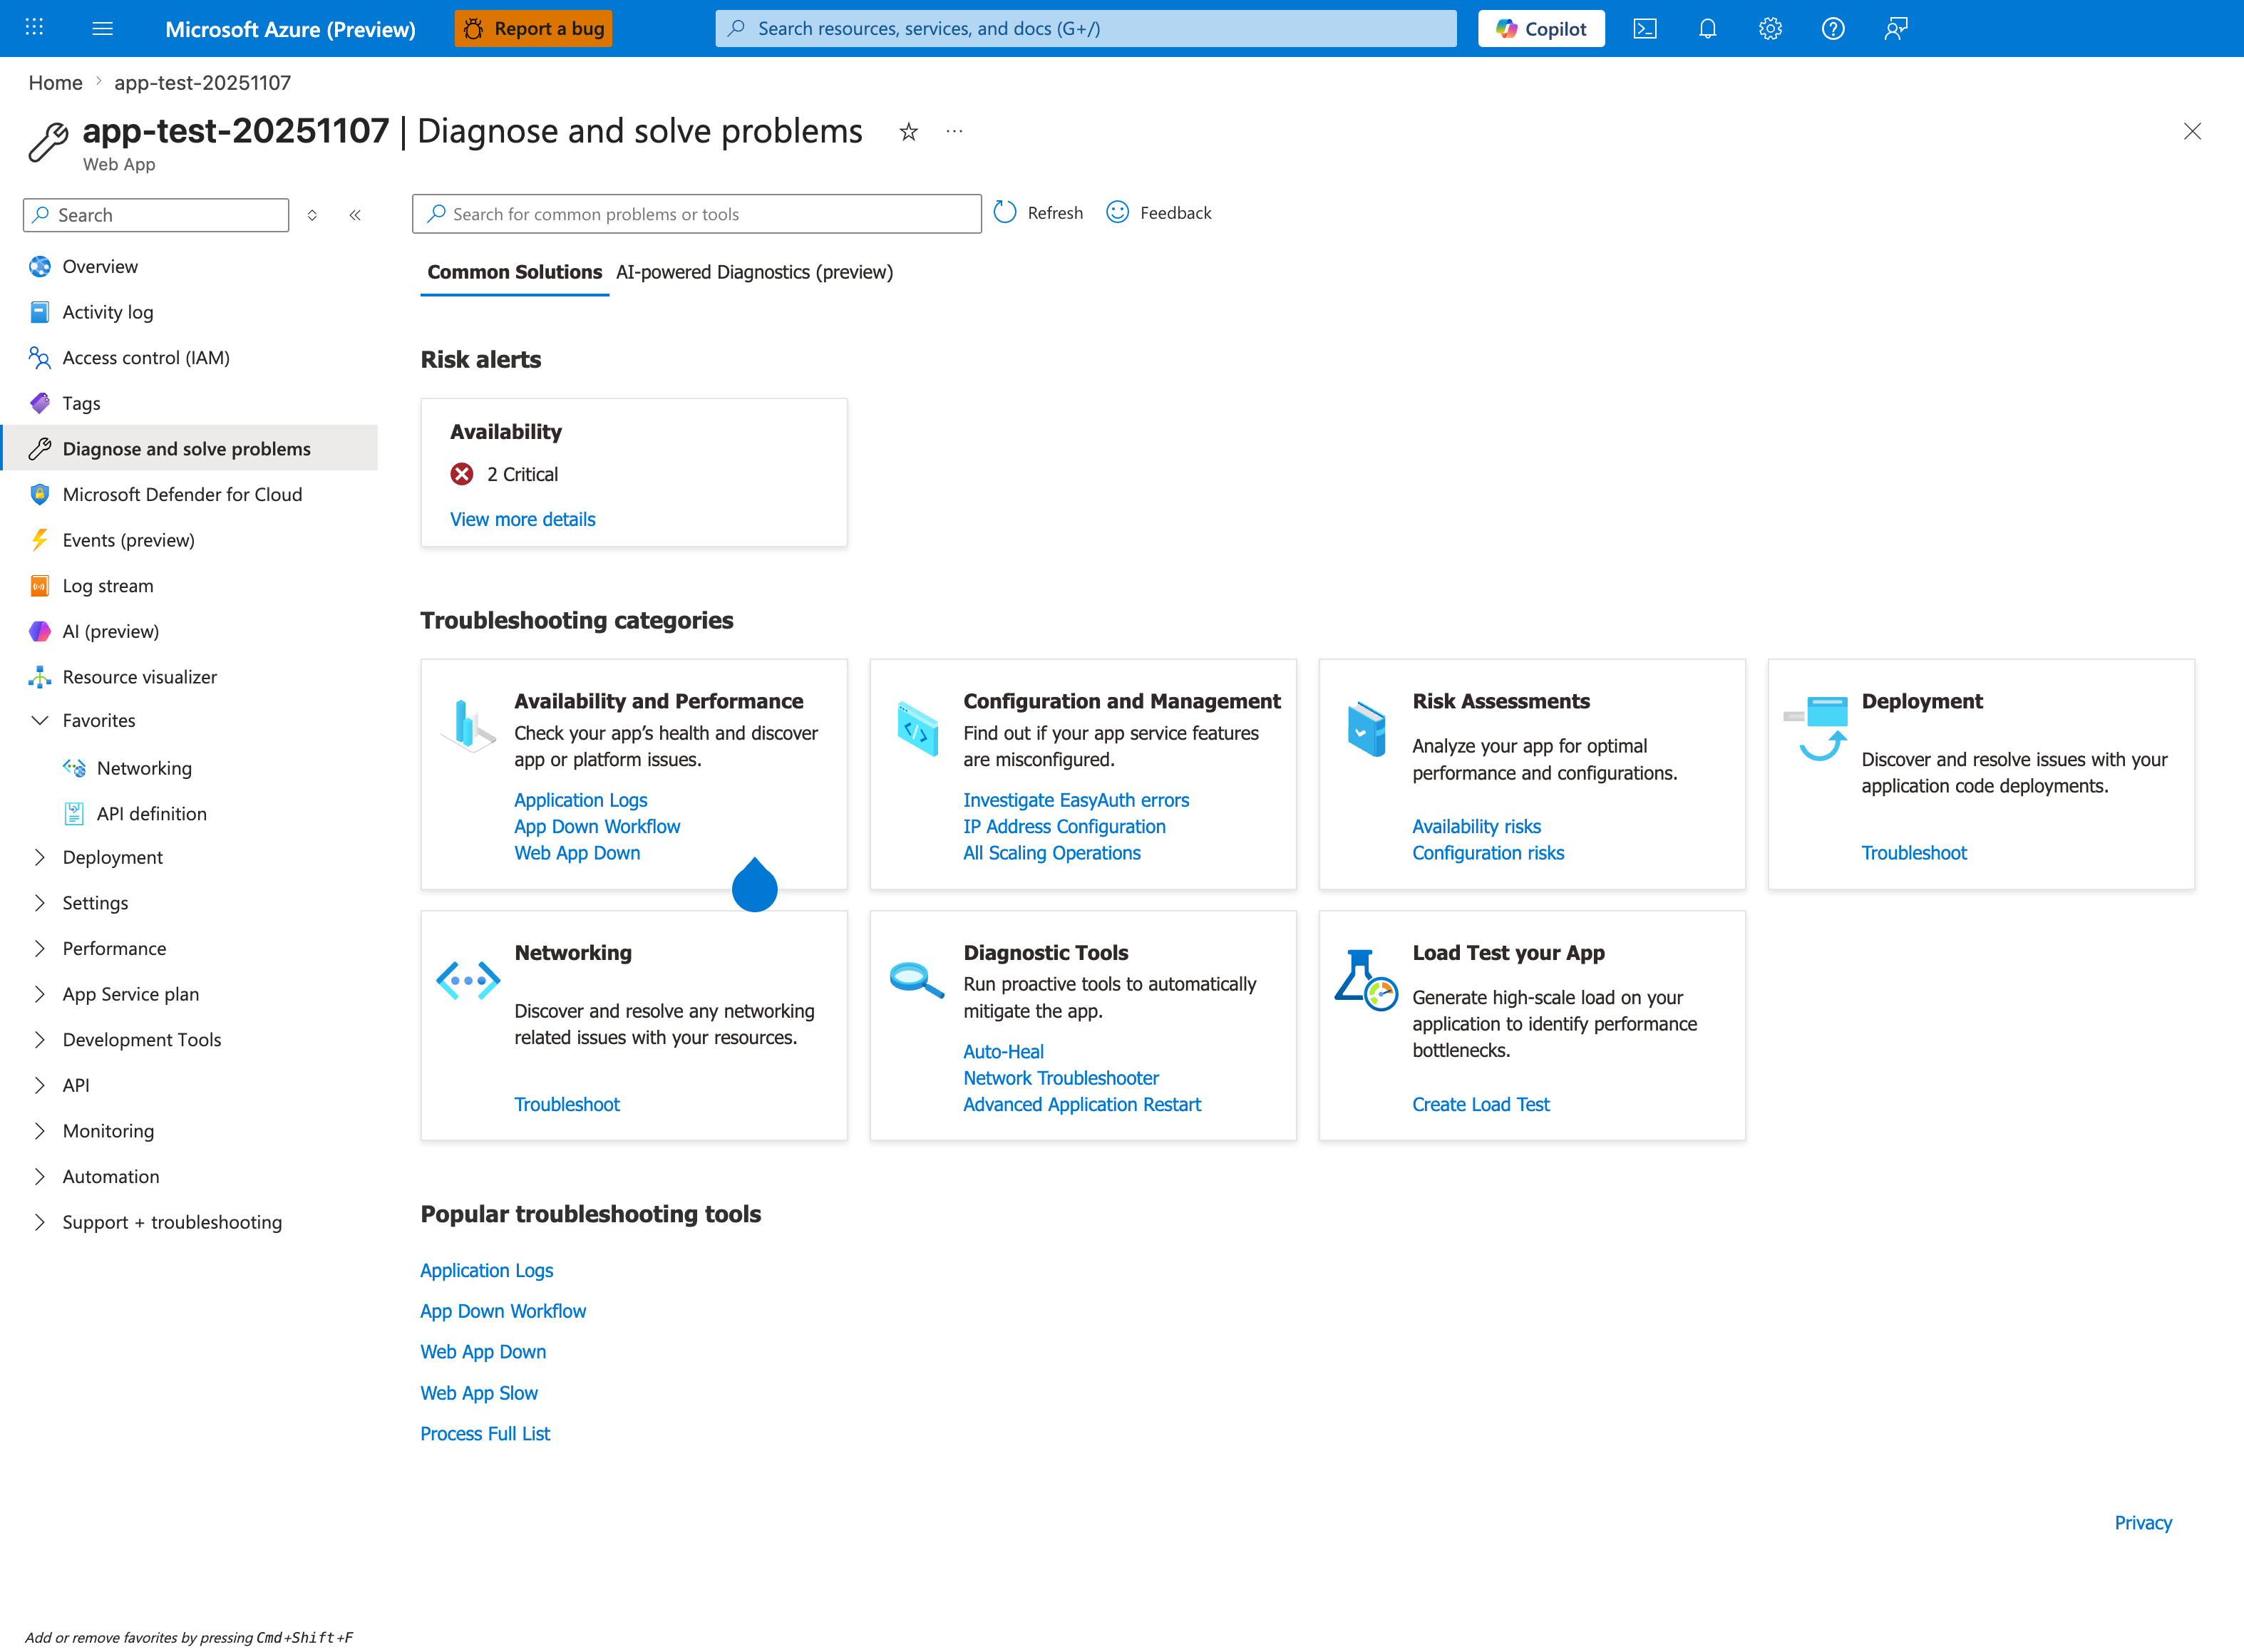
[Observed] app-test-20251107 | Diagnose and solve problems Web App Search for common problems or tools Refresh Feedback Common Solutions AI-powered Diagnostics (preview) Risk alerts Availability 2 Critical View more details Troubleshooting categories Availability and Performance Check your app's health and discover app or platform issues. Application Logs App Down Workflow Web App Down Configuration and Management Find out if your app service features are misconfigured. Investigate EasyAuth errors IP Address Configuration All Scaling Operations Risk Assessments Analyze your app for optimal performance and configurations. Availability risks Configuration risks Deployment Discover and resolve issues with your application code deployments. Troubleshoot Networking Discover and resolve any networking related issues with your resources. Diagnostic Tools Run proactive tools to automatically mitigate the app. Auto-Heal Network Troubleshooter Advanced Application Restart Load Test your App Generate high-scale load on your application to identify performance bottlenecks. Create Load Test Popular troubleshooting tools Application Logs App Down Workflow Web App Down Web App Slow Process Full List.
[Inferred] The Availability and Performance category card lists the links Application Logs, App Down Workflow, and Web App Down. The Popular troubleshooting tools section at the bottom repeats App Down Workflow and Web App Down, and additionally lists Web App Slow and Process Full List. These link names are consistent with the topics listed in the Startup / Availability checklist row above ("Container won't start, site down, deployment failures") and the Performance checklist row ("Slow responses").
[Not Proven] Additional alert detail and detector detail beyond the visible summaries is not shown on this view.