Evidence Map for App Service Troubleshooting
This page maps common investigation questions to the best evidence source, the CLI command to run, and the KQL table/query to use.
Use it when you know what you need to answer but not where to collect proof.
flowchart TD
    Q[Investigation Question] --> S[Evidence Source]
    S --> CLI[CLI Command]
    S --> KQL[KQL Query]
    CLI --> P[Proof Artifact]
    KQL --> P
    P --> H[Hypothesis Validation]
Why an evidence map
During incidents, teams lose time by checking the wrong signal first.
- HTTP errors are checked in CPU charts
- startup issues are checked only in app code
- DNS/SNAT issues are diagnosed without outbound evidence
An evidence map reduces this by pairing each question with a reproducible command and query.
Use CLI and query artifacts for reproducible investigations
Since log result capture from the browser is awkward and difficult to maintain, use CLI queries and example outputs. This makes investigation reproducible, easier to copy, and easier to interpret.
Portal view: Application Insights Logs query editor
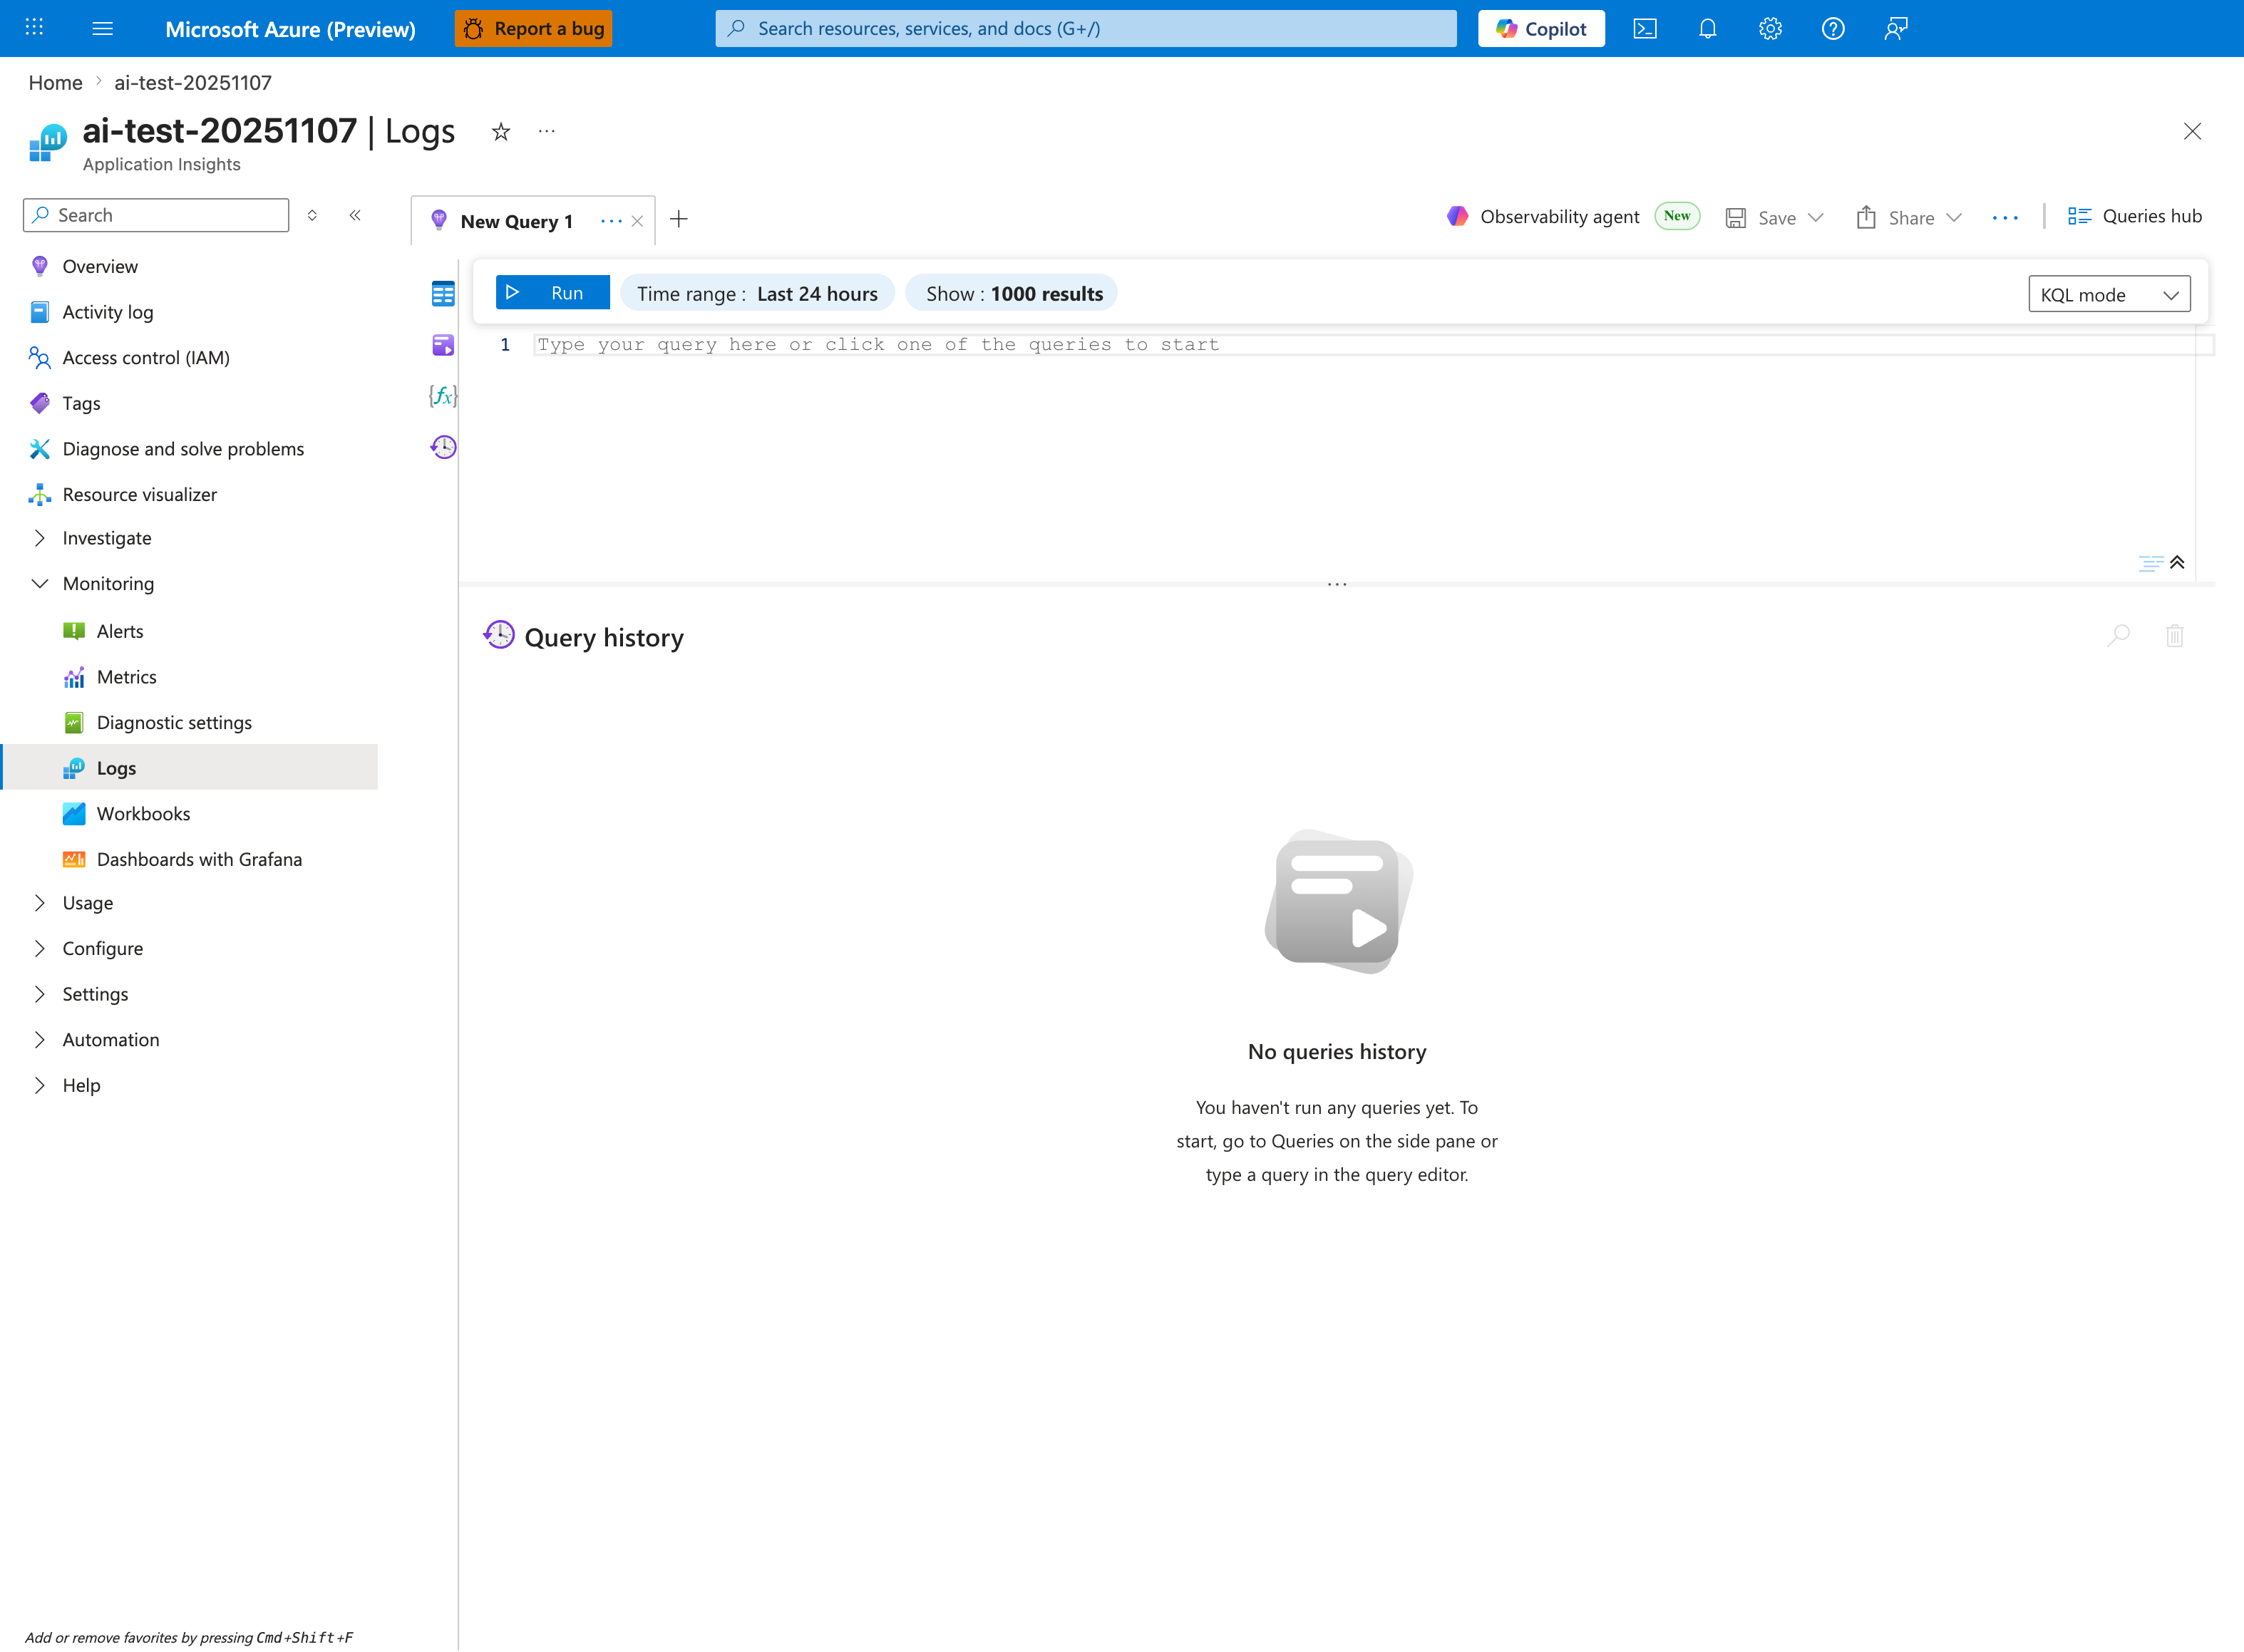
The Logs blade is the canonical entry point for every KQL snippet in this evidence map. The Time range: Last 24 hours selector is the first control to adjust during an incident — most queries below scope to ago(6h) or ago(24h), so widening or narrowing the blade-level window must match the | where TimeGenerated > ago(...) clause to avoid empty results from a stale time filter. The KQL mode dropdown distinguishes raw Kusto from Simple mode; all queries on this page assume KQL mode. The empty Query history panel here means a fresh workspace — during real incidents this panel becomes the reproducibility artifact you preserve in the ticket alongside CLI output.
Quick Map (Question → Source → Command → Table)
| Question | Best Source | CLI Command | KQL Table |
|---|---|---|---|
| Was the app restarting? | Platform logs + Activity Log | az monitor activity-log list --resource-group <resource-group> --offset 24h | AppServicePlatformLogs |
| Were requests failing? | HTTP logs | az monitor metrics list --resource <app-resource-id> --metric "Http5xx,Requests" --interval PT1M | AppServiceHTTPLogs |
| Was startup failing? | Console logs | az webapp log tail --resource-group <resource-group> --name <app-name> | AppServiceConsoleLogs |
| Was a dependency slow? | App logs + latency trend | az monitor metrics list --resource <app-resource-id> --metric "AverageResponseTime" --interval PT1M | AppServiceAppLogs |
| Was DNS failing? | Console/app logs + runtime test output | az webapp ssh --resource-group <resource-group> --name <app-name> | AppServiceConsoleLogs |
| Was scale involved? | Metrics + platform events | az monitor metrics list --resource <app-resource-id> --metric "CpuPercentage,MemoryWorkingSet" --interval PT1M | AppServicePlatformLogs |
| Was disk full? | Console logs + filesystem command output | az webapp log tail --resource-group <resource-group> --name <app-name> | AppServiceConsoleLogs |
| Was memory exhausted? | Process/platform signals | az monitor metrics list --resource <app-resource-id> --metric "MemoryWorkingSet" --interval PT1M | AppServicePlatformLogs |
| Was SNAT exhausted? | Outbound diagnostics + errors | az monitor metrics list --resource <app-resource-id> --metric "Http5xx,Requests" --interval PT1M | AppServiceConsoleLogs |
| Was there a deployment? | Activity Log | az monitor activity-log list --resource-group <resource-group> --offset 24h --status Succeeded | AppServicePlatformLogs |
| Was health check failing? | Platform health signals | az webapp show --resource-group <resource-group> --name <app-name> | AppServicePlatformLogs |
| Was slot swap involved? | Activity Log + swap events | az webapp deployment slot list --resource-group <resource-group> --name <app-name> | AppServicePlatformLogs |
| Was there a config change? | Activity Log + app settings snapshot | az webapp config appsettings list --resource-group <resource-group> --name <app-name> | AppServicePlatformLogs |
| Was the container killed? | Platform + console kill messages | az webapp log tail --resource-group <resource-group> --name <app-name> | AppServicePlatformLogs |
| Were there network errors? | Console logs | az webapp log tail --resource-group <resource-group> --name <app-name> | AppServiceConsoleLogs |
| Did warm-up fail during swap? | swap diagnostics + startup logs | az monitor activity-log list --resource-group <resource-group> --offset 6h | AppServicePlatformLogs |
Detailed Evidence Recipes
1) Was the app restarting?
CLI
KQL
AppServicePlatformLogs
| where TimeGenerated > ago(24h)
| where ResultDescription has_any ("restart", "recycle", "container", "stopped", "started")
| project TimeGenerated, OperationName, ResultDescription, Host
| order by TimeGenerated desc
2) Were requests failing?
CLI
KQL
AppServiceHTTPLogs
| where TimeGenerated > ago(6h)
| summarize total=count(), err5xx=countif(ScStatus >= 500 and ScStatus < 600) by bin(TimeGenerated, 5m)
| extend errPct=todouble(err5xx)*100.0/iif(total==0,1,total)
| order by TimeGenerated asc
3) Was startup failing?
Portal view: Log stream blade streaming runtime logs
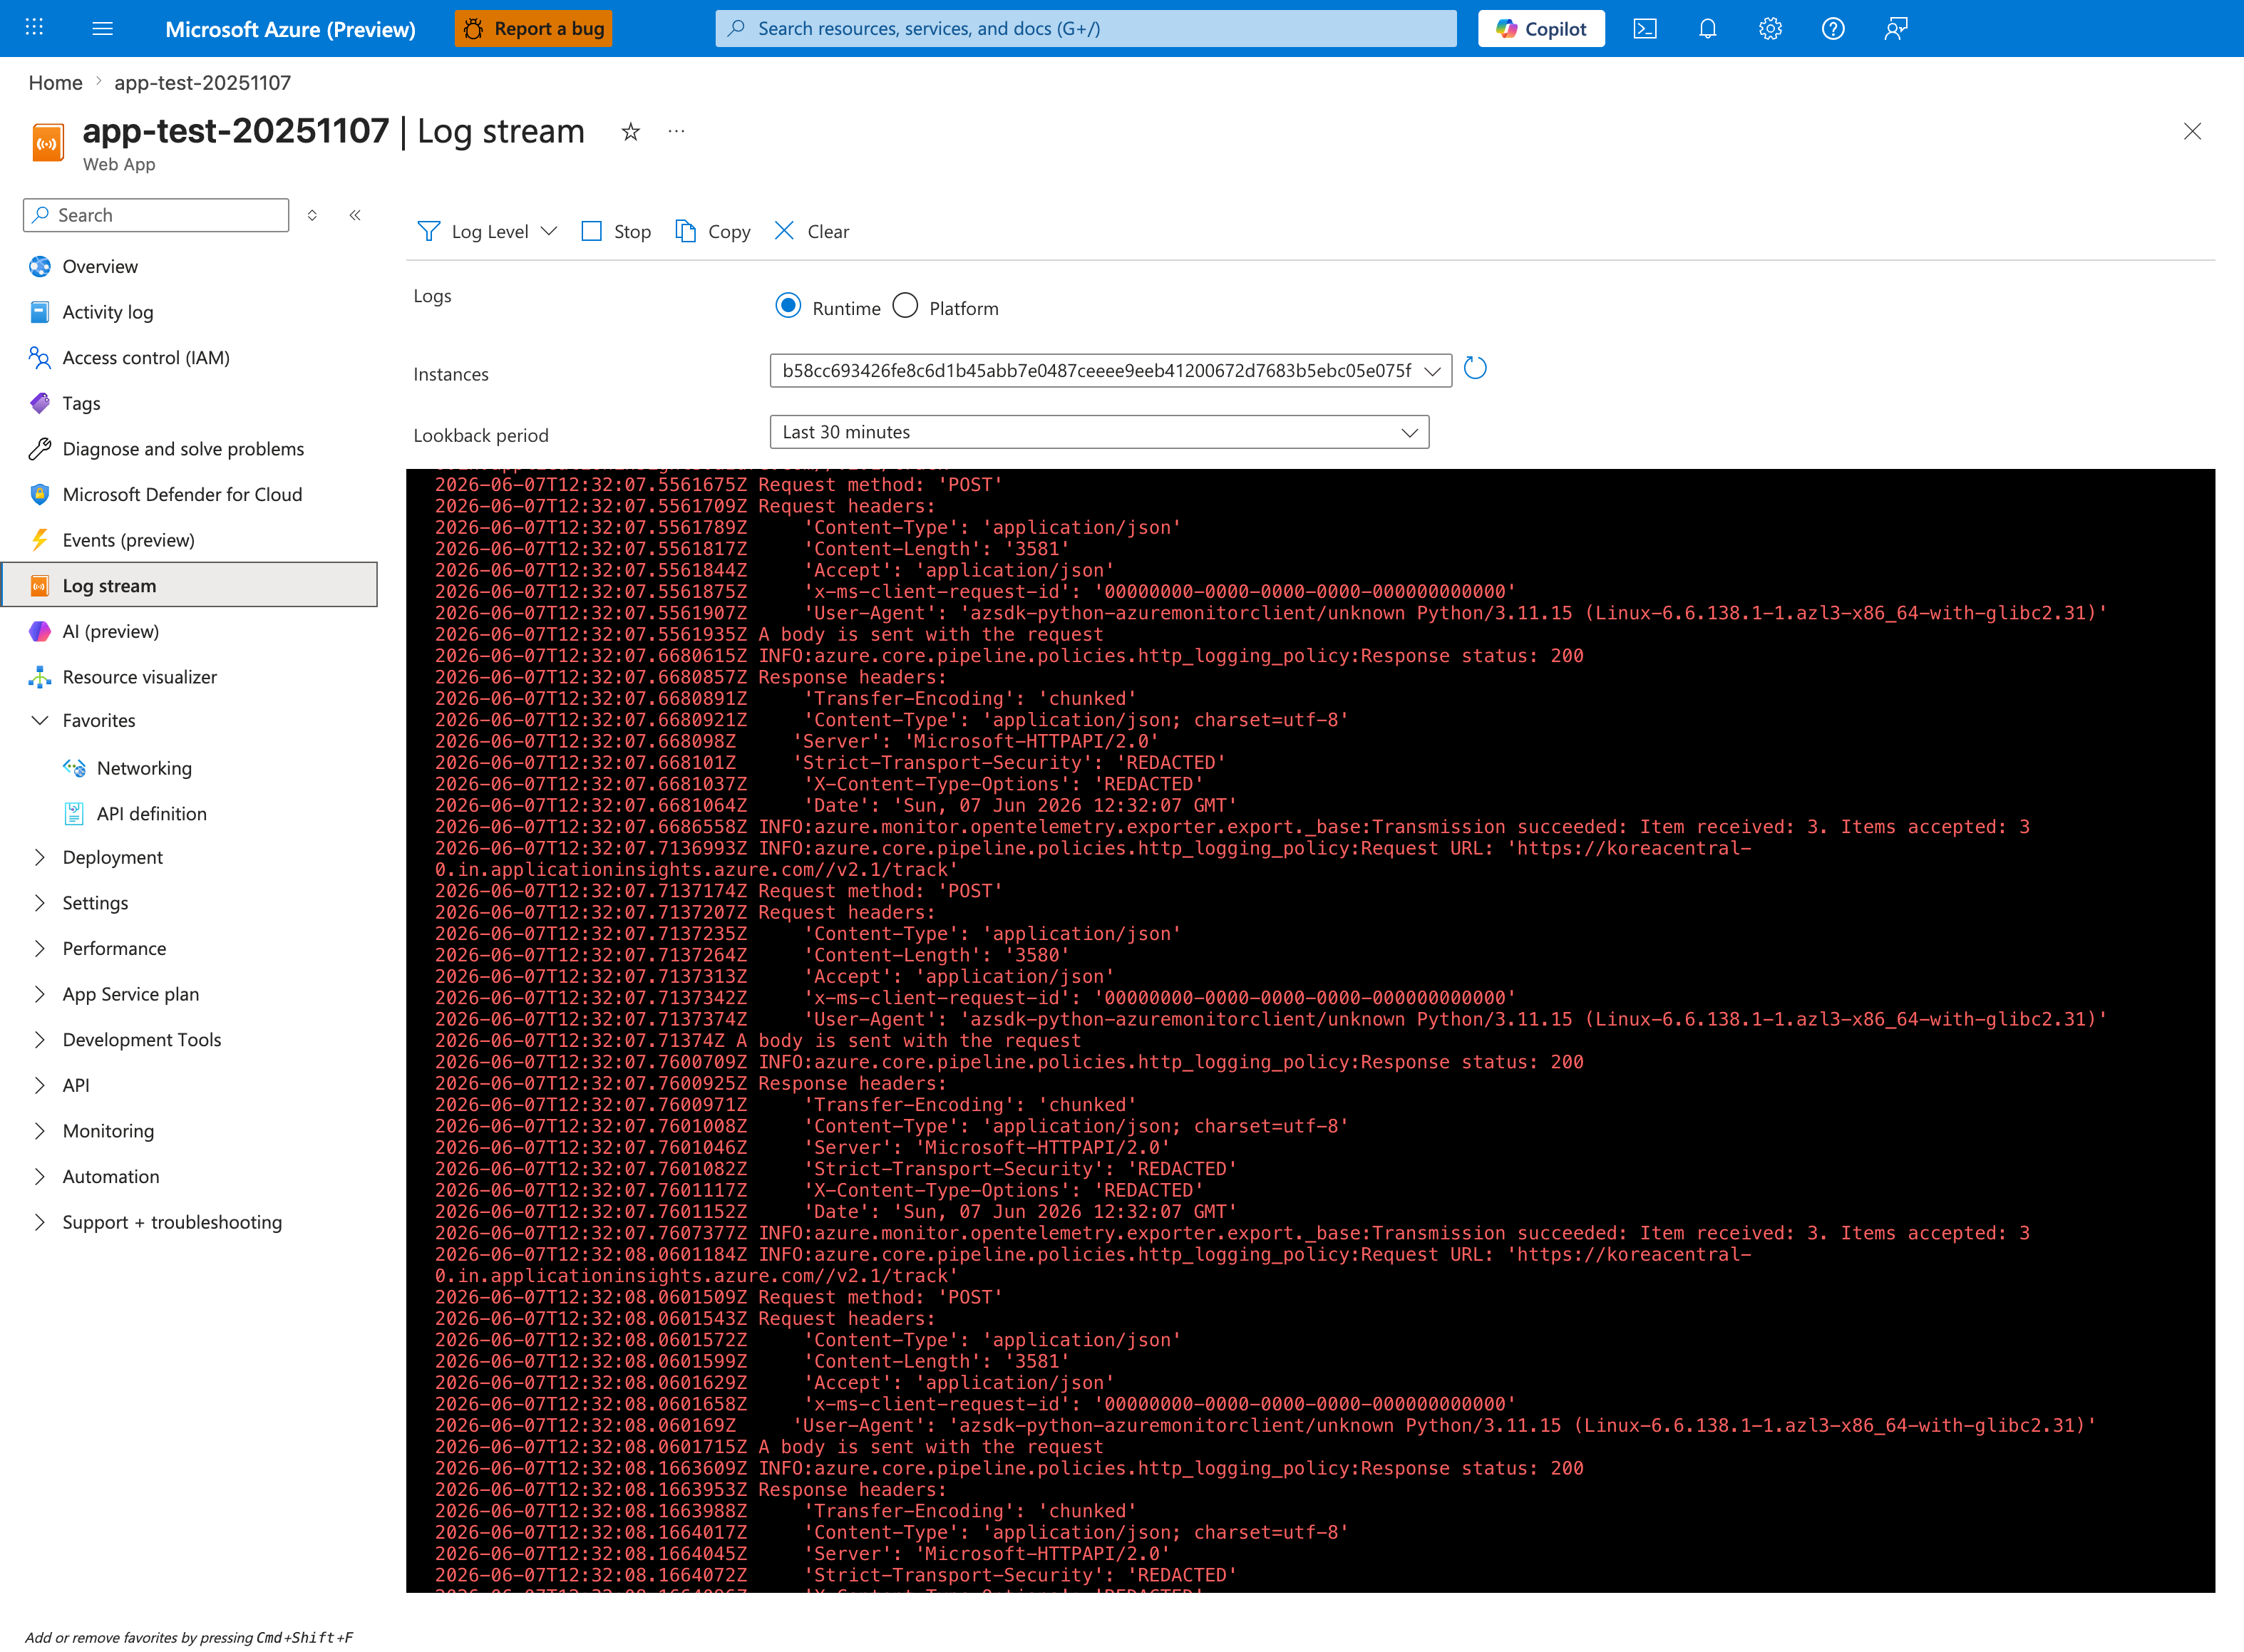
The Log stream blade is the fastest way to confirm whether startup is silent (no logs at all) versus failing (errors visible in real time). The Runtime radio selects application logs from your container's stdout/stderr — this is where Python tracebacks, Node.js Error: listen EADDRINUSE, and Java BindException will surface. Switch to Platform when investigating whether App Service itself is restarting the container or printing health-check failures. The Instances dropdown matters during multi-instance incidents because each worker streams independently — if startup is failing on only one instance, you must rotate through each instance ID to find the failing one. The CLI command below produces the same stream without the browser-side UI lag.
CLI
KQL
AppServiceConsoleLogs
| where TimeGenerated > ago(6h)
| where ResultDescription has_any ("failed to start", "could not bind", "listen", "startup", "didn't respond")
| project TimeGenerated, ResultDescription, Host
| order by TimeGenerated desc
4) Was a dependency slow?
Portal view: Application Insights Overview dashboard
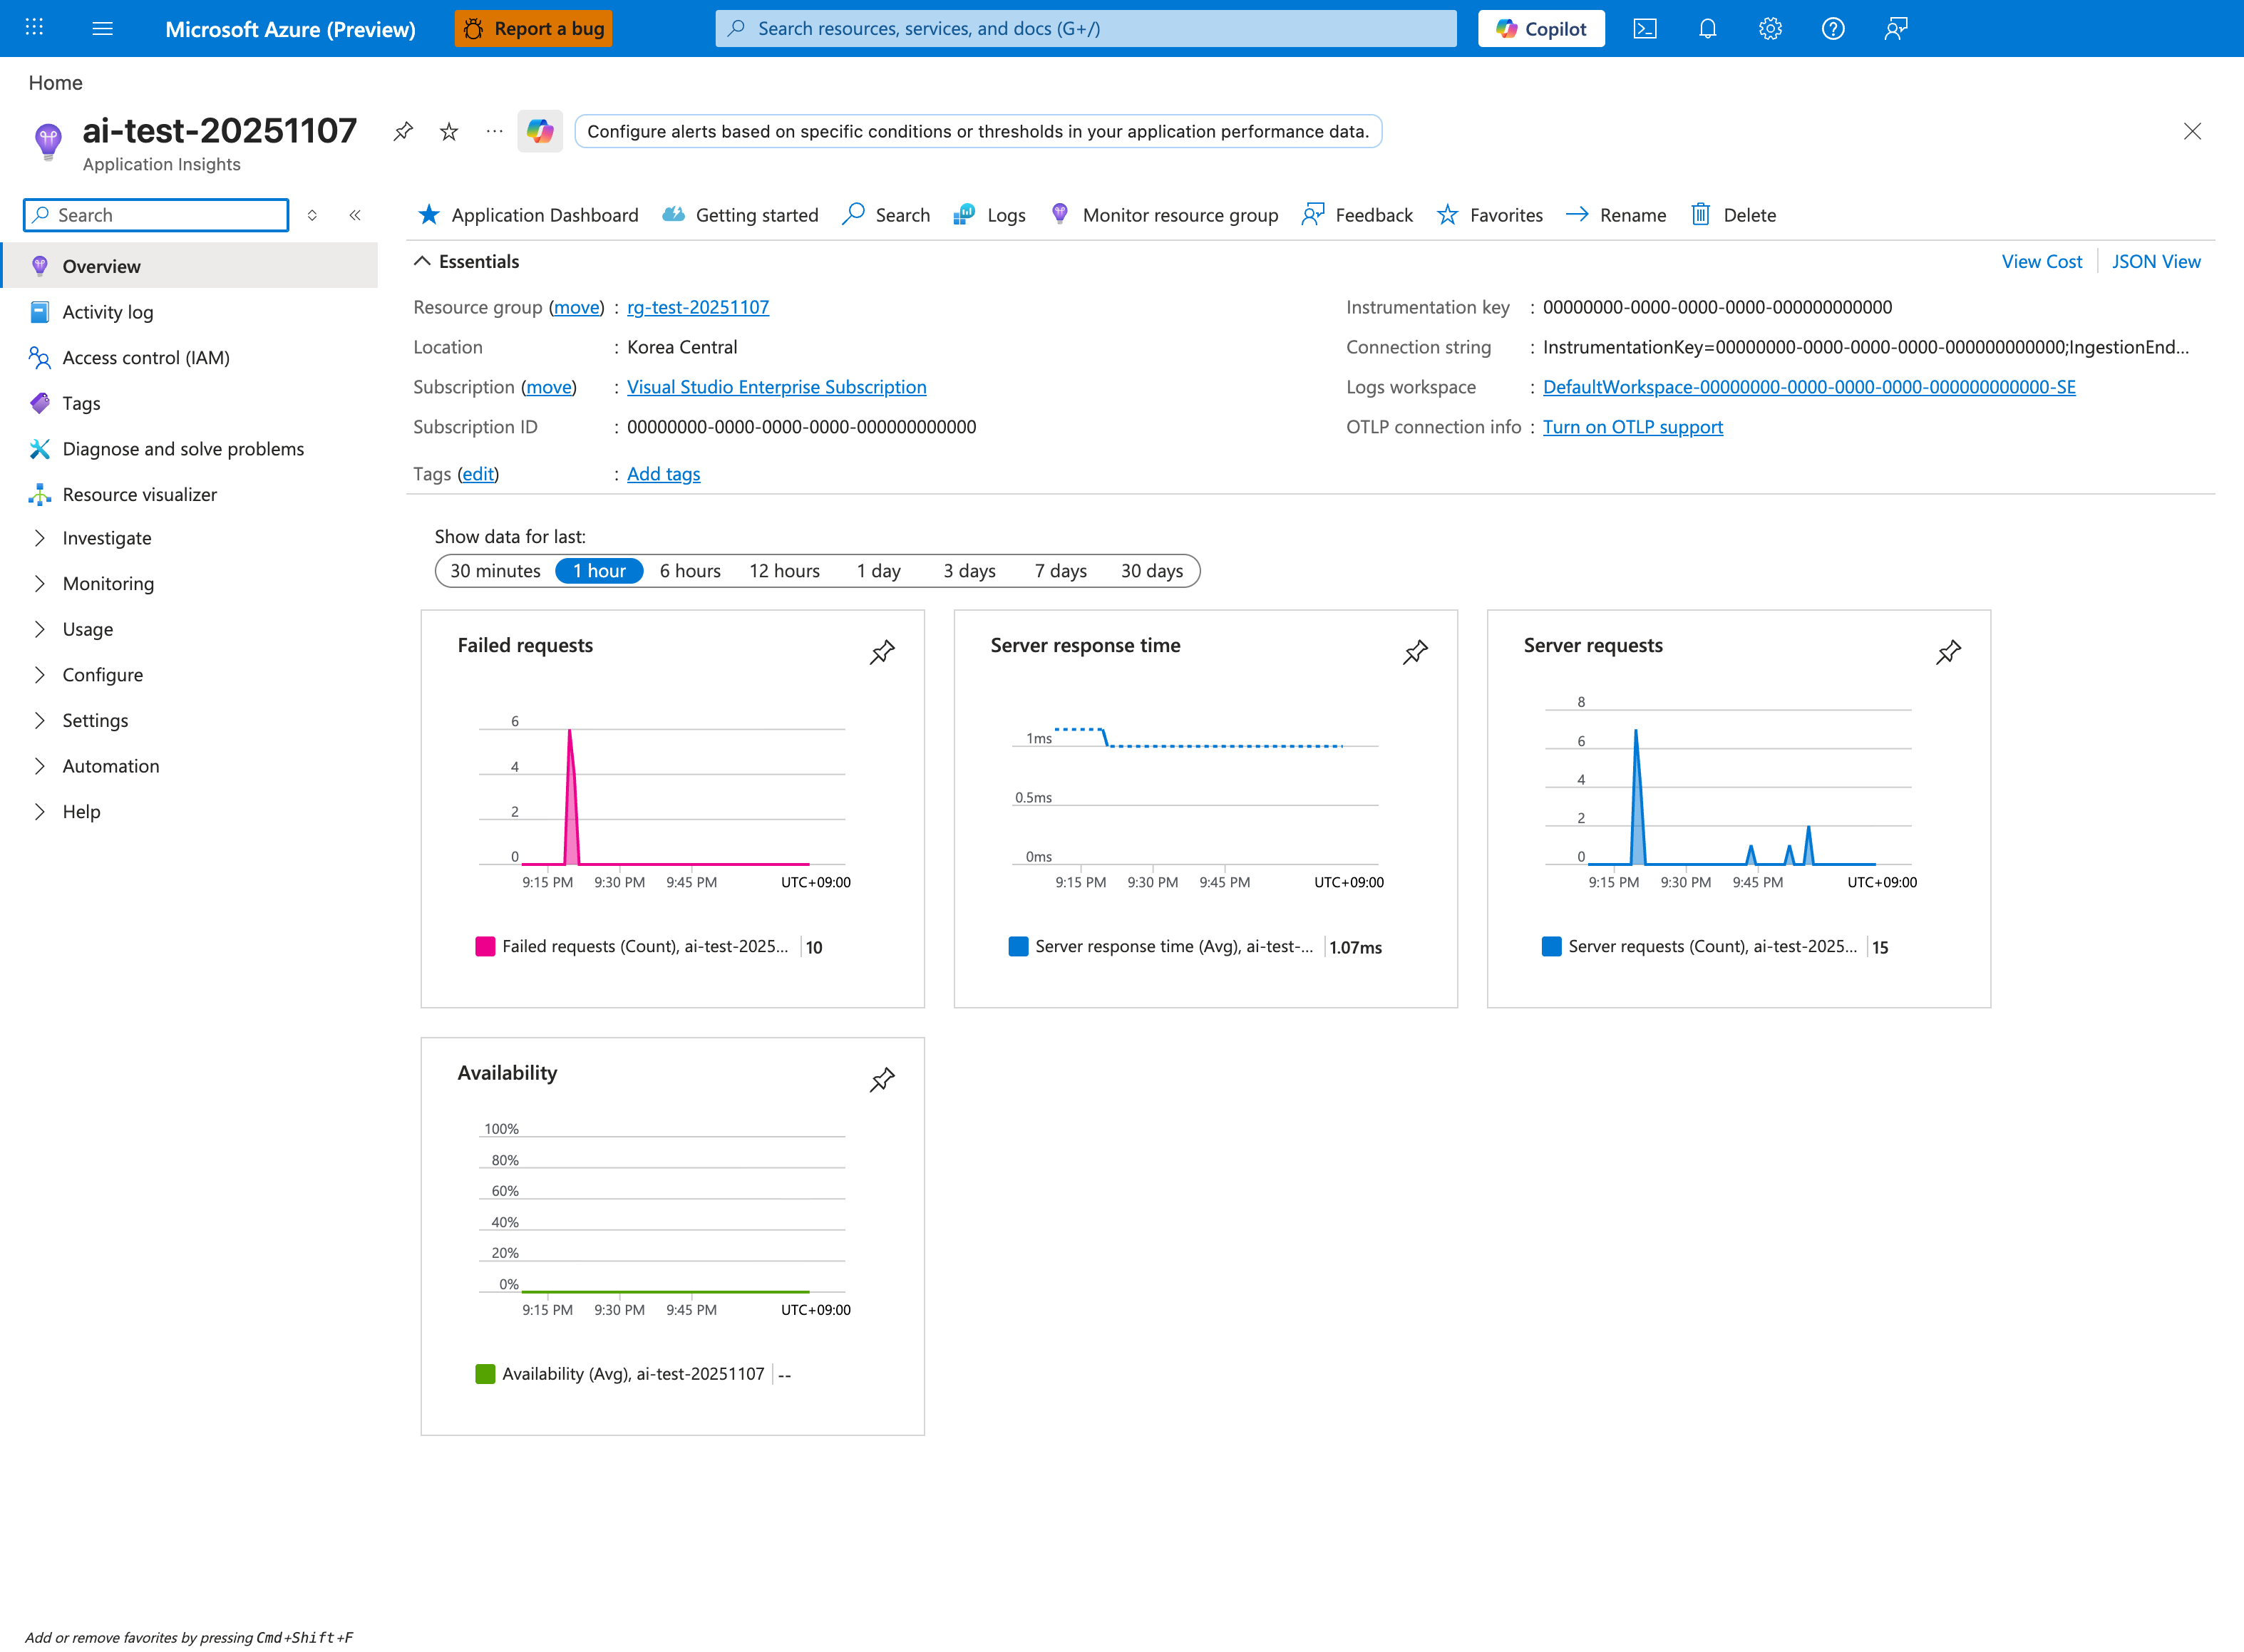
The Application Insights Overview is the right starting point when the question is "is a dependency slow?" because Server response time is the primary signal — values much greater than the historical baseline indicate downstream latency. Pair this with Failed requests to distinguish slow-but-succeeding calls from outright dependency failures. The Logs button in the command bar opens the same KQL editor used by the query below, but you should also check Application Dashboard for the curated dependency view. The 1 hour window is the right scope for active incidents; widen to 1 day to see whether the latency pattern is recurring (e.g., scheduled batch jobs or noisy neighbors). Note Logs workspace shows this is a workspace-based Application Insights resource — required for AppDependencies and AppRequests tables in the KQL below.
CLI
KQL
AppServiceAppLogs
| where TimeGenerated > ago(6h)
| where ResultDescription has_any ("timeout", "dependency", "upstream", "database", "redis", "key vault")
| summarize hits=count() by bin(TimeGenerated, 5m)
| order by TimeGenerated asc
5) Was DNS failing?
CLI
Inside the session, run:
KQL
AppServiceConsoleLogs
| where TimeGenerated > ago(6h)
| where ResultDescription has_any ("Name or service not known", "Temporary failure in name resolution", "getaddrinfo", "DNS")
| project TimeGenerated, ResultDescription
| order by TimeGenerated desc
6) Was scale involved?
Portal view: Metrics blade empty state with metric selector
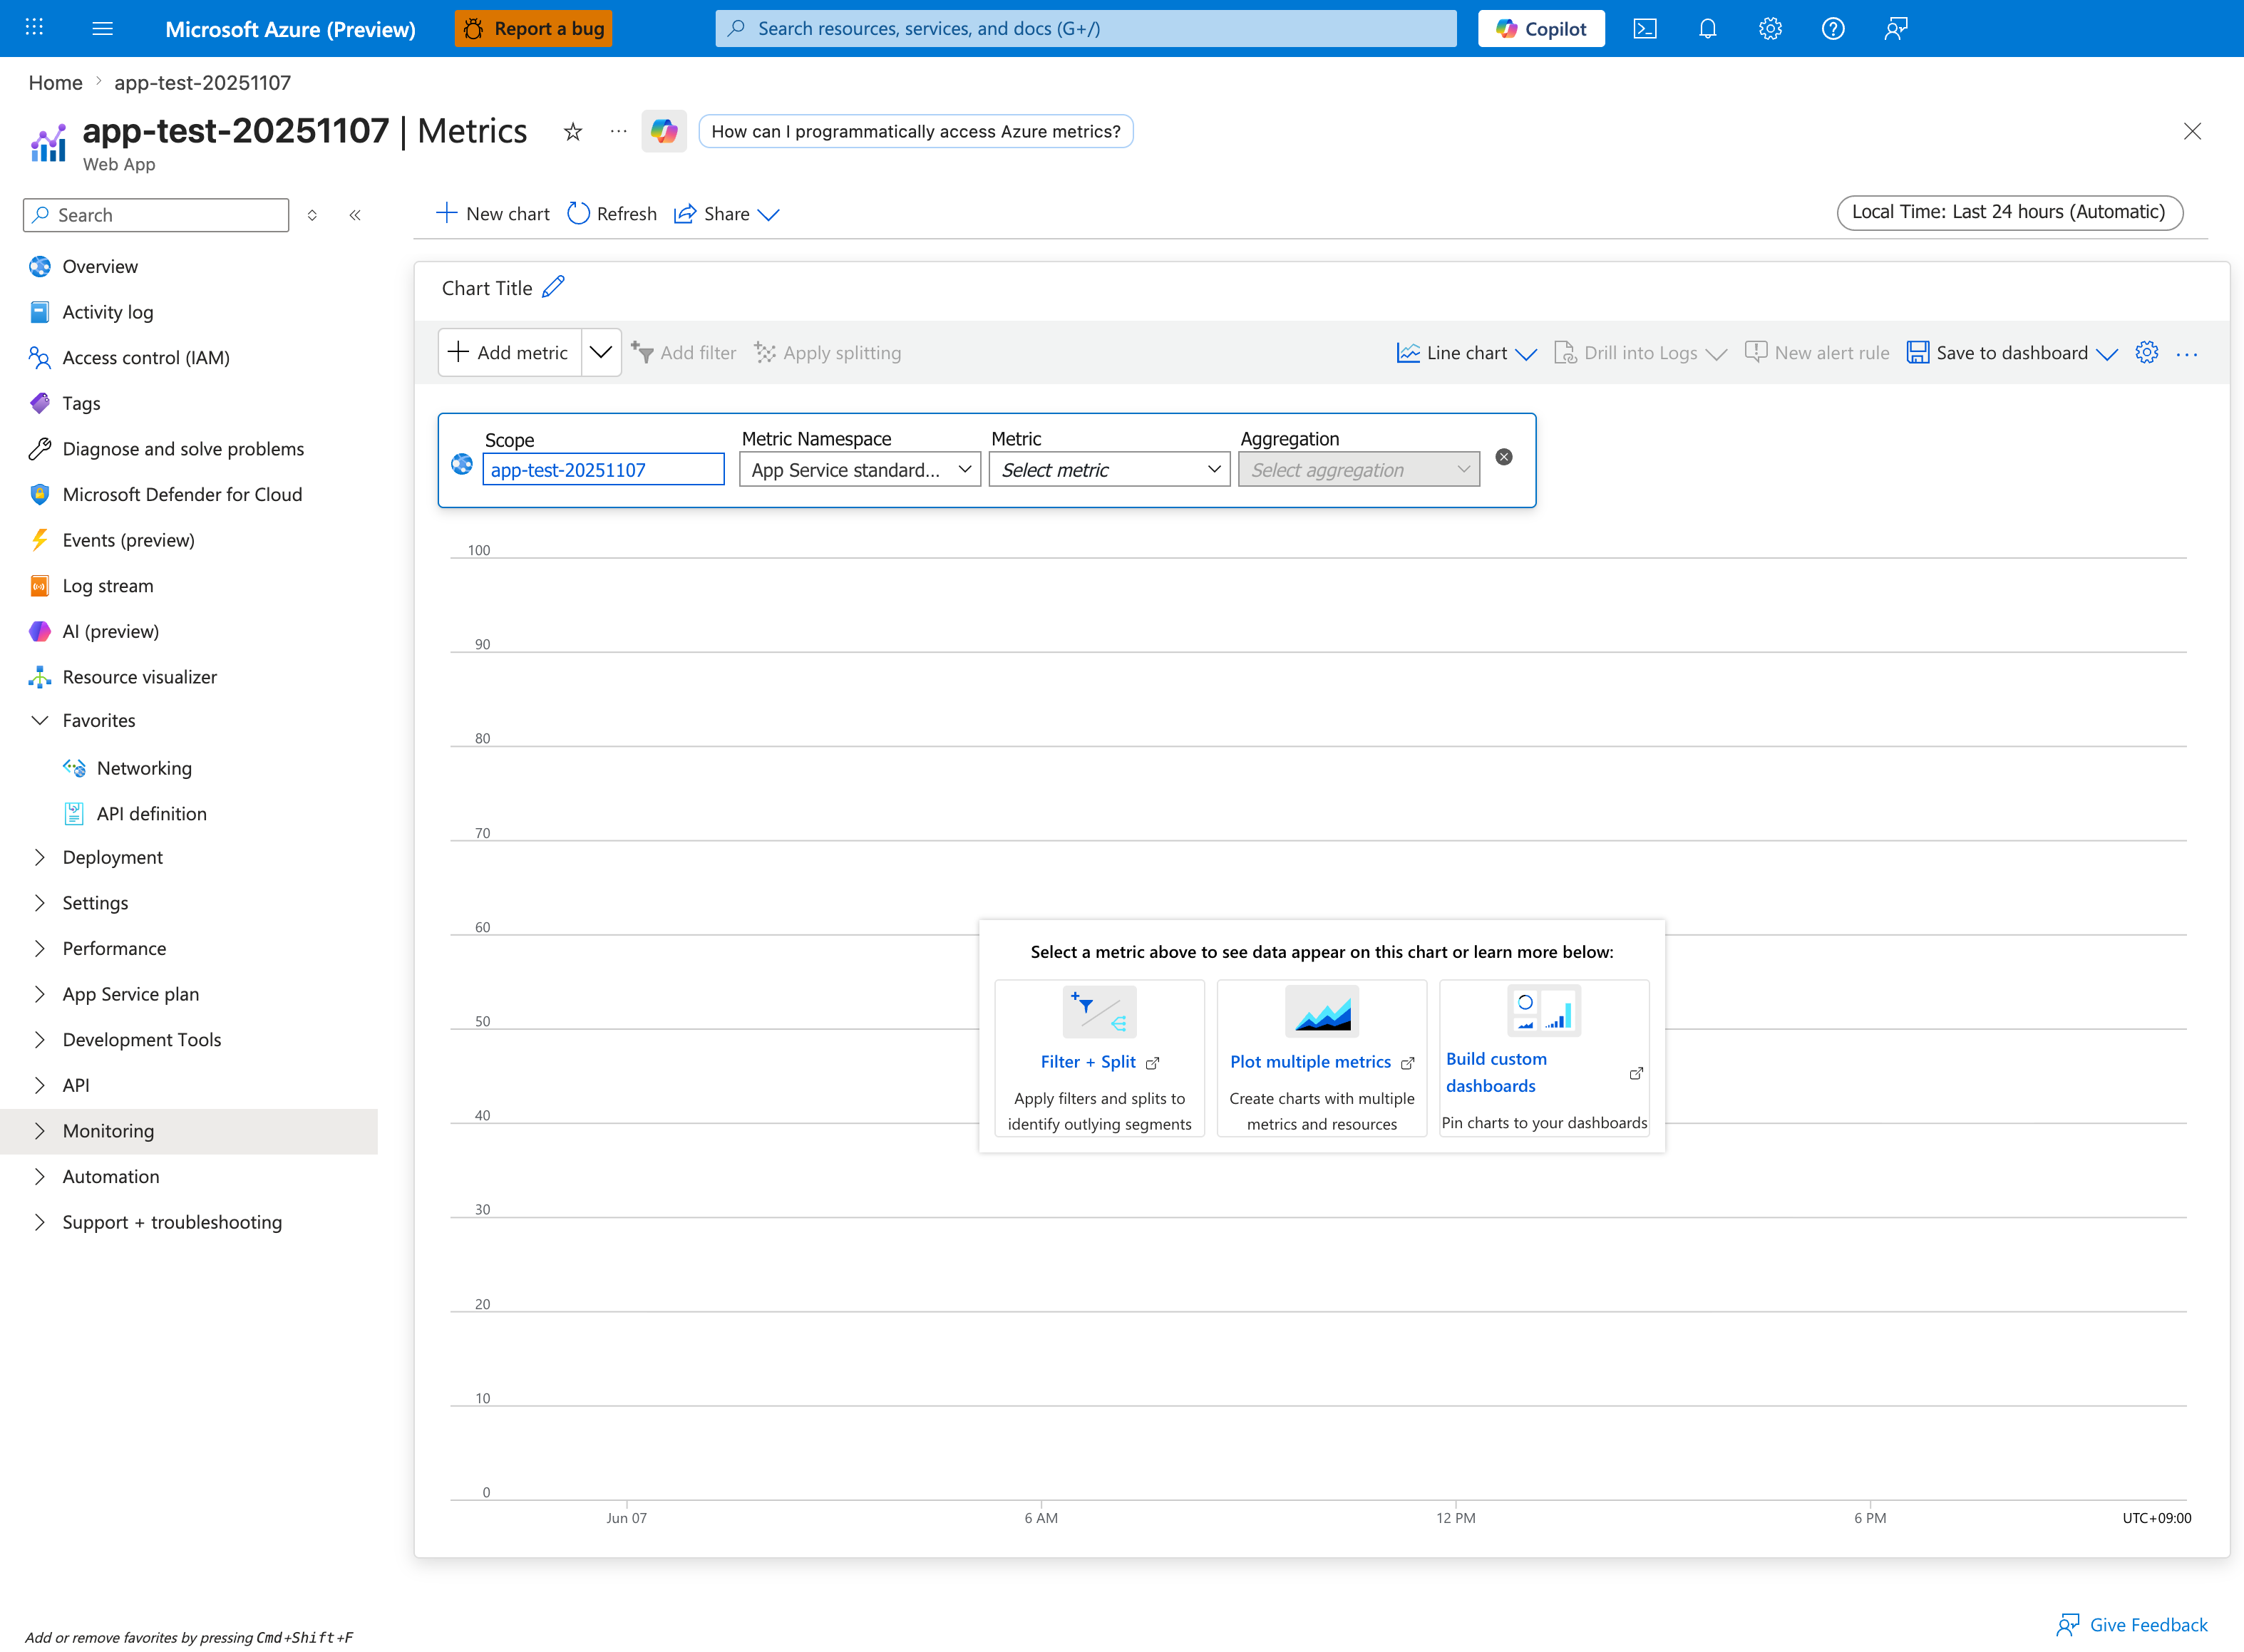
The Metrics blade is the visual companion to the az monitor metrics list CLI command below. The required fields are the same: Scope (the App Service resource), Metric Namespace (App Service standard metrics), Metric (e.g., CpuPercentage, MemoryWorkingSet, Http5xx), and Aggregation (Avg, Max, Sum, Count). For "was scale involved?" the canonical chart pairs CpuPercentage Max with Requests Sum over the same window — a Cpu spike that precedes a Requests drop indicates autoscale lag, while spikes that align indicate normal capacity tracking. Use Apply splitting to split a single metric by Instance to see whether one worker is hot — a critical signal for diagnosing noisy-neighbor or sticky-session imbalance. The Drill into Logs button is the bridge from the chart to the matching KQL query.
CLI
az monitor metrics list --resource <app-resource-id> --metric "CpuPercentage,MemoryWorkingSet,Http5xx,AverageResponseTime" --interval PT1M
KQL
AppServicePlatformLogs
| where TimeGenerated > ago(24h)
| where ResultDescription has_any ("scale", "instance", "restart", "recycle")
| project TimeGenerated, OperationName, ResultDescription
| order by TimeGenerated asc
7) Was disk full?
CLI
Use SSH to confirm with:
KQL
AppServiceConsoleLogs
| where TimeGenerated > ago(24h)
| where ResultDescription has_any ("No space left on device", "ENOSPC", "disk full")
| project TimeGenerated, ResultDescription
| order by TimeGenerated desc
8) Was memory exhausted?
CLI
KQL
AppServicePlatformLogs
| where TimeGenerated > ago(24h)
| where ResultDescription has_any ("OOM", "killed", "memory", "SIGKILL")
| project TimeGenerated, OperationName, ResultDescription, Host
| order by TimeGenerated desc
9) Was SNAT exhausted?
CLI
az monitor metrics list --resource <app-resource-id> --metric "Http5xx,Requests,AverageResponseTime" --interval PT1M
KQL
AppServiceConsoleLogs
| where TimeGenerated > ago(6h)
| where ResultDescription has_any ("connect timed out", "ReadTimeout", "ConnectTimeout", "socket", "ECONNRESET")
| summarize errors=count() by bin(TimeGenerated, 5m)
| order by TimeGenerated asc
10) Was there a deployment?
Portal view: Activity log blade for the Web App
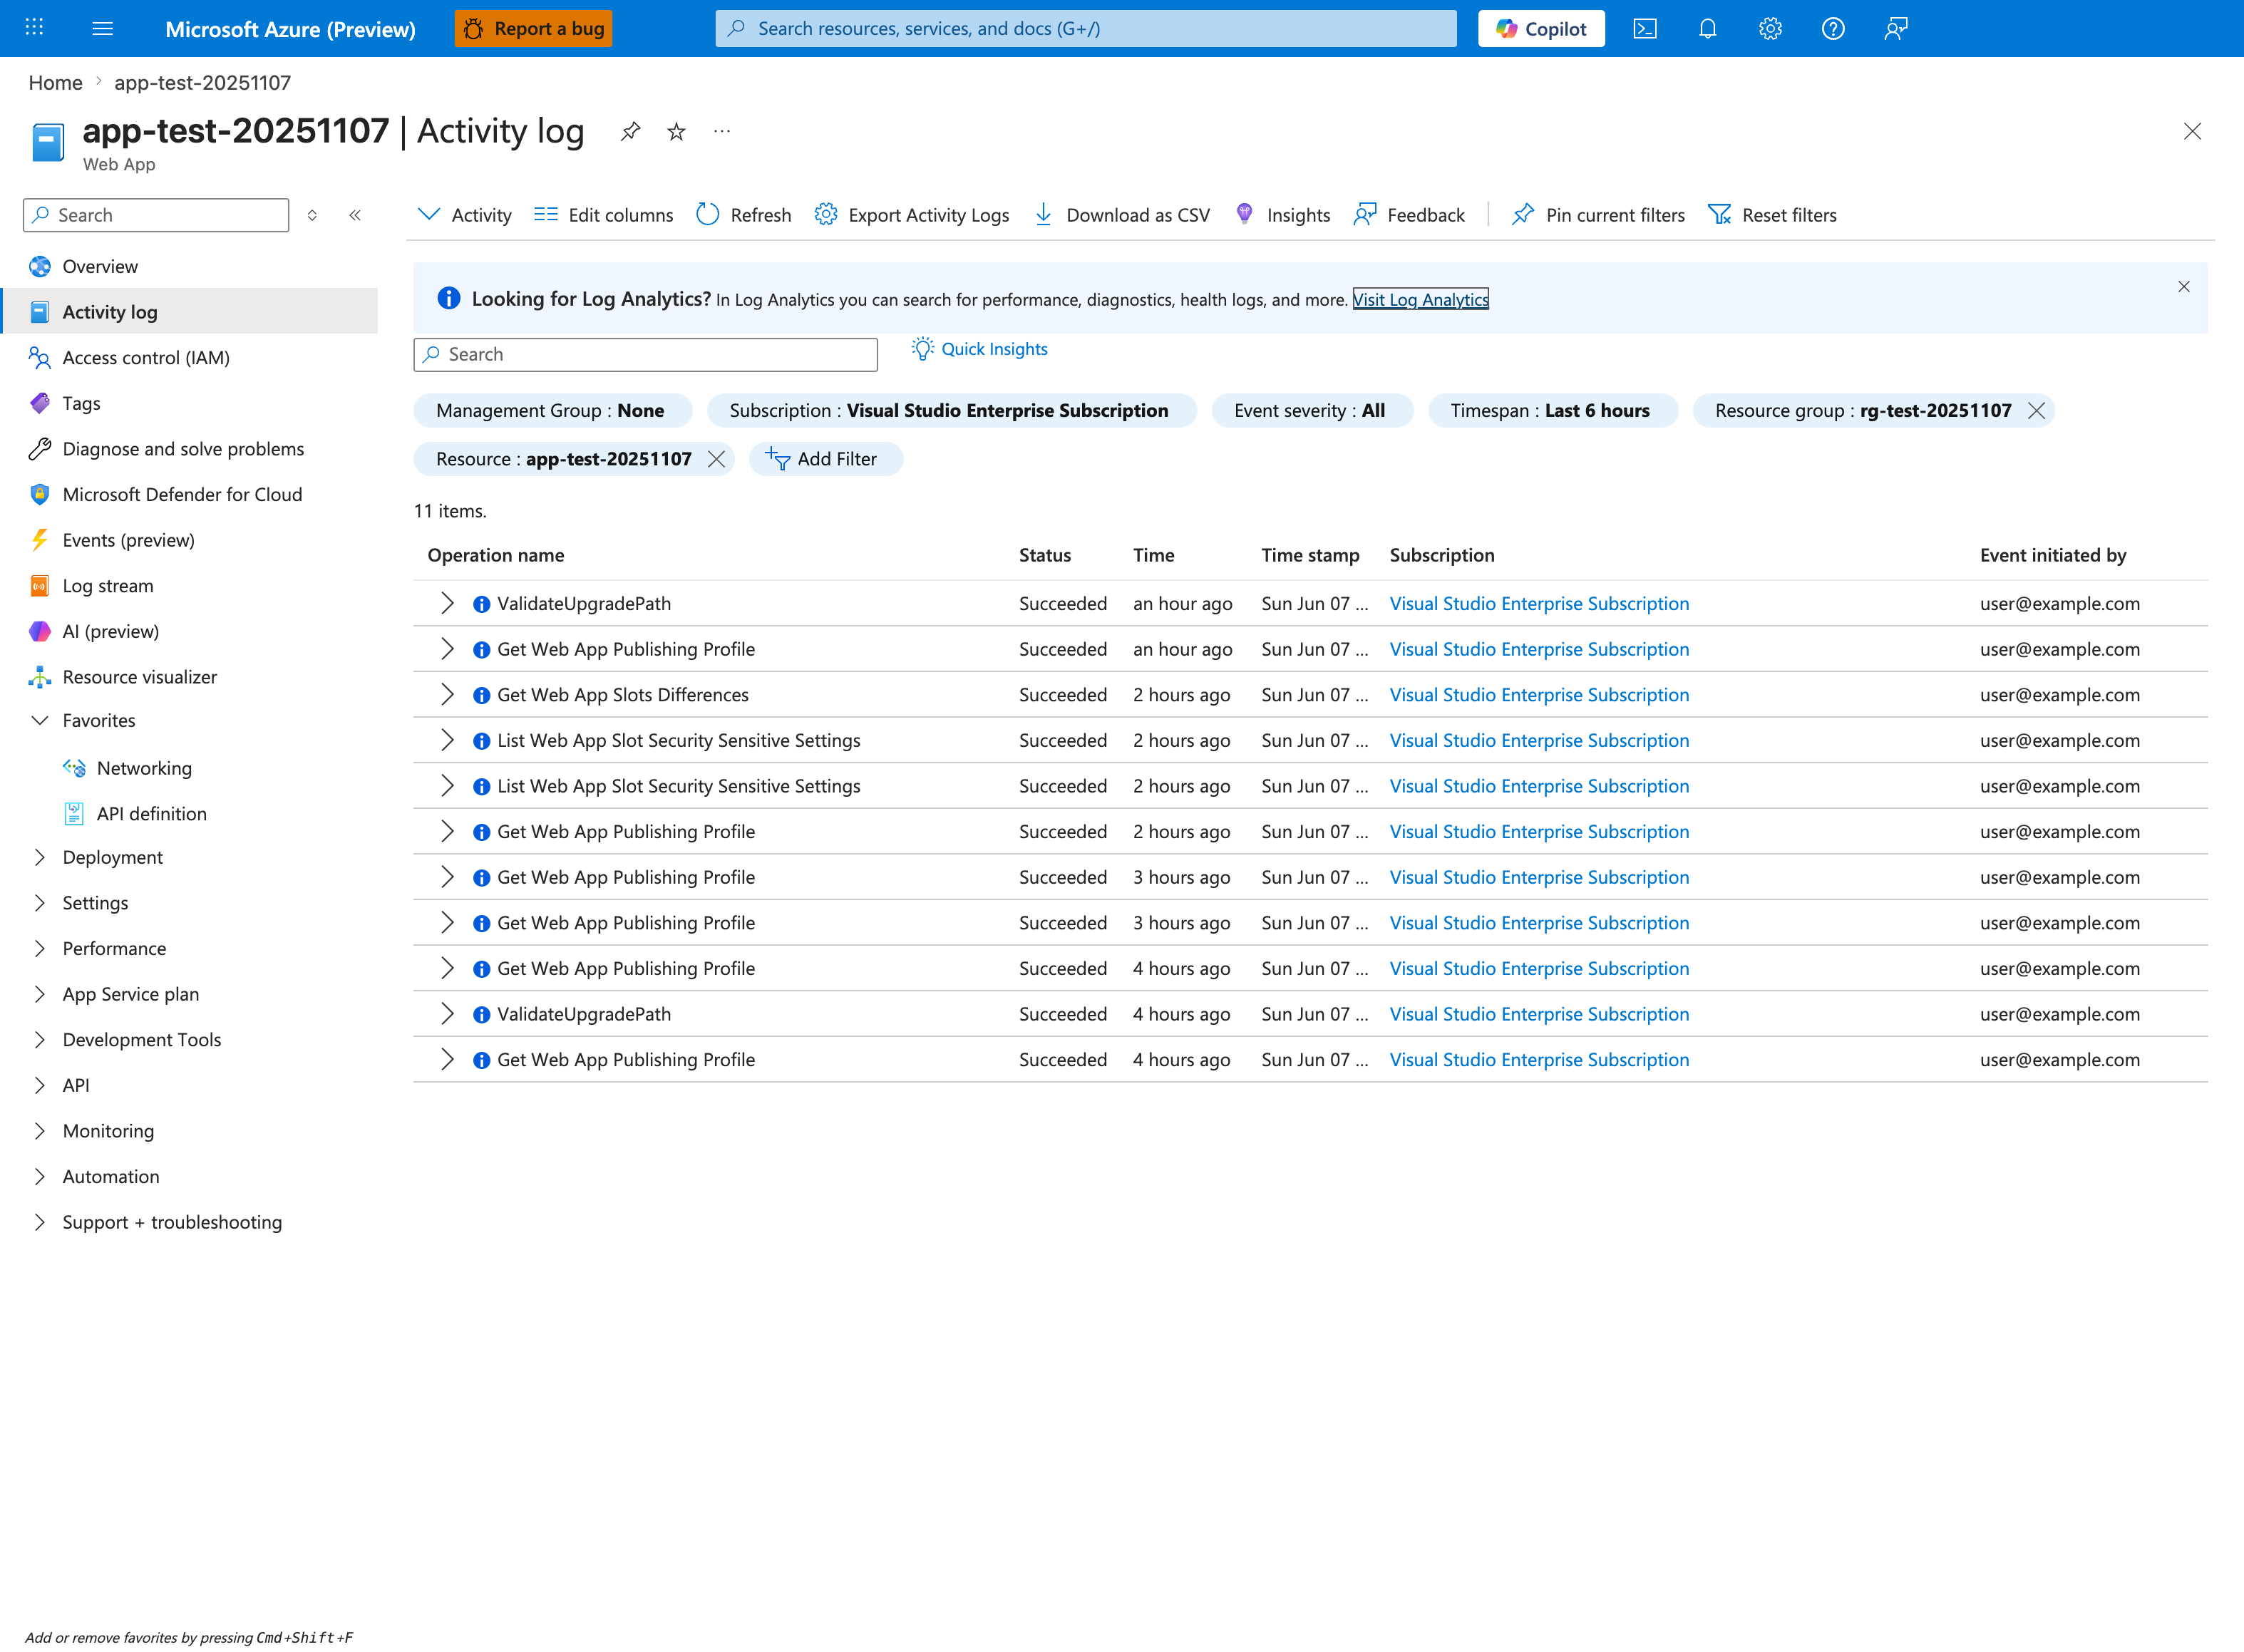
The Activity log is the authoritative record of every control-plane operation against this Web App — deployments, configuration changes, slot swaps, and scale operations all appear as discrete Operation name entries with the initiating principal. For "was there a deployment?" the operations to grep are Microsoft.Web/sites/publish/Action, Update Site, Update Configuration, and Update App Settings. The Event initiated by column distinguishes user-driven deployments from automated CI/CD service principals — critical for separating intentional deploys from third-party automation. The Timespan: Last 6 hours chip should match the incident window; the Add Filter button lets you scope further by operation name. Use Export Activity Logs to set up continuous export to Log Analytics so the same data is available as the KQL query below.
CLI
KQL
AppServicePlatformLogs
| where TimeGenerated > ago(24h)
| where OperationName has_any ("Deploy", "Publish", "SiteConfig", "Container")
| project TimeGenerated, OperationName, ResultDescription
| order by TimeGenerated desc
11) Was health check failing?
CLI
KQL
AppServicePlatformLogs
| where TimeGenerated > ago(24h)
| where ResultDescription has_any ("health check", "unhealthy", "warmup", "probe")
| project TimeGenerated, OperationName, ResultDescription, Host
| order by TimeGenerated desc
12) Was slot swap involved?
CLI
KQL
AppServicePlatformLogs
| where TimeGenerated > ago(24h)
| where ResultDescription has_any ("swap", "slot", "warm-up", "warmed up")
| project TimeGenerated, OperationName, ResultDescription
| order by TimeGenerated desc
13) Was there a config change?
CLI
az webapp config appsettings list --resource-group <resource-group> --name <app-name>
az monitor activity-log list --resource-group <resource-group> --offset 24h
KQL
AppServicePlatformLogs
| where TimeGenerated > ago(24h)
| where OperationName has_any ("Update Site", "Update App Settings", "Update Configuration")
| project TimeGenerated, OperationName, ResultDescription
| order by TimeGenerated desc
14) Was the container killed?
CLI
KQL
AppServicePlatformLogs
| where TimeGenerated > ago(24h)
| where ResultDescription has_any ("killed", "SIGKILL", "exit code", "container stopped", "OOM")
| project TimeGenerated, OperationName, ResultDescription, Host
| order by TimeGenerated desc
15) Were there network errors?
CLI
KQL
AppServiceConsoleLogs
| where TimeGenerated > ago(6h)
| where ResultDescription has_any ("connection refused", "connection reset", "ENETUNREACH", "EHOSTUNREACH", "timed out")
| project TimeGenerated, ResultDescription
| order by TimeGenerated desc
16) Did warm-up fail during slot swap?
CLI
KQL
AppServicePlatformLogs
| where TimeGenerated > ago(6h)
| where ResultDescription has_any ("swap", "warm-up", "did not respond", "health check")
| project TimeGenerated, OperationName, ResultDescription
| order by TimeGenerated desc
Evidence Quality Checklist
- Keep all evidence in one incident time window.
- Correlate HTTP, console, and platform signals before selecting a root cause.
- Preserve query text used during the incident for post-incident review.
- Capture command outputs in ticket notes with sensitive identifiers removed.
See Also
- Troubleshooting Method
- Detector Map
- Architecture Overview
- Decision Tree
- Troubleshooting Mental Model
- 5xx Trend Over Time
- Restart Timing Correlation
- Startup Errors