Troubleshooting Architecture Overview
This page answers one practical question first: where can this fail?
Before deep debugging, map the symptom to a platform segment (Front End, Worker, app container, outbound path, or deployment pipeline). That classification tells you which logs to query first and which playbook to open.
Why this page exists
Playbooks are symptom-driven and detailed. During active incidents, engineers usually need one faster artifact:
- A request-path view with failure points
- A runtime model that explains timeout, OOM, and recycle behavior
- A deployment path showing where startup and config drift failures happen
- A network path showing DNS/SNAT/private routing issues
Use this architecture map to route quickly to the right playbook.
1) Request Path Architecture (where 5xx can originate)
flowchart TD
    A[Client Browser or API Caller] --> B[Azure App Service Front End]
    B --> C[Worker VM Instance]
    C --> D[App Container or Runtime Process]
    D --> E[Application Handler]
    E --> F[Response]

    B -. FP-REQ-01 .-> B1[Failure Point: FE gateway or routing issue]
    C -. FP-REQ-02 .-> C1[Failure Point: worker unhealthy or recycled]
    D -. FP-REQ-03 .-> D1[Failure Point: container crash or startup loop]
    E -. FP-REQ-04 .-> E1[Failure Point: unhandled exception or timeout]
Typical interpretation
- HTTP 5xx is not one thing.
- A 5xx can originate at Front End, Worker, Container startup, or app code.
- Treat each layer as a competing hypothesis until logs disprove it.
Request-path failure points and playbooks
| Failure Point | Typical Symptom | First Evidence | Playbook |
|---|---|---|---|
| FP-REQ-01 Front End | 502/503 bursts, request forwarding issues | AppServicePlatformLogs + HTTP status trend | Failed to Forward Request |
| FP-REQ-02 Worker | Intermittent 5xx during load, restart overlap | restart timing, platform recycle events | Intermittent 5xx Under Load |
| FP-REQ-03 Container | app marked up/down, ping failures, cold start failures | console startup logs + health probe messages | Container Didn't Respond to HTTP Pings |
| FP-REQ-04 Application code | 500 with stack traces or long latency before error | app/console logs + endpoint-level HTTP logs | Slow Response but Low CPU |
2) Runtime / Worker Model (memory pressure, SIGKILL, timeout)
flowchart TD
    A[Worker Instance] --> B[Runtime Process Manager]
    B --> C[App Worker Processes]
    C --> D[Request Queue]
    D --> E[Dependency Calls]

    C --> F{Memory growth trend}
    F -->|steady growth| G[Pressure: GC churn and degraded latency]
    F -->|exceeds limit| H[SIGKILL or OOM kill]

    D --> I{Queue delay exceeds timeout}
    I -->|yes| J[Worker timeout and 5xx]
    I -->|no| K[Request completes]

    H --> L[Platform restart or process replacement]
    J --> M[Intermittent failures under burst]
Runtime failure mapping
| Failure Point | Why it happens | What to check first | Playbook |
|---|---|---|---|
| FP-RUN-01 Memory pressure | Memory leak, large object churn, excess workers | memory trend + console logs for kill/restart | Memory Pressure and Worker Degradation |
| FP-RUN-02 SIGKILL/OOM | process exceeded practical memory envelope | platform/console kill messages, restart cadence | Memory Pressure and Worker Degradation |
| FP-RUN-03 Worker timeout | backlog + slow dependencies + low worker throughput | high TimeTaken, timeout signatures | Intermittent 5xx Under Load |
| FP-RUN-04 Disk pressure impact | temp/log growth blocks runtime operations | No space left on device in console | No Space Left on Device |
3) Deployment Path (startup failures and config drift)
flowchart TD
    A[Code or image change] --> B[Deployment to slot]
    B --> C[Container start command executes]
    C --> D[Port binding and warm-up probes]
    D --> E[Health check evaluation]
    E --> F[Slot swap to production]

    C -. FP-DEP-01 .-> C1[Startup command mismatch]
    D -. FP-DEP-02 .-> D1[Port binding mismatch]
    E -. FP-DEP-03 .-> E1[Health check path failure]
    F -. FP-DEP-04 .-> F1[Slot swap drift or restart race]
Deployment path failure mapping
| Failure Point | Typical signal | Primary playbook |
|---|---|---|
| FP-DEP-01 Startup command mismatch | deployment green but app never healthy | Deployment Succeeded but Startup Failed |
| FP-DEP-02 Port mismatch | container runs but does not answer expected port | Container Didn't Respond to HTTP Pings |
| FP-DEP-03 Warm-up/health confusion | swap warm-up passes/fails unexpectedly | Warm-up vs Health Check |
| FP-DEP-04 Swap/config drift | slot swap introduces config regression | Slot Swap Config Drift |
4) Outbound / Network Path (SNAT, DNS, private routing)
flowchart TD
    A[App Worker] --> B[DNS Resolver Path]
    B --> C[Resolved target IP]
    C --> D[Outbound NAT/SNAT ports]
    D --> E[Internet or Private Endpoint]
    E --> F[Dependency Service]

    B -. FP-NET-01 .-> B1[DNS resolution failure]
    D -. FP-NET-02 .-> D1[SNAT port pressure]
    E -. FP-NET-03 .-> E1[Route or NSG mismatch]
    F -. FP-NET-04 .-> F1[Dependency timeout or refusal]
Outbound path failure mapping
| Failure Point | Symptom pattern | Primary playbook |
|---|---|---|
| FP-NET-01 DNS failure | intermittent/constant name lookup failures | DNS Resolution (VNet-Integrated) |
| FP-NET-02 SNAT pressure | connect timeout spikes under parallel outbound load | SNAT or Application Issue? |
| FP-NET-03 Private route confusion | endpoint unreachable despite private endpoint setup | Private Endpoint / Custom DNS Route Confusion |
| FP-NET-04 Dependency failures | outbound errors isolated to one backend service | SNAT or Application Issue? |
5) Observability Coverage Map
Portal view: Diagnose and solve problems as observability gateway
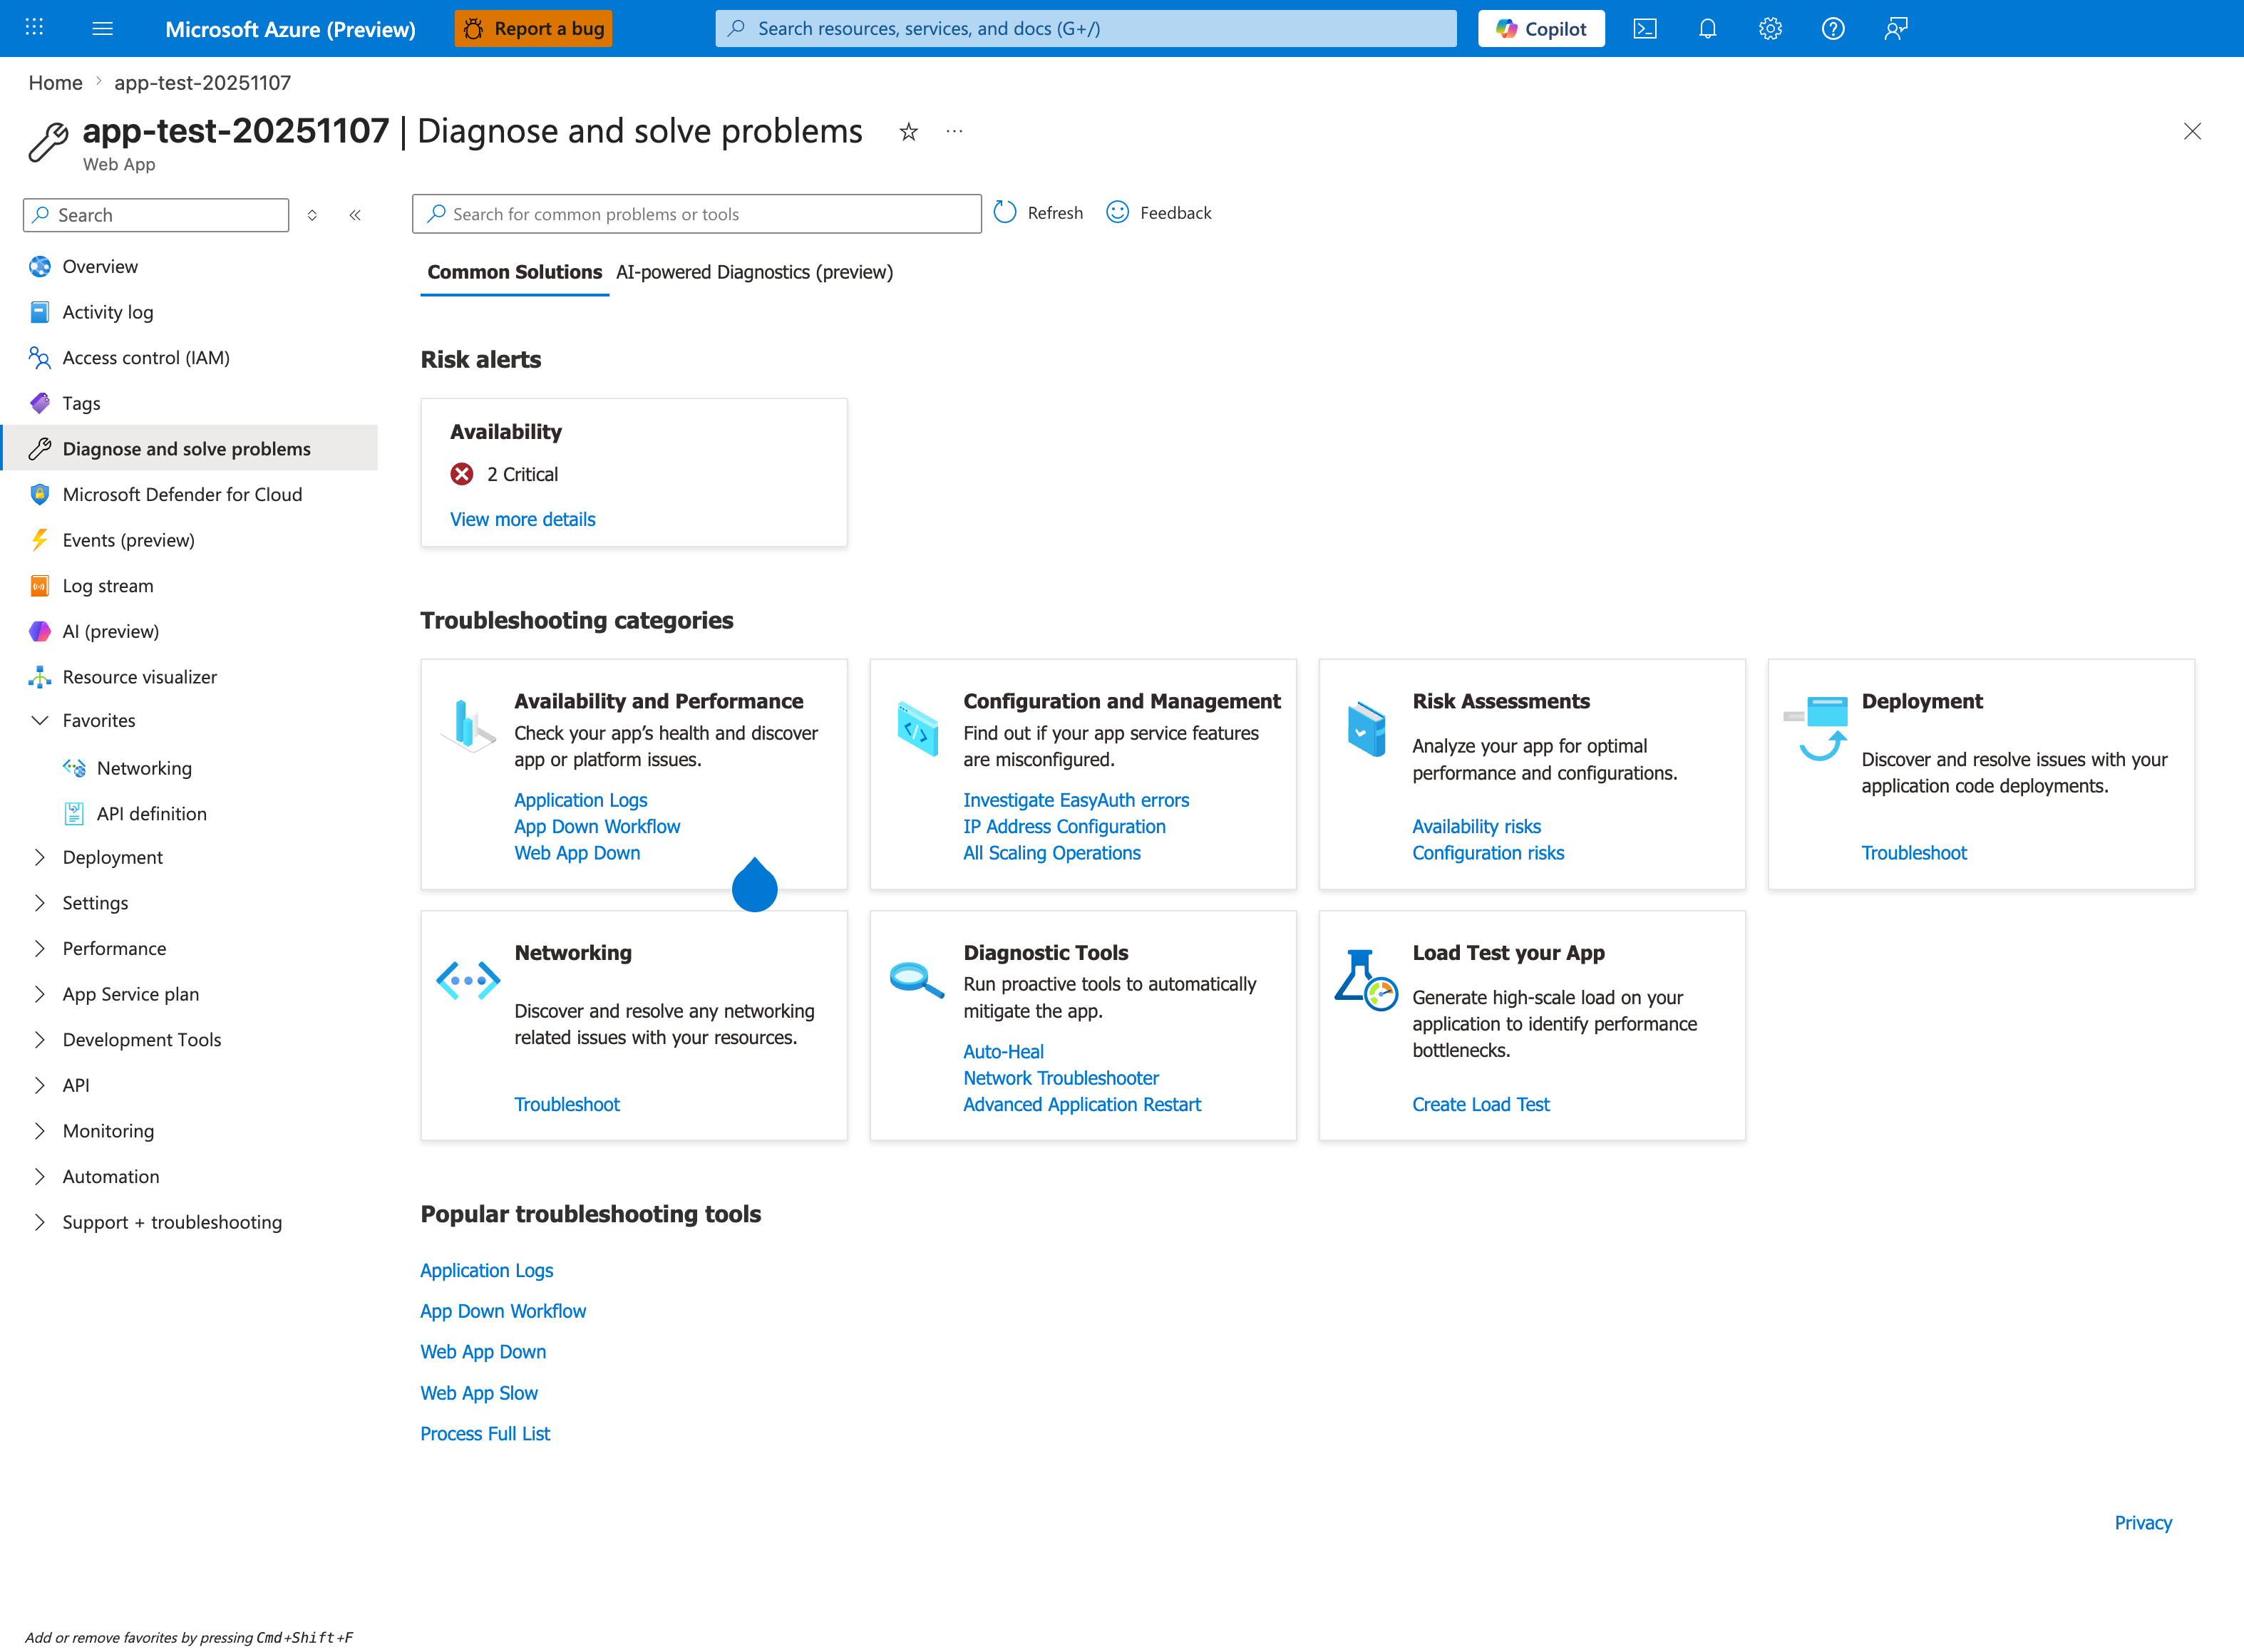
The Diagnose and solve problems blade is the Portal-side mirror of this observability coverage map and the fastest first stop during an active incident. Each Troubleshooting categories card maps to one or more components in the diagram below: Availability and Performance covers the Front End and worker lifecycle, Configuration and Management and Deployment cover Activity Log signals, Networking covers the outbound path, and Diagnostic Tools provides mitigation actions like Auto-Heal and Advanced Application Restart. The Risk alerts panel runs continuous health checks and surfaces critical issues before symptoms appear in your own monitoring — always check it before falling through to the manual KQL queries below.
flowchart TD
    A[Component] --> B[Best First Log Source]

    C[Front End and proxy path] --> D[AppServiceHTTPLogs + AppServicePlatformLogs]
    E[Worker lifecycle and recycle] --> F[AppServicePlatformLogs]
    G[Container startup and runtime stderr/stdout] --> H[AppServiceConsoleLogs]
    I[App-level business errors] --> J[AppServiceAppLogs or structured app logs]
    K[Deployment and config changes] --> L[Azure Activity Log]
    M[Dependency failures] --> N[App logs + HTTP log correlation]
Quick evidence commands by component
az webapp log show --resource-group <resource-group> --name <app-name>
az monitor activity-log list --resource-group <resource-group> --offset 24h
az monitor metrics list --resource <app-resource-id> --metric "Http5xx,Requests,AverageResponseTime,MemoryWorkingSet" --interval PT1M
az webapp config show --resource-group <resource-group> --name <app-name>
az webapp config appsettings list --resource-group <resource-group> --name <app-name>
Portal view: Log Analytics editor where the KQL queries below execute
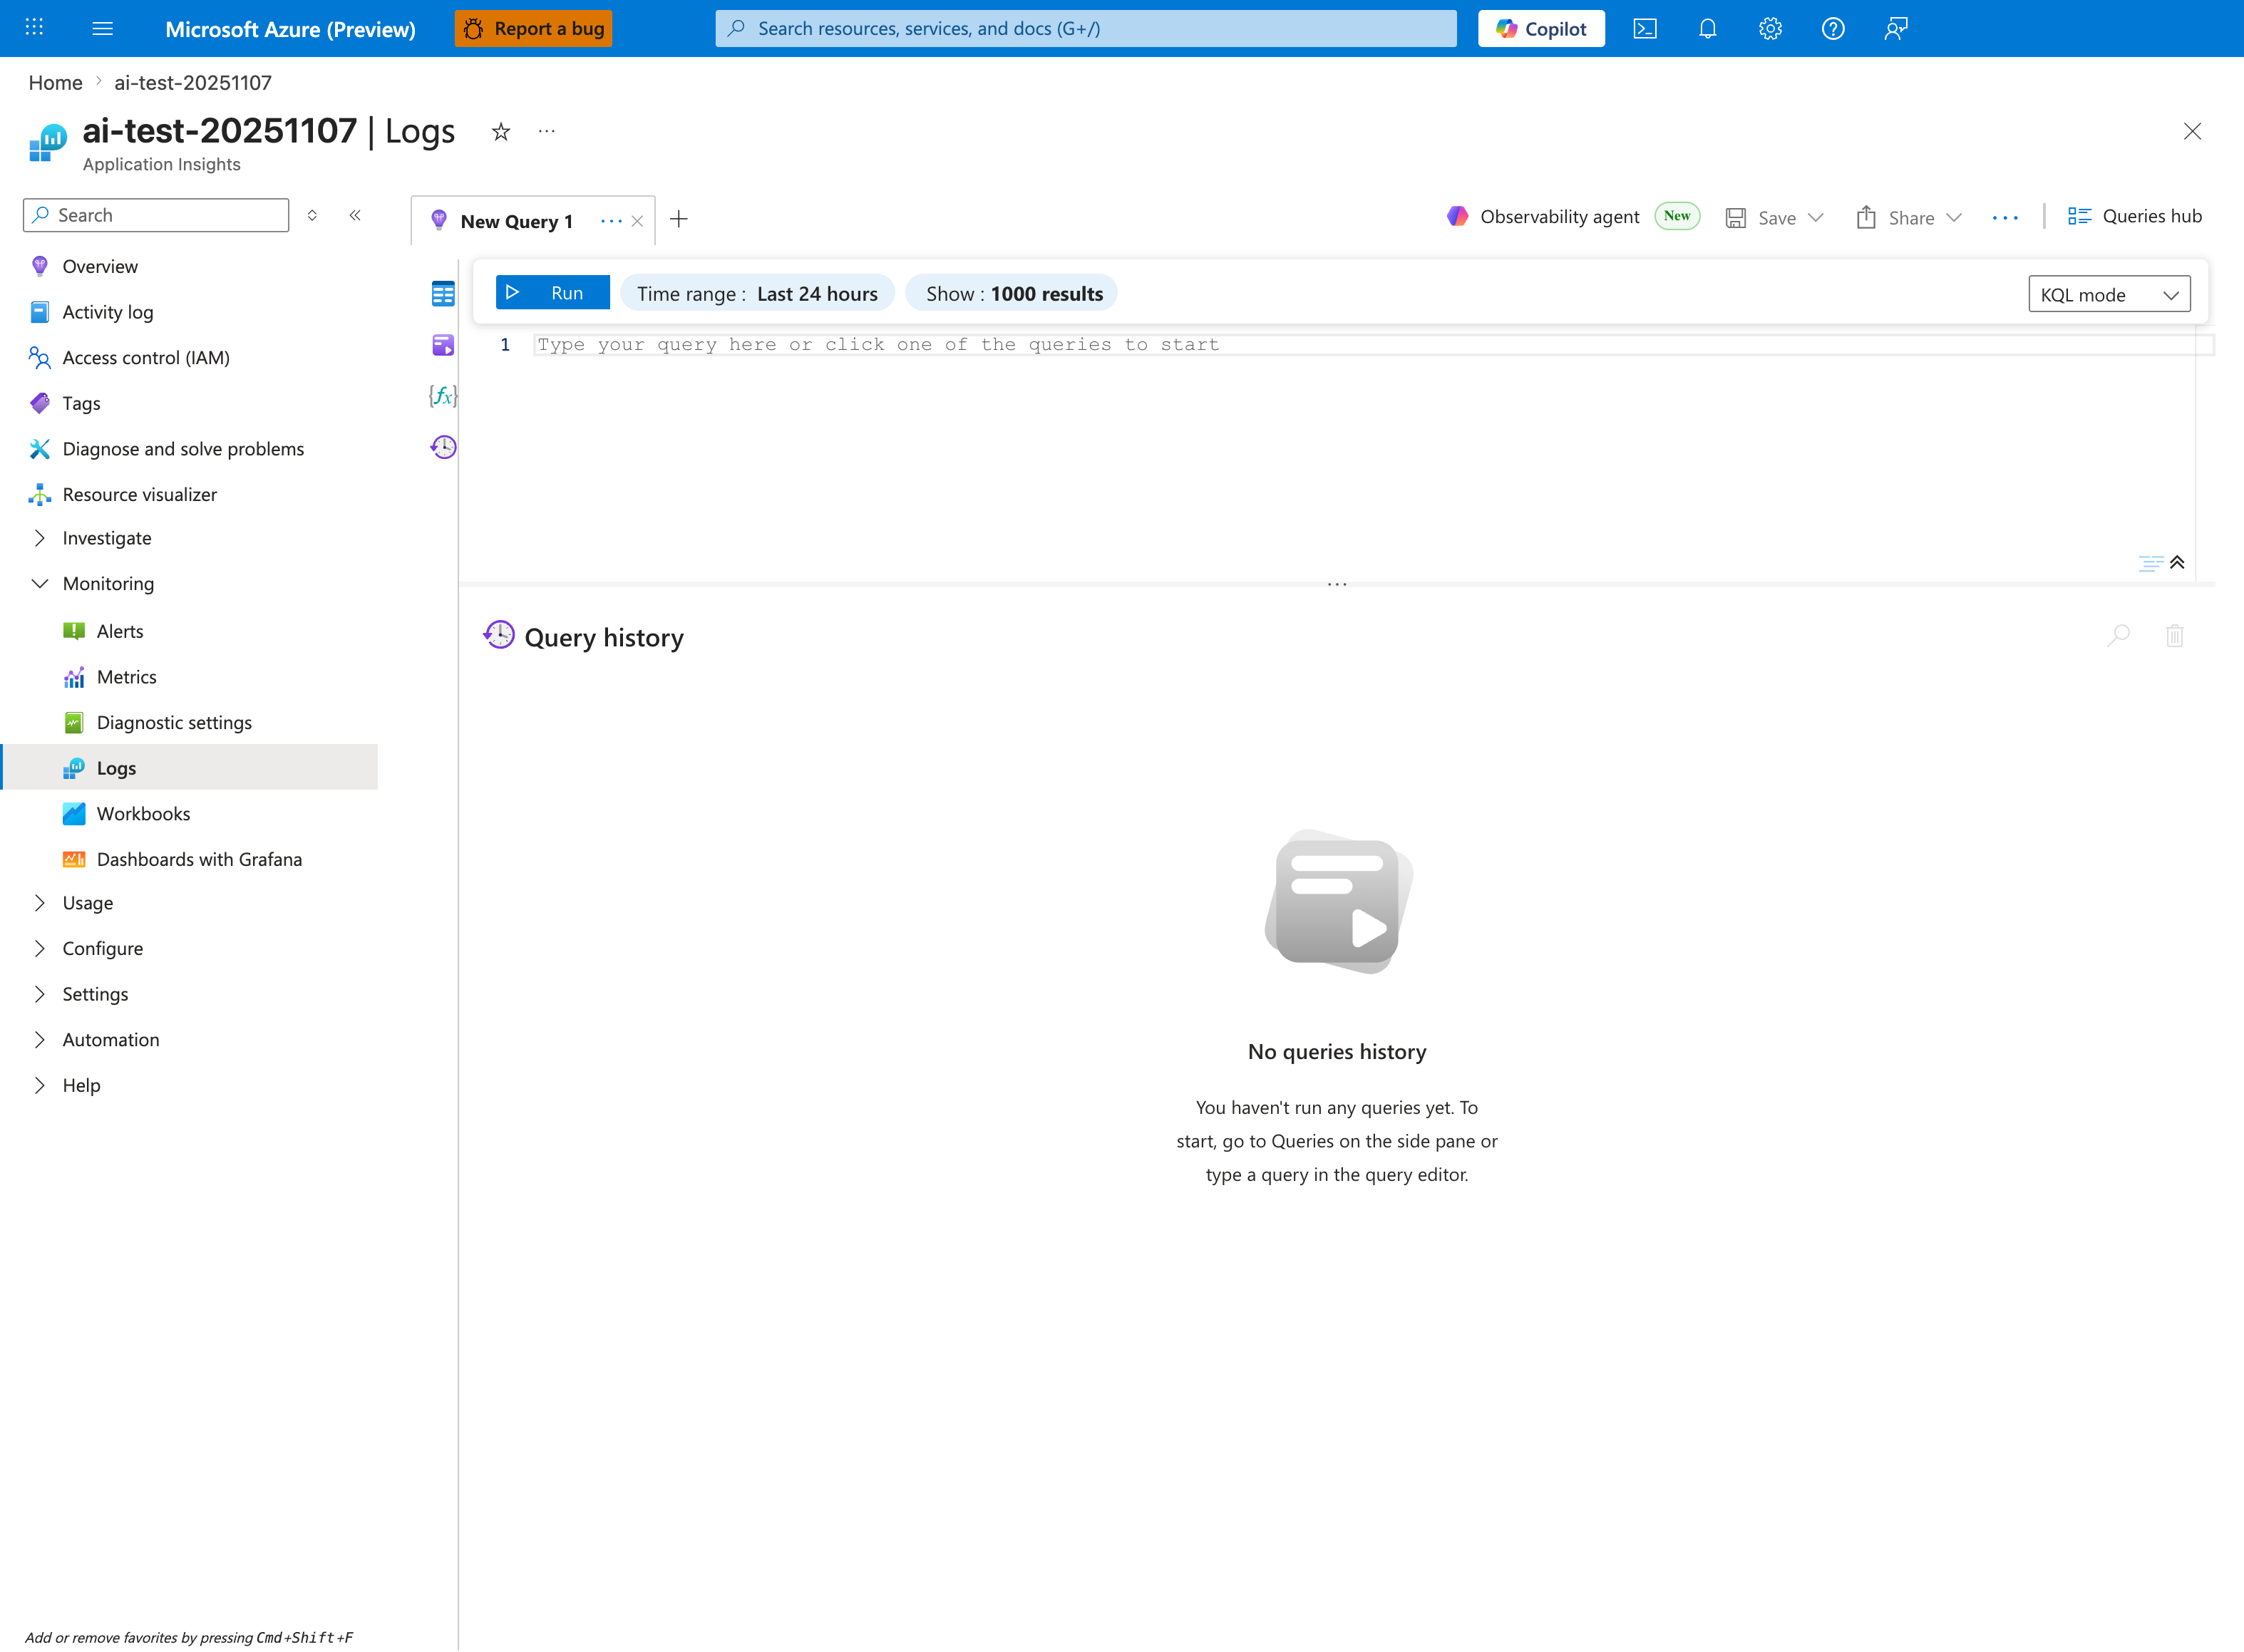
The KQL snippets below all execute in the Application Insights Logs editor shown here — accessible from the Logs button in any Application Insights or Log Analytics workspace. Before pasting a query, set the blade-level Time range to match the | where TimeGenerated > ago(...) clause in the query (default queries here use ago(2h), ago(6h), or ago(24h)). The KQL mode dropdown distinguishes raw Kusto from Simple mode; all three queries below require KQL mode. The empty Query history panel becomes the reproducibility artifact during real incidents — save important queries from this panel into the runbook for post-incident review.
AppServiceHTTPLogs
| where TimeGenerated > ago(2h)
| summarize total=count(), errors5xx=countif(ScStatus >= 500 and ScStatus < 600), p95=percentile(TimeTaken,95) by bin(TimeGenerated, 5m)
| order by TimeGenerated asc
AppServicePlatformLogs
| where TimeGenerated > ago(24h)
| where ResultDescription has_any ("restart", "recycle", "health", "container", "start", "stop")
| project TimeGenerated, OperationName, ResultDescription
| order by TimeGenerated desc
AppServiceConsoleLogs
| where TimeGenerated > ago(6h)
| where ResultDescription has_any ("Exception", "timed out", "No space left", "OOM", "killed", "could not bind")
| project TimeGenerated, ResultDescription
| order by TimeGenerated desc
6) Fast routing examples
- Example A: 5xx appears only during bursts.
- Start with runtime/worker model (FP-RUN-03), then outbound pressure (FP-NET-02). - Open: Intermittent 5xx Under Load and SNAT or Application Issue?.
- Example B: deployment says success, app unavailable.
- Start with deployment path (FP-DEP-01/02/03). - Open: Deployment Succeeded but Startup Failed and Container Didn't Respond to HTTP Pings.
- Example C: outbound calls fail but only for private endpoint targets.
- Start with outbound path (FP-NET-01/03). - Open: Private Endpoint / Custom DNS Route Confusion.
How to use this architecture page during incidents
Do not treat any single metric as proof. Use this page to identify the most likely failure layer, then validate with time-correlated evidence. Move to the linked playbook only after you identify which layer best matches the symptom timing.
See Also
- Troubleshooting Method
- Detector Map
- Checklists Index
- Playbooks Index
- KQL Query Library
- Evidence Map
- Decision Tree
- Troubleshooting Mental Model