App Service OSS Troubleshooting
A hypothesis-driven troubleshooting guide for Azure App Service OSS workloads.
What This Is
A practical field guide for troubleshooting real-world issues on Azure App Service Linux.
This is not a general Azure tutorial. It is designed to help engineers move from symptom to validated interpretation faster.
How It Works
graph TD
    A[Observe Symptom] --> B[List Hypotheses]
    B --> C[Collect Evidence]
    C --> D[Validate / Disprove]
    D --> E[Identify Root Cause]
    E --> F[Mitigate]
Every playbook follows this flow:
- Start from the symptom — what the engineer actually observes
- List competing hypotheses — multiple plausible causes
- Collect evidence — metrics, logs, detectors, configuration
- Validate or disprove each hypothesis with specific signals
- Identify the most likely root cause pattern
- Apply mitigations — immediate and long-term
Start Here
| Your Situation | Go To |
|---|---|
| First incident, no idea where to start | Architecture Overview |
| Need to identify the failure category | Decision Tree |
| Want 60-second symptom-to-playbook cards | Quick Diagnosis Cards |
| Want to understand what evidence to collect | Evidence Map |
| Need a mental framework for diagnosis | Mental Model |
| Already know the symptom category | Jump to Playbooks below |
| Need KQL queries to investigate | KQL Query Library |
| Want hands-on practice | Labs below |
Quick Decision Tree
Use this to route to the right playbook in under 60 seconds:
graph TD
    A[Symptom Observed] --> B{App returns HTTP errors?}
    B -->|503 on all requests| C[Startup Failure]
    B -->|Intermittent 5xx| D[Performance / Load]
    B -->|200 but slow| E[Performance / Cold Start]
    B -->|No errors but wrong behavior| F[Config / Routing]

    C --> C1[Startup Probe Failed?]
    C1 -->|Yes, 0 console logs| C2[Wrong startup command → Deployment Succeeded Startup Failed]
    C1 -->|Yes, app listening on 127.0.0.1| C3[Wrong bind address → Failed to Forward Request]
    C1 -->|Yes, timeout on port| C4[Port mismatch → Container HTTP Pings]

    D --> D1{Outbound connections involved?}
    D1 -->|Yes, connection timeouts| D2[SNAT Exhaustion]
    D1 -->|No, sync worker blocking| D3[Intermittent 5xx Under Load]

    E --> E1{First request after deploy?}
    E1 -->|Yes| E2[Cold Start / Slow Start]
    E1 -->|No, always slow| E3[Memory Pressure or CPU]

    F --> F1{After slot swap?}
    F1 -->|Yes| F2[Slot Swap Config Drift]
    F1 -->|No, DNS/network| F3[DNS VNet Resolution]

    style C fill:#c62828,color:#fff
    style D fill:#ef6c00,color:#fff
    style E fill:#f9a825,color:#000
    style F fill:#1565c0,color:#fff
Hosting Mode: Where to Look First
Different hosting modes have different observation points. Use this table to prioritize your investigation:
| Symptom | Linux Code | Linux Container | Windows Code |
|---|---|---|---|
| Startup fails | AppServiceConsoleLogs — Oryx build output, runtime startup | AppServiceConsoleLogs — Docker logs, ENTRYPOINT/CMD output | Application Event Logs, WEBSITE_RUN_FROM_PACKAGE extraction |
| Wrong port/binding | Check --bind in startup command (Gunicorn, etc.) | Check WEBSITES_PORT, PORT env var, EXPOSE in Dockerfile | Typically auto-configured; check web.config for IIS settings |
| Missing dependencies | Oryx build logs, requirements.txt / package.json | Image build logs; dependencies baked into image | NuGet restore logs, MSBuild output |
| Slow cold start | Module import time, lazy loading patterns | Image pull time (check image size), container init | Assembly loading, JIT compilation |
| Memory pressure | MemoryWorkingSet metric, OOM in platform logs | MemoryWorkingSet, container memory limits | MemoryWorkingSet, w3wp process memory |
| Outbound timeouts | SNAT metrics, AppServiceConsoleLogs connection errors | Same as Linux Code | SNAT metrics, outbound connection tracking |
| Config drift after swap | App Settings sticky slot config | Same as Linux Code | web.config transforms, connection strings |
| Filesystem issues | /home (persistent) vs /tmp (ephemeral), df -h via SSH | Container filesystem (ephemeral by default), mounted volumes | D:\home (persistent) vs D:\local (ephemeral) |
Hosting Mode Detection
Use az webapp show --query "kind" to check hosting mode:
app,linux→ Linux Codeapp,linux,container→ Linux Containerapp→ Windows Code
Windows-Specific Gaps
This guide focuses on Linux workloads. Windows-specific playbooks (IIS configuration, web.config issues, Windows containers) are referenced but not exhaustively covered.
Representative Log Patterns
Quick reference for recognizing common failure signatures:
| Pattern | Indicates | Playbook |
|---|---|---|
503 + TimeTaken > 40000ms + 0 console logs | Startup failure — app never ran | Deployment Succeeded Startup Failed |
Console: Listening at: http://127.0.0.1:8000 | Wrong bind address | Failed to Forward Request |
499 + TimeTaken ~5000ms on /slow endpoints | Client timeout, sync worker blocking | Intermittent 5xx Under Load |
499 + TimeTaken ~30000ms on /outbound | SNAT exhaustion or outbound timeout | SNAT or Application Issue |
/resolve returns public IP for privatelink FQDN | DNS misconfiguration (Private DNS Zone not linked) | DNS Resolution VNet |
startup_duration > 30s in platform logs | Cold start / slow start | Slow Start / Cold Start |
/disk-status shows /tmp > 50% | Disk pressure | No Space Left on Device |
/config returns wrong environment values after swap | Slot swap config drift (sticky settings missing) | Slot Swap Config Drift |
Topics
Performance
- Slow Response but Low CPU
- Memory Pressure & Worker Degradation
- Intermittent 5xx Under Load
- No Space Left on Device
- Slow Start / Cold Start
- CORS and Token Errors
Outbound / Network
Startup / Availability
- Container Didn't Respond to HTTP Pings
- Warm-up vs Health Check
- Slot Swap Failed During Warm-up
- Deployment Succeeded but Startup Failed
- Failed to Forward Request
- Slot Swap Config Drift
- Auth Redirect Loop
Quick Start
| Need | Start Here |
|---|---|
| First 10 minutes of a performance issue | Performance Checklist |
| First 10 minutes of a network issue | Network Checklist |
| First 10 minutes of a startup failure | Startup Checklist |
| Reusable KQL queries | Query Library |
Hands-on Labs
Deploy reproduction environments to your Azure subscription and observe real symptoms:
- Memory Pressure
- Intermittent 5xx Under Load
- Container HTTP Pings
- SNAT Exhaustion
- DNS Resolution (VNet)
- No Space Left on Device
- Deployment Succeeded but Startup Failed
- Failed to Forward Request
- Slot Swap Config Drift
- Slow Start / Cold Start
Architecture & Methodology
Portal view: Diagnose and solve problems landing page
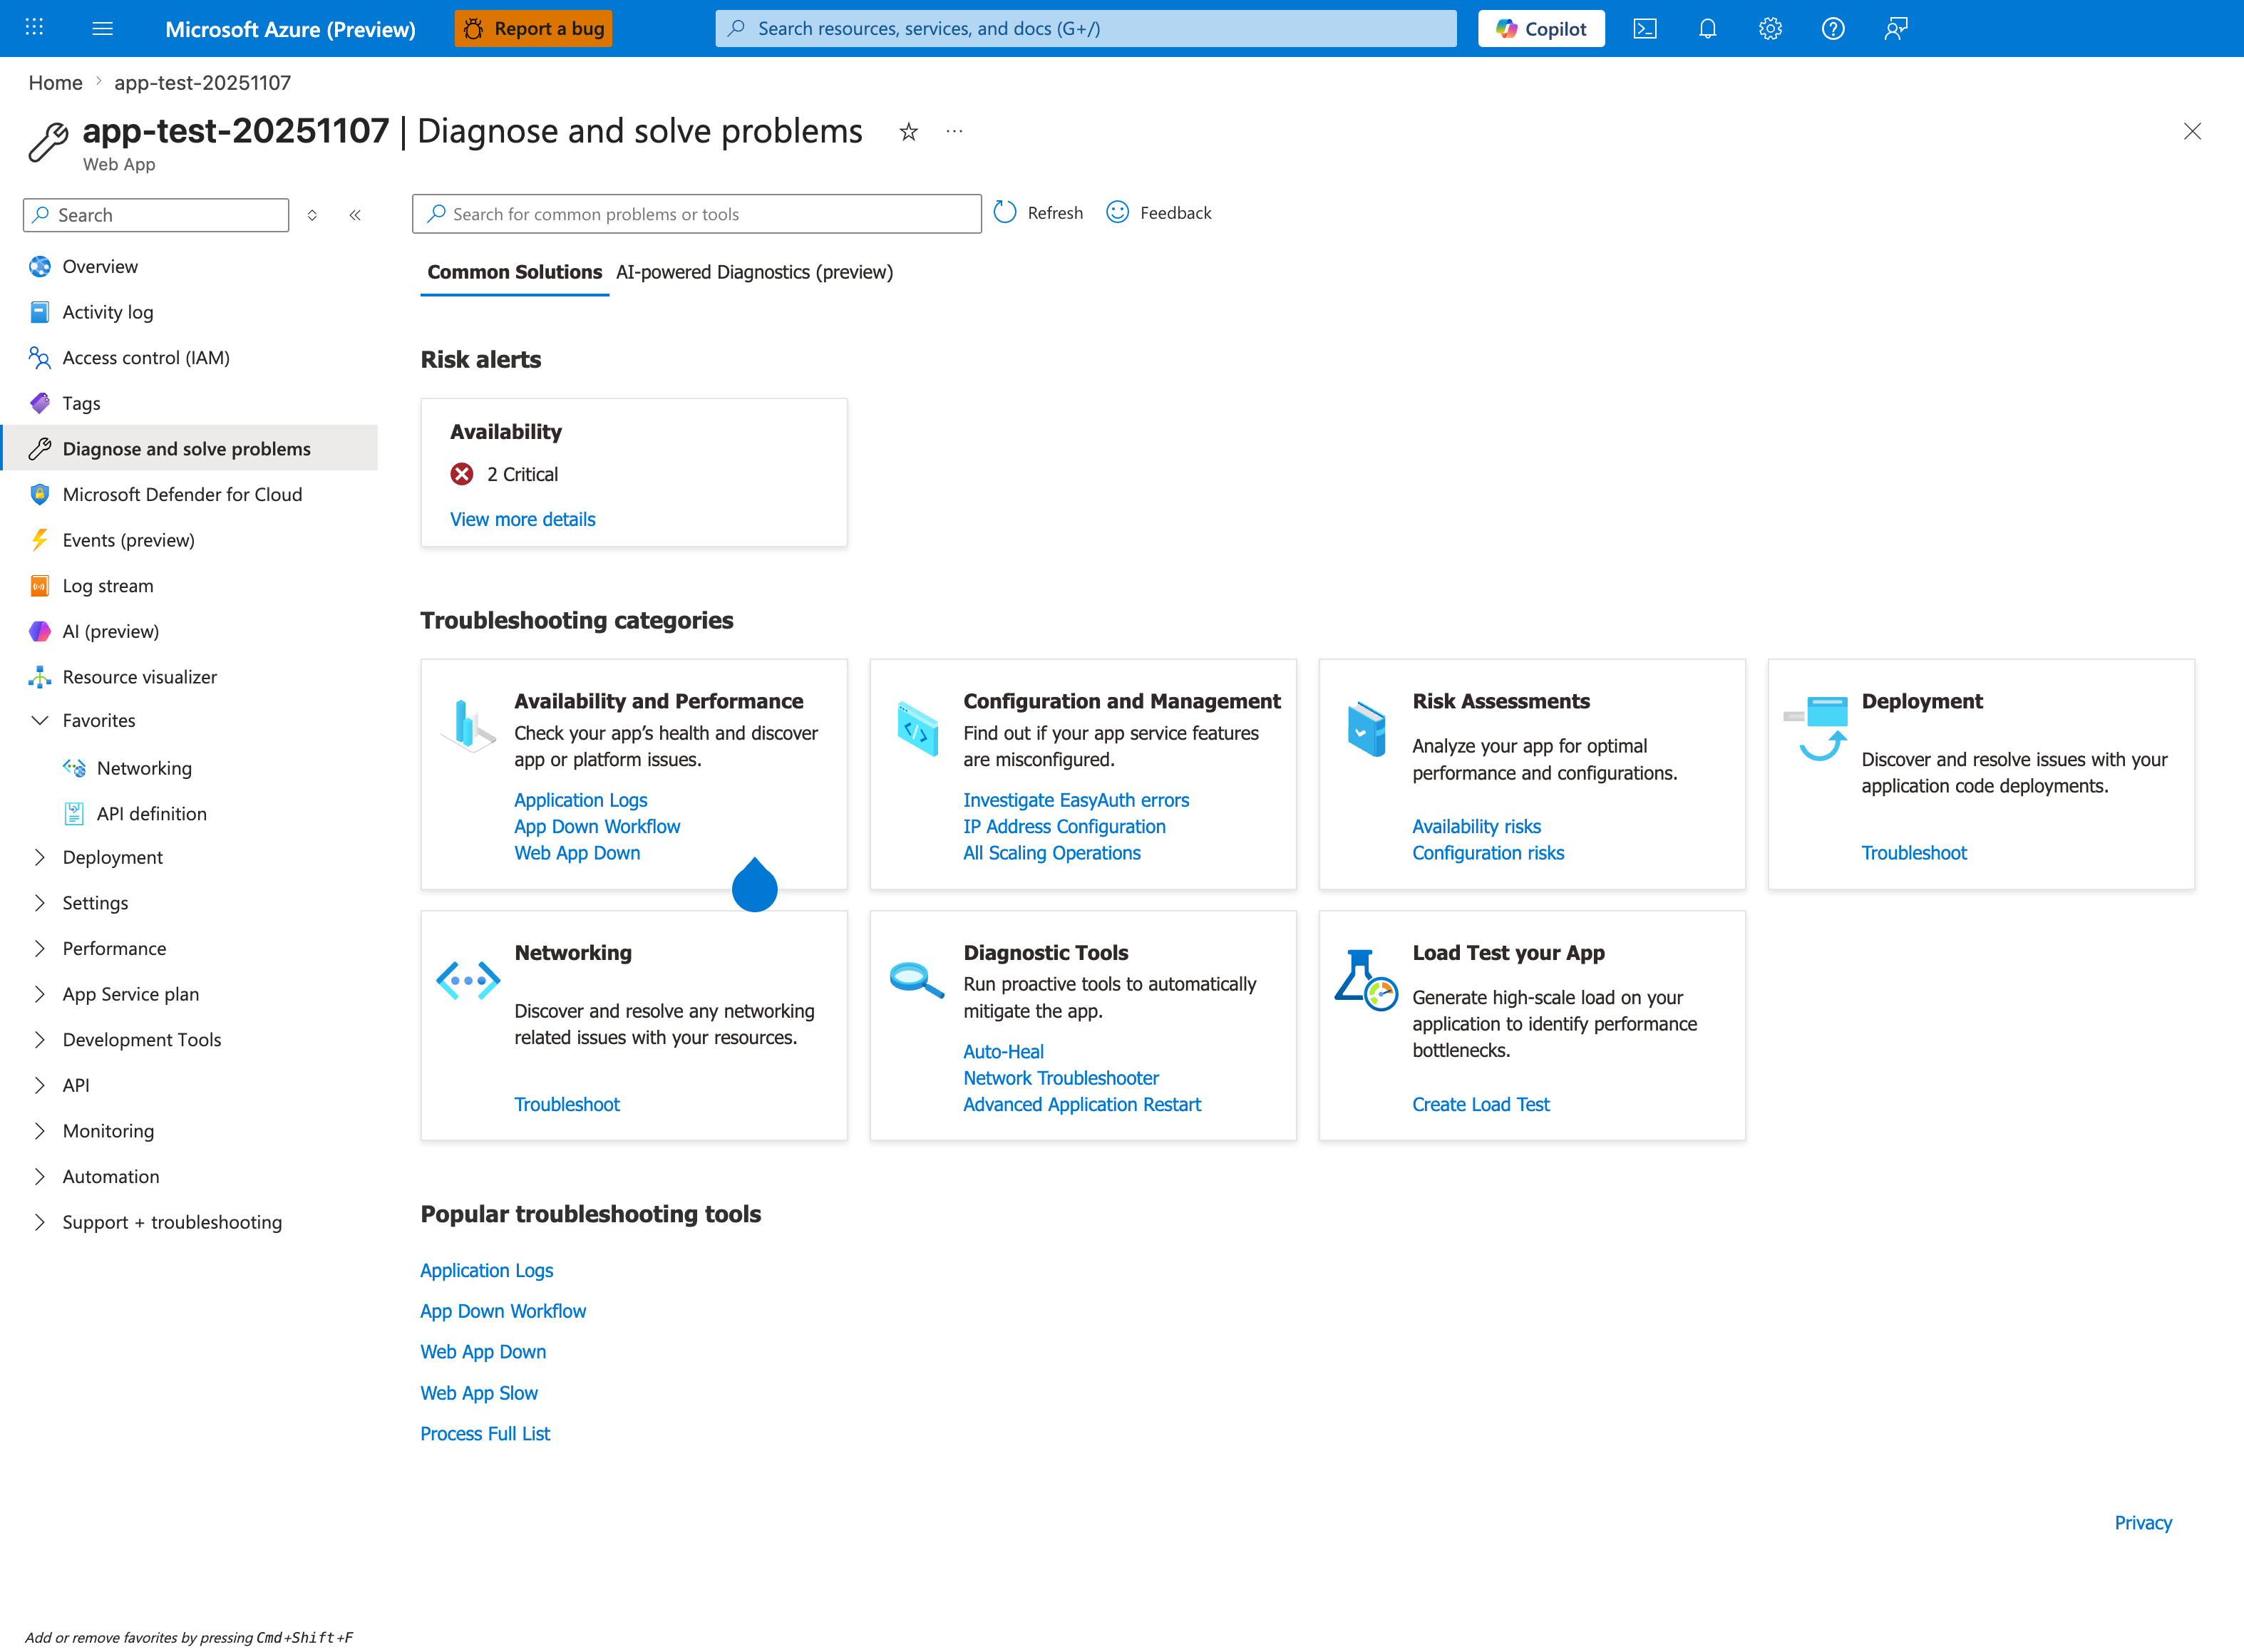
The Portal's built-in Diagnose and solve problems blade is the operational entry point that complements the architecture and methodology pages below. Treat it as the first stop during an active incident — Risk alerts surfaces pre-detected critical issues, the seven Troubleshooting categories map directly to the failure classifications in the Mental Model, and the Popular troubleshooting tools (App Down Workflow, Web App Slow) run guided diagnostic flows that consolidate many manual KQL queries.
- Architecture Overview — How App Service components interact during failures
- Decision Tree — Route from symptom to playbook in 60 seconds
- Evidence Map — What evidence to collect for each failure type
- Mental Model — Framework for hypothesis-driven diagnosis
- Troubleshooting Method — Full methodology deep-dive
- Detector Map — Platform diagnostic detectors and what they check