Troubleshooting
Platform-level troubleshooting reference for Azure App Service across runtimes.
Overview
flowchart TD
    A[Incident Symptom] --> B[Collect Baseline]
    B --> C{Issue Domain}
    C --> D[Deployment Checks]
    C --> E[Network Checks]
    C --> F[Runtime and Logs]
    D --> G[Validate and Mitigate]
    E --> G
    F --> G
Diagnostic Tools Overview
| Tool | Purpose | Access |
|---|---|---|
| Kudu (SCM) | File system, process, environment, deployment diagnostics | https://${APP_NAME}.scm.azurewebsites.net |
| Log Stream | Real-time application and container logs | Azure Portal or CLI |
| Application Insights | Requests, traces, dependencies, exceptions | Azure Portal |
| Diagnose and solve problems | Built-in detectors and recommendations | Azure Portal > Web App |
Language-specific debugging
This document focuses on App Service platform diagnostics. For runtime/framework-specific startup and debugging issues, see the language-specific guides linked in Language-Specific Details.
Fast Triage Commands
az webapp show --resource-group $RG --name $APP_NAME --output table
az webapp log tail --resource-group $RG --name $APP_NAME
az webapp config appsettings list --resource-group $RG --name $APP_NAME --output table
az webapp deployment slot list --resource-group $RG --name $APP_NAME --output table
Note:
az webapp log tailmay not work reliably for Linux App Service. Use the Azure Portal Log stream or/home/LogFilesas alternatives.
Linux custom container SCM caveat
For Linux custom containers, the SCM/Kudu site runs in a separate container from the app container. That means Kudu cannot directly inspect the app container's live filesystem or running processes. Prefer SSH into the app container, Log stream, or application/container logs when investigating runtime behavior inside a custom container.
Common Platform Issues
| Symptom | Likely Cause | Action |
|---|---|---|
| 503 Service Unavailable | Worker process failed or app is restarting | Check log stream, deployment logs, and latest restart events |
| 502 Bad Gateway | App failed to start or failed health probe | Verify startup command and health check path |
| Slow responses / timeouts | Long-running requests, dependency latency, plan saturation | Check request duration, dependency latency, CPU/memory metrics |
| Disk quota reached | Logs or generated files filling persistent storage | Clean unnecessary files in /home/LogFiles and app data |
| Intermittent outbound failures | SNAT port pressure or firewall allowlist mismatch | Reuse connections, review outbound IPs, add NAT Gateway if needed |
| DNS resolution failures for private endpoints | Private DNS Zone linkage issue | Verify Private DNS Zone links to integration VNet |
Deployment Troubleshooting
Check deployment history
Check latest deployment details
az webapp log deployment show \
  --resource-group $RG \
  --name $APP_NAME \
  --deployment-id latest \
  --output json
Validate build-on-deploy setting
az webapp config appsettings list \
  --resource-group $RG \
  --name $APP_NAME \
  --query "[?name=='SCM_DO_BUILD_DURING_DEPLOYMENT']"
Networking Troubleshooting
VNet integration status
Route-all check
az webapp config appsettings list \
  --resource-group $RG \
  --name $APP_NAME \
  --query "[?name=='WEBSITE_VNET_ROUTE_ALL']"
Set route-all when required:
az webapp config appsettings set \
  --resource-group $RG \
  --name $APP_NAME \
  --settings WEBSITE_VNET_ROUTE_ALL=1
Outbound IP allowlist checks
az webapp show \
  --resource-group $RG \
  --name $APP_NAME \
  --query "{outbound: properties.outboundIpAddresses, possible: properties.possibleOutboundIpAddresses}" \
  --output json
Allowlist all possible outbound IPs
The active outbound IP set can change as the app scales or moves. Add all addresses from possibleOutboundIpAddresses to external allowlists.
Kudu-Based Checks
- Open Kudu:
https://${APP_NAME}.scm.azurewebsites.net - Check environment:
/api/environment - Check running processes:
/api/processes - Review logs under
/home/LogFiles
For Linux custom containers, use those Kudu checks mainly for deployment context, environment snapshots, and shared logs. Do not assume /api/processes or Kudu file browsing reflects the main app container runtime state.
See Kudu API Reference for endpoint details.
Data to Collect Before Escalation
- UTC time window and affected endpoint(s)
- Correlation/operation ID (if available)
- Recent deployment ID and timestamp
- Plan SKU and current instance count
- Relevant error snippets (PII removed)
Run It in the Portal
Portal view: Diagnose and solve problems blade
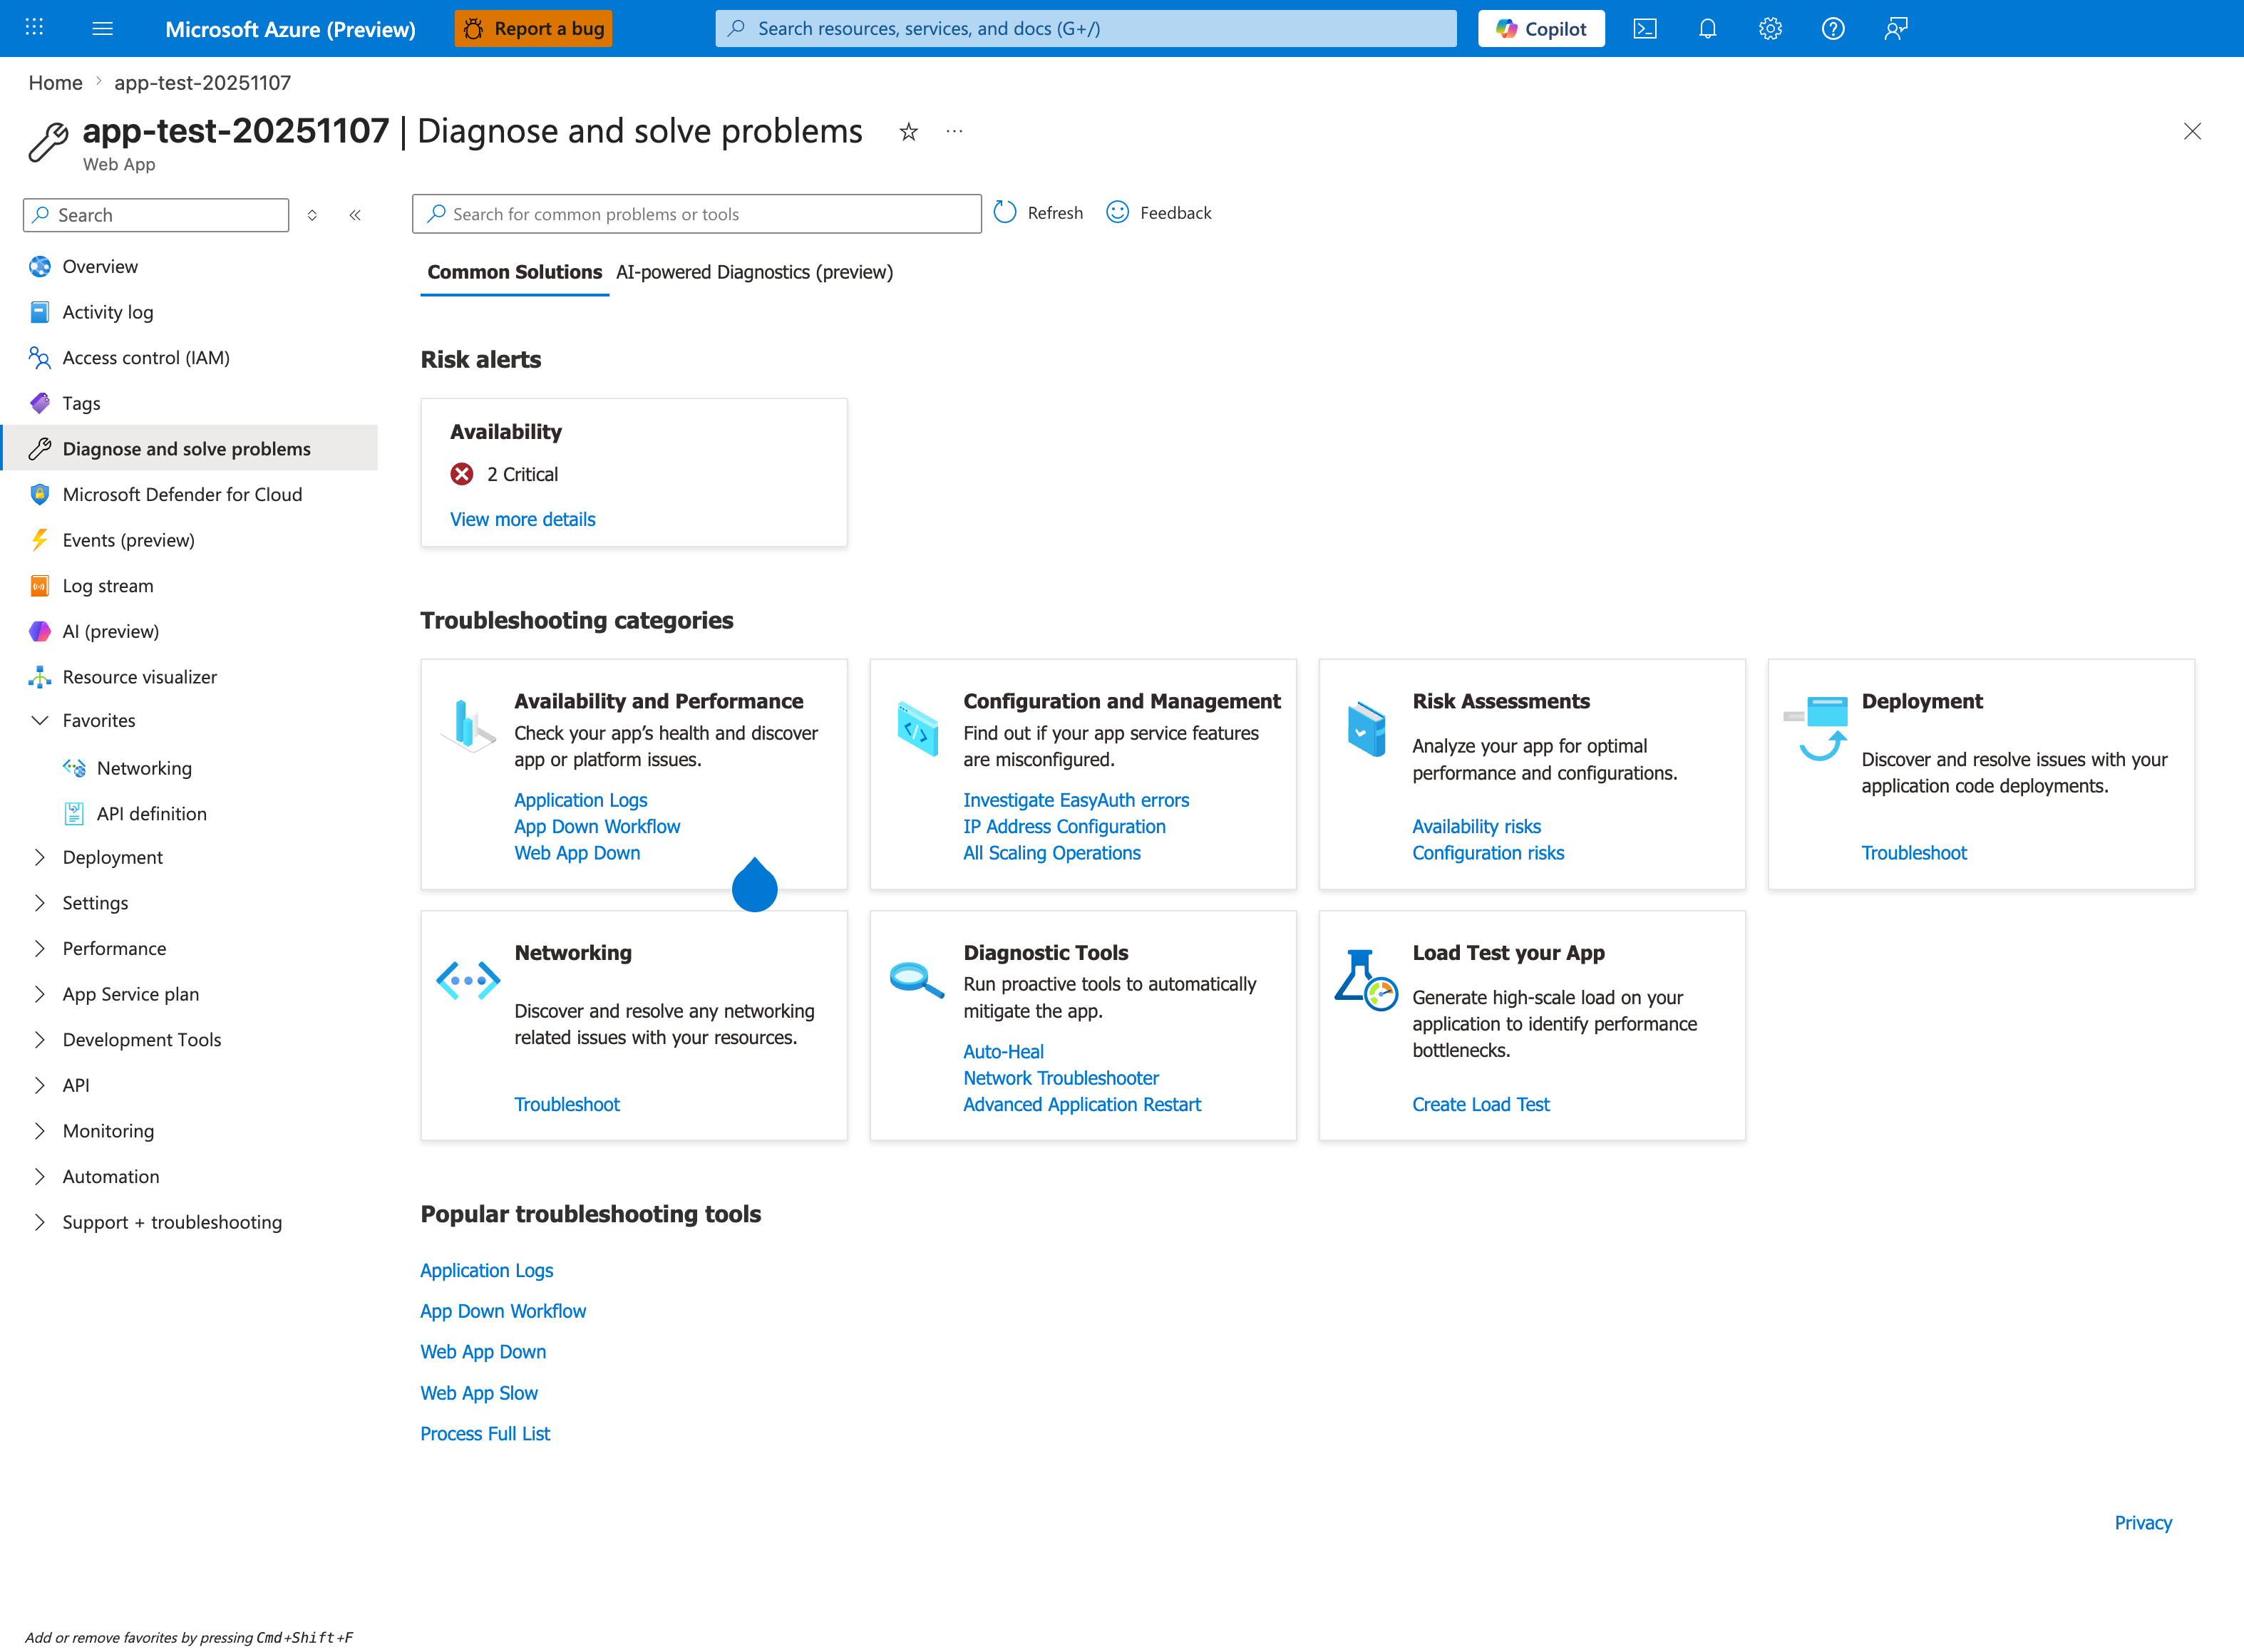
The Diagnose and solve problems blade is the Portal counterpart to the Diagnose and solve problems entry in the Diagnostic Tools Overview table above. The visible troubleshooting categories show how the portal organizes first-response workflows: Availability and Performance, Configuration and Management, Risk Assessments, Deployment, Networking, Diagnostic Tools, and Load Test your App. The Risk alerts card and the Popular troubleshooting tools row (Application Logs, App Down Workflow, Web App Down, Web App Slow, Process Full List) make this a practical starting point before you move into the CLI, KQL, or Kudu steps elsewhere on this page. Use this blade to choose the detector that best matches the symptom you are triaging, then collect the supporting data listed in ## Data to Collect Before Escalation.
See Also
Sources
- Diagnose and Solve Problems in App Service (Microsoft Learn)
- Troubleshoot Diagnostic Logs in App Service (Microsoft Learn)
- Networking Features in App Service (Microsoft Learn)
Language-Specific Details
Runtime-specific startup failures, package/import issues, framework worker tuning, and language-level exception handling are documented in: