KQL Queries Reference
Language-agnostic KQL queries for Azure App Service monitoring, diagnostics, and operations.
Overview
flowchart TD
    A[KQL Query Packs] --> B[App Insights]
    A --> C[Log Analytics]
    A --> D[Diagnostics]
    A --> E[Operations]
    E --> F[Deployment and Scale]
Query Location and Table Names
Table names differ by query location
The same data uses different table names depending on where you run the query:
| Query Location | Table Names | Time Column |
|---|---|---|
| Application Insights → Logs | traces, requests, dependencies, exceptions | timestamp |
| Log Analytics Workspace → Logs | AppTraces, AppRequests, AppDependencies, AppExceptions | TimeGenerated |
| App Service → Logs | Platform tables only (AppServiceHTTPLogs, etc.) | TimeGenerated |
Where to Run Each Query
flowchart TD
    subgraph AI ["Application Insights"]
        T1["traces"]
        R1["requests"]
        D1["dependencies"]
    end

    subgraph LA ["Log Analytics Workspace"]
        T2["AppTraces"]
        R2["AppRequests"]
        D2["AppDependencies"]
        P["AppServiceHTTPLogs\nAppServiceConsoleLogs\nAppServicePlatformLogs"]
    end

    subgraph AS ["App Service → Logs"]
        P2["Platform tables only\n(No AppTraces)"]
    end
Example: Same Query, Different Location
Application Insights → Logs:
traces
| where timestamp > ago(30m)
| project timestamp, message, severityLevel
| order by timestamp desc
Log Analytics Workspace → Logs:
AppTraces
| where TimeGenerated > ago(30m)
| project TimeGenerated, Message, SeverityLevel
| order by TimeGenerated desc
Quick Rule
- Portal path includes "Application Insights" → use lowercase (
traces,requests) - Portal path includes "Log Analytics" → use PascalCase (
AppTraces,AppRequests)
Application Insights Queries
Request volume and success trend
Shows total requests and failures every 5 minutes.
AppRequests
| where timestamp > ago(6h)
| summarize totalRequests = count(), failedRequests = countif(success == false) by bin(timestamp, 5m)
| extend successRate = (totalRequests - failedRequests) * 100.0 / totalRequests
| order by timestamp asc
Slow request investigation
Lists slow requests with operation IDs for drill-down.
AppRequests
| where timestamp > ago(2h)
| where duration > 2000
| project timestamp, operation_Id, name, resultCode, duration, cloud_RoleInstance
| order by duration desc
| take 100
Exception trend by type
Tracks exception growth by type over time.
AppExceptions
| where timestamp > ago(24h)
| summarize exceptionCount = count() by type, bin(timestamp, 30m)
| order by timestamp asc
Dependency failure hotspots
Finds failing outbound dependencies and latency impact.
AppDependencies
| where timestamp > ago(24h)
| where success == false
| summarize failures = count(), avgDuration = avg(duration), p95Duration = percentile(duration, 95) by type, target, name
| top 20 by failures desc
Request-to-dependency correlation
Connects slow requests to dependency calls in the same operation.
AppRequests
| where timestamp > ago(2h)
| where duration > 1500
| join kind=leftouter (AppDependencies | project operation_Id, dependencyName = name, dependencyTarget = target, dependencyDuration = duration, dependencySuccess = success) on operation_Id
| project timestamp, operation_Id, requestName = name, requestDuration = duration, dependencyName, dependencyTarget, dependencyDuration, dependencySuccess
| order by requestDuration desc
Error traces with request context
Shows error-level traces alongside related request metadata.
AppTraces
| where timestamp > ago(4h)
| where severityLevel >= 3
| join kind=leftouter (AppRequests | project operation_Id, requestName = name, resultCode, requestDuration = duration) on operation_Id
| project timestamp, severityLevel, message, requestName, resultCode, requestDuration, operation_Id
| order by timestamp desc
Performance percentile summary
Builds p50/p95/p99 request latency by endpoint.
AppRequests
| where timestamp > ago(24h)
| summarize p50 = percentile(duration, 50), p95 = percentile(duration, 95), p99 = percentile(duration, 99), total = count() by name
| order by p95 desc
Log Analytics Queries
HTTP 5xx trend from App Service logs
Shows server error counts from platform HTTP logs.
AppServiceHTTPLogs
| where TimeGenerated > ago(24h)
| where ScStatus between (500 .. 599)
| summarize errors = count() by bin(TimeGenerated, 10m), ScStatus
| order by TimeGenerated asc
Slow responses from HTTP logs
Finds requests with high processing time.
AppServiceHTTPLogs
| where TimeGenerated > ago(6h)
| where TimeTaken > 2000
| project TimeGenerated, CsMethod, CsUriStem, ScStatus, TimeTaken, CIp
| order by TimeTaken desc
| take 100
Console error extraction
Surfaces error-like entries from app console logs.
AppServiceConsoleLogs
| where TimeGenerated > ago(12h)
| where Level has_any ("error", "critical") or ResultDescription has_any ("Exception", "Error", "Failed")
| project TimeGenerated, Level, ResultDescription, _ResourceId
| order by TimeGenerated desc
Platform event timeline
Displays key platform events (startup, recycle, crash, health).
AppServicePlatformLogs
| where TimeGenerated > ago(24h)
| where Message has_any ("started", "recycled", "failed", "crash", "health")
| project TimeGenerated, Level, Message, _ResourceId
| order by TimeGenerated desc
Diagnostic Queries
Failed request drill-down
Aggregates failed requests by route and status code.
AppServiceHTTPLogs
| where TimeGenerated > ago(6h)
| where ScStatus >= 500
| summarize failedCount = count(), avgTimeTaken = avg(TimeTaken), p95TimeTaken = percentile(TimeTaken, 95) by CsUriStem, ScStatus
| order by failedCount desc
Error spike detector
Compares current and previous hour 5xx volume.
let currentHour = AppServiceHTTPLogs | where TimeGenerated > ago(1h) | where ScStatus between (500 .. 599) | summarize currentCount = count();
let previousHour = AppServiceHTTPLogs | where TimeGenerated between (ago(2h) .. ago(1h)) | where ScStatus between (500 .. 599) | summarize previousCount = count();
currentHour
| extend previousCount = toscalar(previousHour)
| extend changePercent = iif(previousCount == 0, 100.0, (currentCount - previousCount) * 100.0 / previousCount)
Operational Queries
Deployment tracking
Shows deployment-related platform log events.
AppServicePlatformLogs
| where TimeGenerated > ago(7d)
| where Message has_any ("deployment", "deploy", "package", "zipdeploy")
| project TimeGenerated, Level, Message, _ResourceId
| order by TimeGenerated desc
Scaling event timeline
Finds scale out/in and worker-count events.
AppServicePlatformLogs
| where TimeGenerated > ago(7d)
| where Message has_any ("scale", "instance", "worker", "autoscale")
| summarize events = count() by bin(TimeGenerated, 30m)
| order by TimeGenerated asc
Health check failures
Finds non-success responses on health endpoints.
AppServiceHTTPLogs
| where TimeGenerated > ago(24h)
| where CsUriStem has "/health"
| where ScStatus >= 400
| project TimeGenerated, CsMethod, CsUriStem, ScStatus, TimeTaken, ComputerName
| order by TimeGenerated desc
How to Run
Run queries in Application Insights > Logs or Log Analytics Workspace > Logs.
az monitor app-insights query --app $APP_NAME --resource-group $RG --analytics-query "AppRequests | where timestamp > ago(1h) | take 10"
Run It in the Portal
Portal view: Logs blade (Log Analytics query editor)
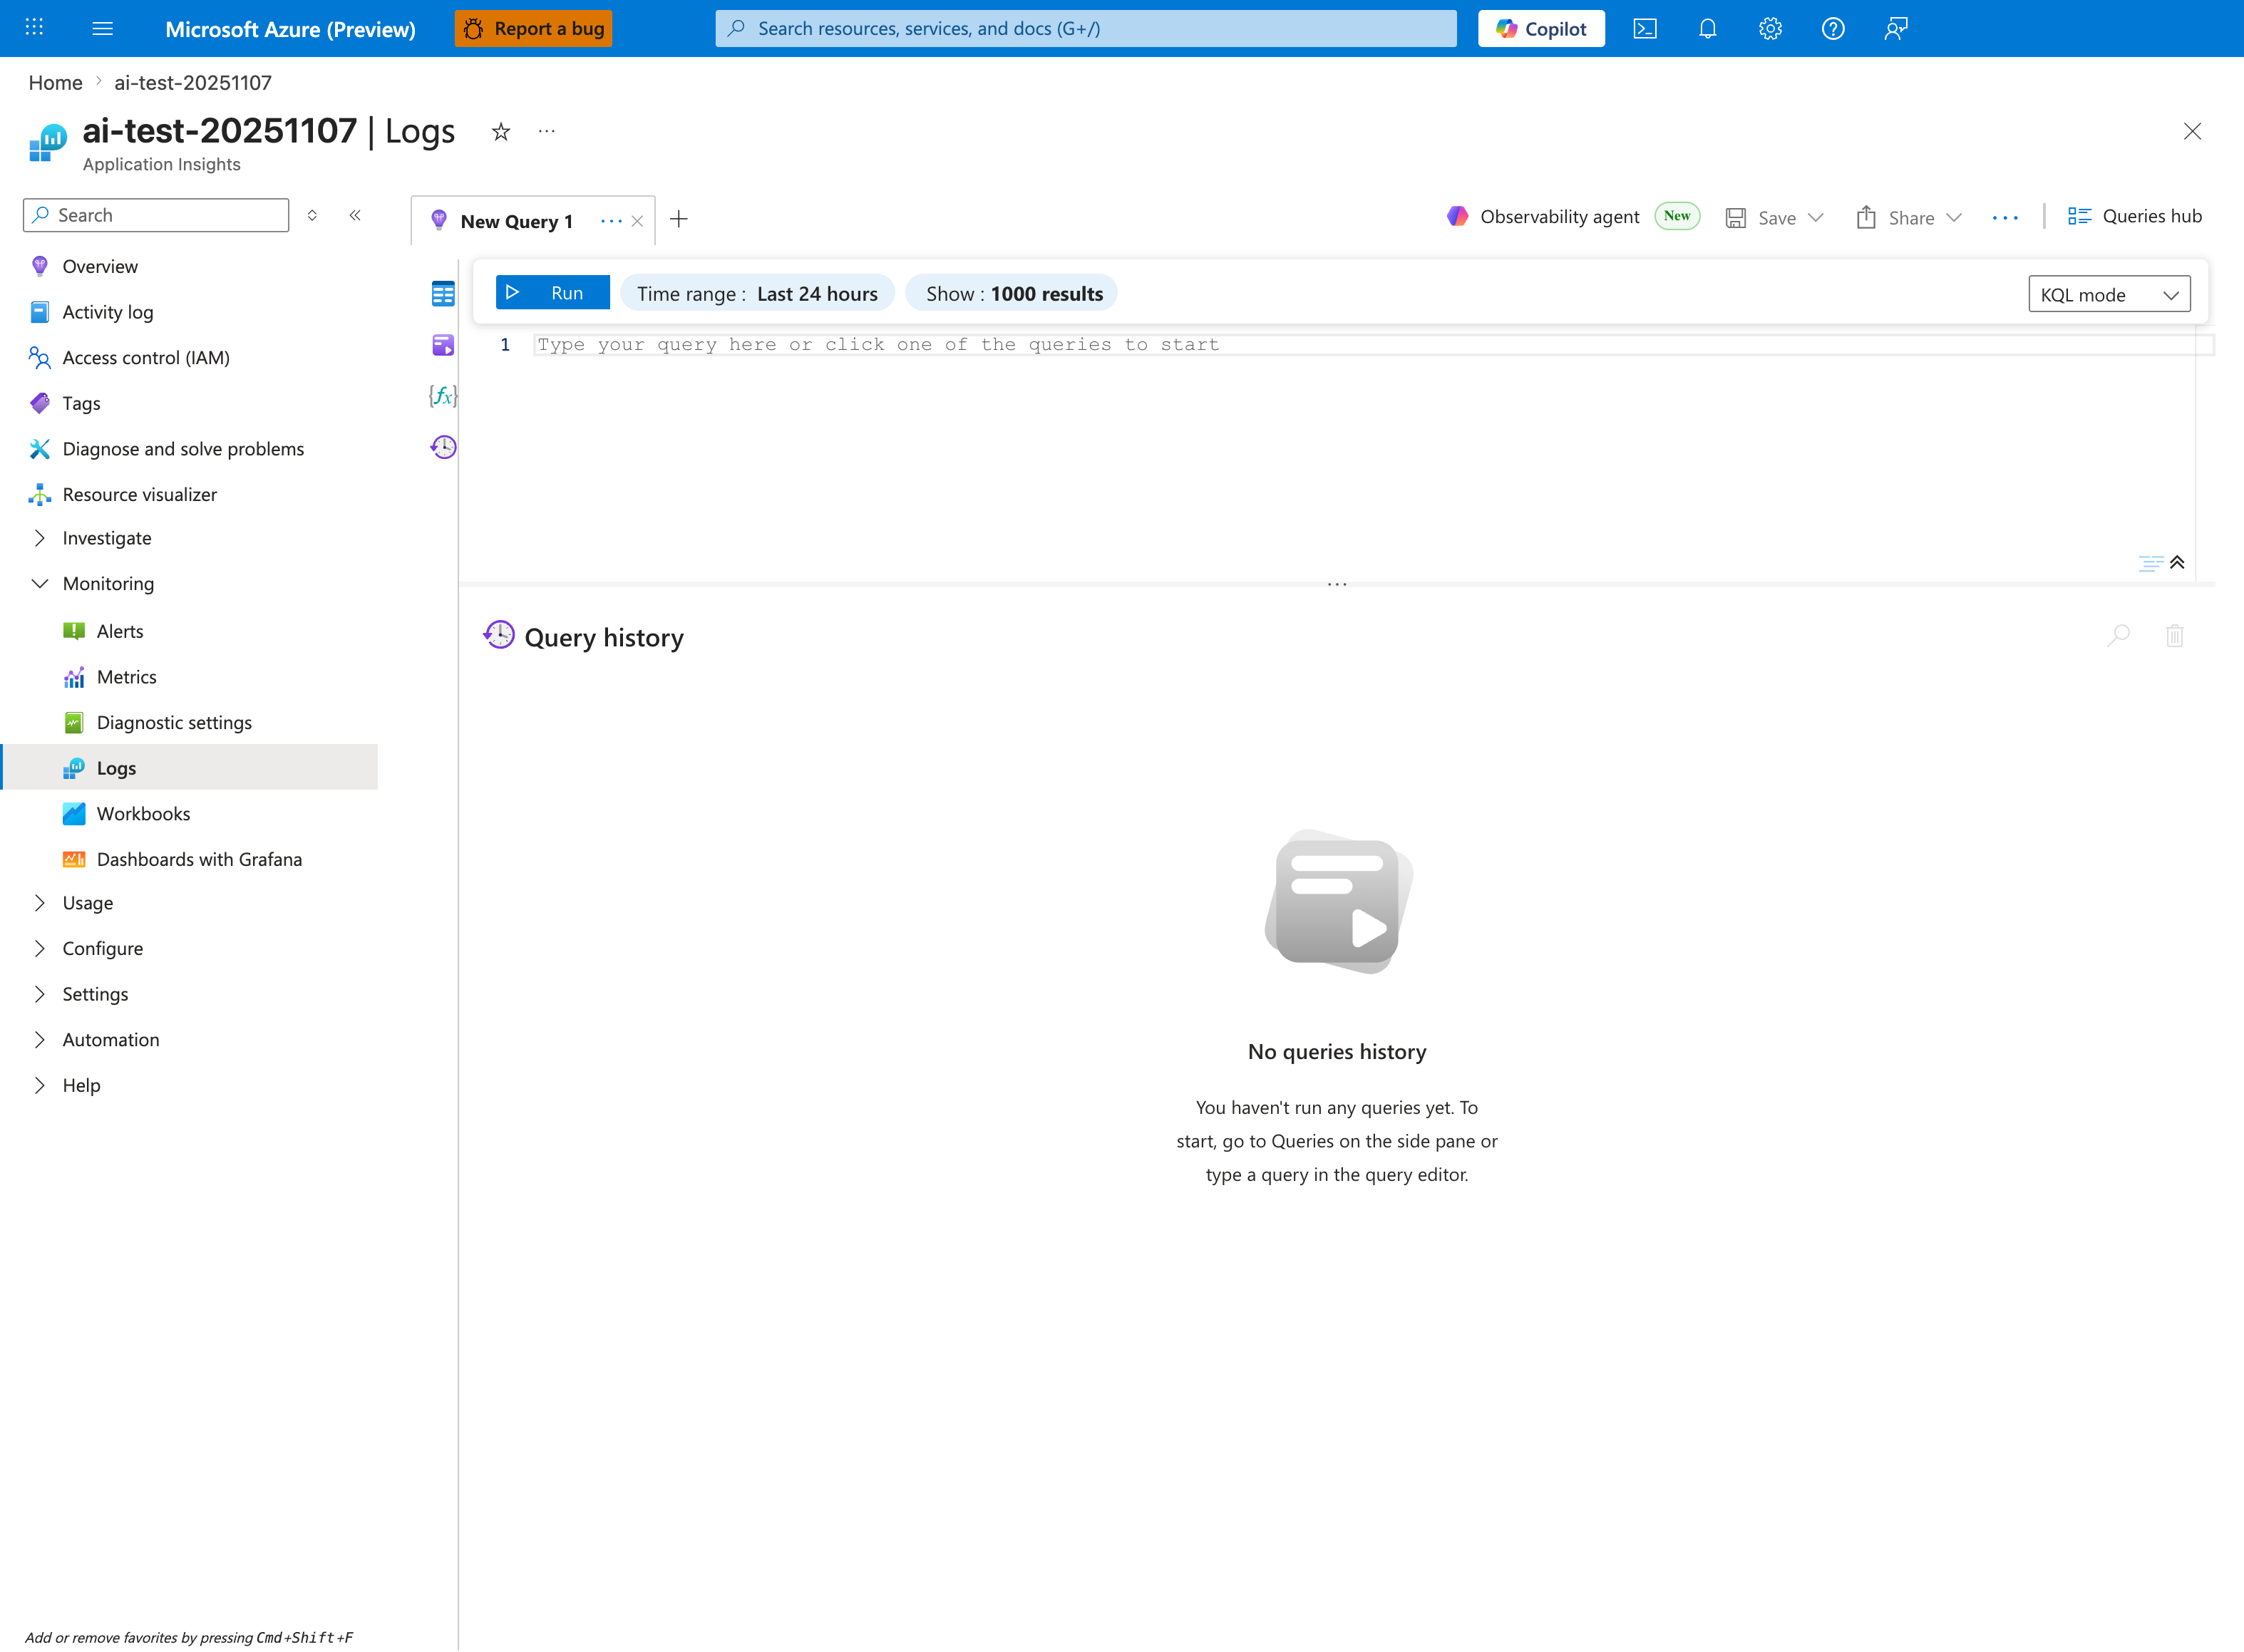
The Logs blade is where every query in this reference is pasted - this capture shows the Application Insights Logs experience (ai-test-20251107), but the workspace-based Log Analytics blade has the same New Query 1 tab, Run toolbar, and KQL mode dropdown. Use the Application Insights variant for the Application Insights query pack on this page (AppRequests, AppDependencies, AppExceptions, AppTraces); use the Log Analytics workspace variant for the platform-table query pack (AppServiceHTTPLogs, AppServiceConsoleLogs, AppServicePlatformLogs). The visible Time range: Last 24 hours window is a good default for trend queries that filter with where TimeGenerated > ago(24h); tighten it via the inline Time range selector when a query already uses ago(1h) or ago(30m) to avoid double-windowing. The empty Query history pane and the placeholder Type your query here or click one of the queries to start confirm a fresh session - paste any snippet from the sections above to populate the editor.