Health and Recovery Operations
Maintain availability by combining health checks, automatic remediation, and diagnostics. This guide focuses on platform-native recovery controls for Azure App Service.
flowchart TD
    Probe[Health Probe Pings /health] --> Status{Status Code?}
    Status -- 200 OK --> Healthy[Instance Healthy]
    Status -- 5xx / Timeout --> Unhealthy[Instance Unhealthy]

    Unhealthy --> Action{Recovery Action}
    Action -- Remove --> LB[Remove from Load Balancer]
    Action -- Restart --> AutoHeal[Auto-Heal Restarts Instance]

    LB --> Retry[Wait and Retry Probe]
    AutoHeal --> Retry
    Retry --> Probe
Prerequisites
- Existing App Service app with at least one active instance
- A lightweight health endpoint (for example
/health) - Azure Monitor access for metrics and activity logs
- Variables set:
RGAPP_NAME
When to Use
Procedure
Define a Reliable Health Endpoint Contract
Your health endpoint should:
- return HTTP 200 for healthy state
- avoid expensive dependency checks by default
- respond quickly (typically under 1 second)
- include optional deep checks behind a separate path when needed
Do not over-couple health checks
If your liveness probe requires every downstream dependency to be healthy, transient external failures can trigger unnecessary instance removal.
Enable App Service Health Check
az webapp config set \
  --resource-group $RG \
  --name $APP_NAME \
  --health-check-path "/health" \
  --output json
Verify setting:
az webapp config show \
  --resource-group $RG \
  --name $APP_NAME \
  --query "{healthCheckPath:healthCheckPath,minimumTls:minTlsVersion,alwaysOn:alwaysOn}" \
  --output json
Understand Platform Default Probe Behavior
Once health check is enabled, the App Service platform probes each instance on a fixed cadence. Knowing the defaults helps you reason about removal latency and set realistic recovery SLOs.
| Behavior | Default | Configurable via |
|---|---|---|
| Probe interval per instance | approximately 1 minute | not configurable |
| Consecutive failures before removal | 10 | WEBSITE_HEALTHCHECK_MAXPINGFAILURES app setting (range 2-10) |
| Single-instance safety net | platform never removes the only running instance | platform-enforced |
Tune the failure threshold when you need faster or more lenient removal:
az webapp config appsettings set \
  --resource-group $RG \
  --name $APP_NAME \
  --settings WEBSITE_HEALTHCHECK_MAXPINGFAILURES=5 \
  --output json
Plan for at least 2 instances in production
Health check will not remove the only running instance, even if it is failing probes — this prevents total outage when no other instance is available to take traffic. To get the benefit of platform-side instance rotation, run at least 2 instances so an unhealthy instance can be replaced while a healthy one continues serving requests.
Configure Auto-Heal for Memory Pressure
az webapp config auto-heal update \
  --resource-group $RG \
  --name $APP_NAME \
  --auto-heal-enabled true \
  --auto-heal-action Restart \
  --auto-heal-memory-private-set-kb 1500000 \
  --auto-heal-memory-private-set-duration "00:05:00" \
  --output json
Configure Auto-Heal for Slow Requests
az webapp config auto-heal update \
  --resource-group $RG \
  --name $APP_NAME \
  --auto-heal-enabled true \
  --auto-heal-action Restart \
  --auto-heal-slow-requests-count 50 \
  --auto-heal-slow-requests-interval "00:05:00" \
  --auto-heal-slow-requests-time "00:00:10" \
  --output json
Inspect effective rules:
Capture Recovery Signals
Tail live platform logs:
List relevant activity events:
az monitor activity-log list \
  --resource-group $RG \
  --offset 1d \
  --max-events 50 \
  --query "[?contains(operationName.value, 'Microsoft.Web/sites/restart') || contains(operationName.value, 'AutoHeal')].{time:eventTimestamp,status:status.value,operation:operationName.localizedValue}" \
  --output table
Portal view: Availability and Performance diagnostic
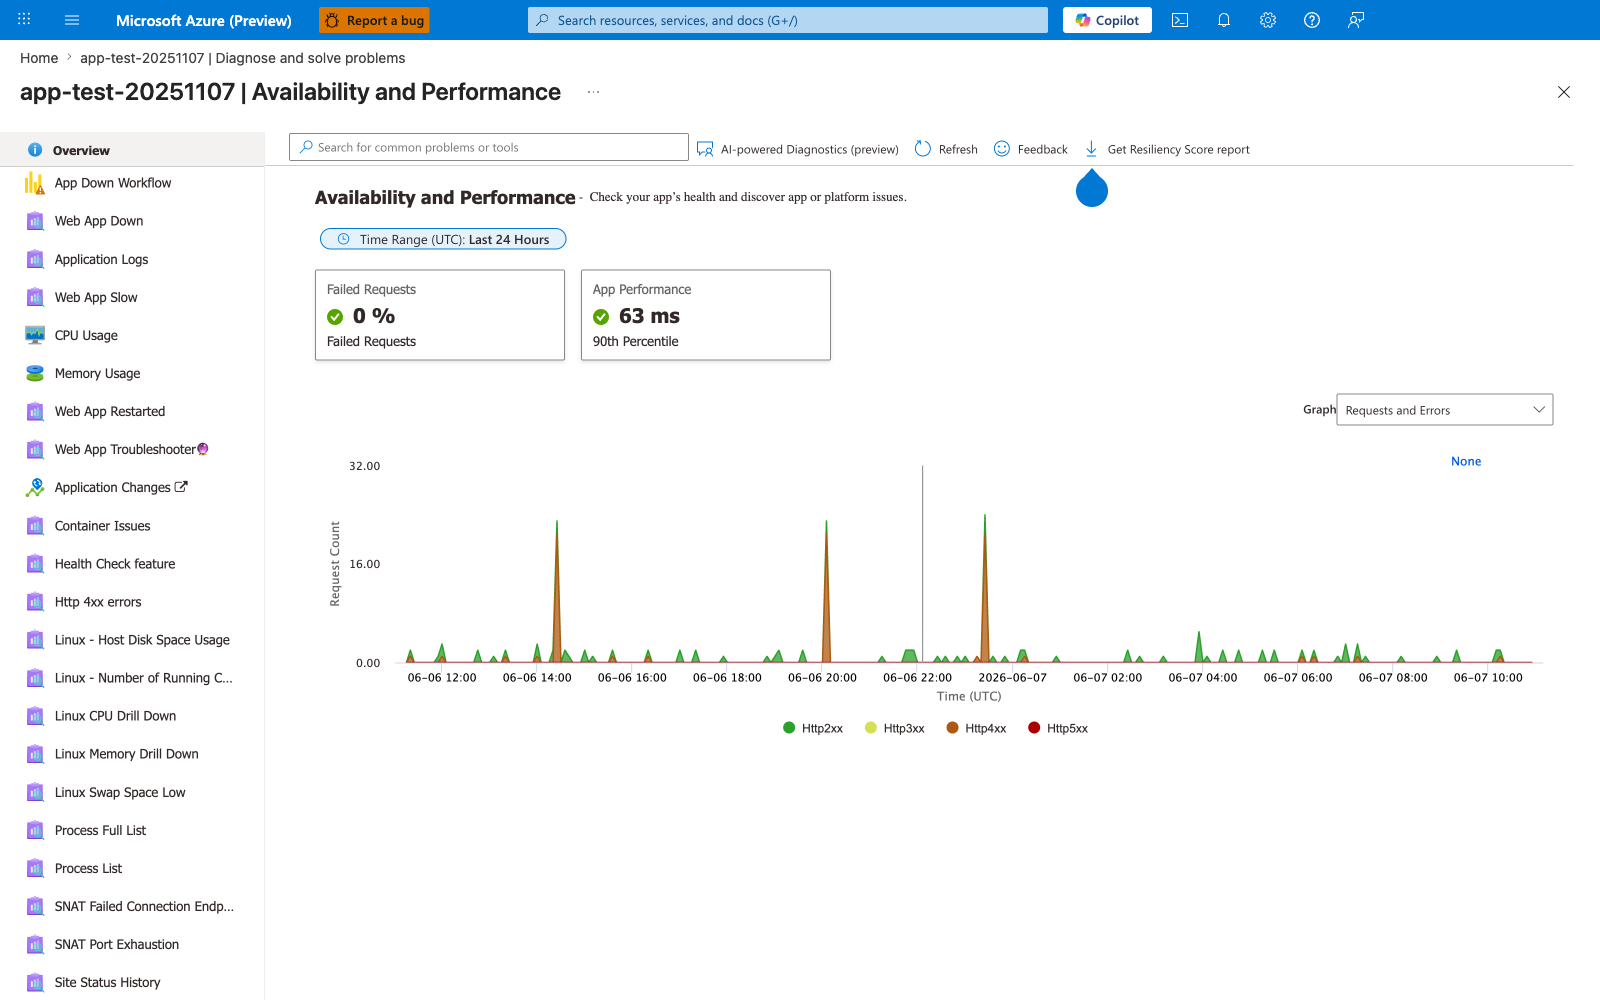
The Availability and Performance diagnostic is the Portal equivalent of the recovery-signals queries above and the entry point for nearly every incident triage flow this guide describes. The two KPI tiles map directly to the SLO checks elsewhere in this document: Failed Requests: 0% is the error-budget signal, and App Performance: 63 ms (90th Percentile) is the latency signal that drives the early-warning alerts described in the advanced topics. The left-nav catalog (Web App Down, CPU Usage, Memory Usage, Web App Restarted, Health Check feature, SNAT Port Exhaustion, Process List, ...) is the menu of specialized diagnostics — when az monitor activity-log list from the snippet above shows repeated Auto-Heal events, the right tile to drill into is Web App Restarted; when 4xx spikes appear in the chart like the three visible here, drill into Http 4xx errors. Use this blade as the first stop during an incident before reaching for az webapp restart, because manual restart erases the in-memory context the AI-powered Diagnostics preview and the Linux drill-downs need to identify a root cause.
Build an Operational Recovery Runbook
Recommended sequence when incidents occur:
- Confirm symptom scope (single instance vs whole app)
- Check health check status and endpoint latency
- Review auto-heal trigger frequency
- Restart app only if automatic recovery is insufficient
- Scale out temporarily if saturation persists
- Capture logs, metrics, and timelines for post-incident review
Manual restart command:
Verification
Control plane validation:
az webapp config show \
  --resource-group $RG \
  --name $APP_NAME \
  --query "{healthCheckPath:healthCheckPath}" \
  --output json

az webapp config auto-heal show \
  --resource-group $RG \
  --name $APP_NAME \
  --query "{enabled:autoHealEnabled,action:autoHealRules.actions.actionType}" \
  --output json
Data plane validation:
Expected result: HTTP success response and stable latency.
Example Incident Timeline (PII-masked)
2026-04-03T09:12:20Z  alert   MemoryPercentage > 90 for 5m
2026-04-03T09:13:10Z  action  Auto-Heal restart triggered
2026-04-03T09:14:02Z  probe   /health returned 200
2026-04-03T09:16:00Z  metric  Error rate back to baseline
Rollback / Troubleshooting
Health check keeps failing
- Confirm endpoint path is correct
- Ensure endpoint does not require authentication
- Ensure dependencies used by health endpoint are reachable
Frequent auto-heal restarts
- Increase thresholds to reduce false positives
- Investigate memory leaks or long-running requests
- Correlate restart times with traffic spikes
Single instance remains unhealthy
- Verify there is enough capacity to rotate instances
- Check startup latency and warm-up behavior
- Review deployment slot and recent release changes
Advanced Topics
Liveness, Readiness, and Deep Health Patterns
- Liveness: quick process check (
/health) - Readiness: dependency readiness (
/ready) - Deep diagnostics: detailed component checks (
/health/deep)
Route platform probes to liveness, and use readiness/deep checks in pipelines and synthetic monitors.
Recovery-Oriented Alerting Strategy
Design alerts by stage:
- Early warning: rising latency or queue depth
- Trigger warning: repeated 5xx bursts
- Recovery failure: repeated auto-heal loops
This helps detect when automatic recovery is not sufficient.
Chaos and Resilience Testing
Periodically test:
- deliberate dependency timeout
- temporary DNS failure scenarios
- controlled memory stress
Capture observed recovery time and compare with target RTO.
Enterprise Considerations
Maintain a shared incident playbook with predefined ownership, communication channels, and rollback criteria. Treat repeated auto-heal events as reliability debt, not as normal steady state.
Language-Specific Details
For language-specific operational guidance, see: - Node.js Guide - Python Guide - Java Guide - .NET Guide
See Also
- Operations Index
- Scaling Operations
- Backup and Restore
- Health check in App Service (Microsoft Learn)
- Diagnostics and auto-heal (Microsoft Learn)