04. Logging & Monitoring
Time estimate: 30 minutes
Monitor your Node.js application's health, track performance, and diagnose issues with Azure's integrated observability tools.
Infrastructure Context
Service: App Service (Linux, Standard S1) | Network: VNet integrated | VNet: ✅
This tutorial assumes a production-ready App Service deployment with VNet integration, private endpoints for backend services, and managed identity for authentication.
flowchart TD
    INET[Internet] -->|HTTPS| WA["Web App\nApp Service S1\nLinux Node 20 LTS"]

    subgraph VNET["VNet 10.0.0.0/16"]
        subgraph INT_SUB["Integration Subnet 10.0.1.0/24\nDelegation: Microsoft.Web/serverFarms"]
            WA
        end
        subgraph PE_SUB["Private Endpoint Subnet 10.0.2.0/24"]
            PE_KV[PE: Key Vault]
            PE_SQL[PE: Azure SQL]
            PE_ST[PE: Storage]
        end
    end

    PE_KV --> KV[Key Vault]
    PE_SQL --> SQL[Azure SQL]
    PE_ST --> ST[Storage Account]

    subgraph DNS[Private DNS Zones]
        DNS_KV[privatelink.vaultcore.azure.net]
        DNS_SQL[privatelink.database.windows.net]
        DNS_ST[privatelink.blob.core.windows.net]
    end

    PE_KV -.-> DNS_KV
    PE_SQL -.-> DNS_SQL
    PE_ST -.-> DNS_ST

    WA -.->|System-Assigned MI| ENTRA[Microsoft Entra ID]
    WA --> AI[Application Insights]

    style WA fill:#0078d4,color:#fff
    style VNET fill:#E8F5E9,stroke:#4CAF50
    style DNS fill:#E3F2FD
Prerequisites
- Application deployed and running on Azure (02. Deploy Application)
- Azure CLI logged in and source loaded:
source infra/.deploy-output.env
How Logs Flow
Understanding where your logs end up is the foundation of any debugging workflow. Every console.log or Winston statement your app emits follows this path:
flowchart TD
    A["Node.js Process\nconsole.log / Winston"] --> B["stdout / stderr"]
    B --> C["App Service Runtime\ncontainer layer"]

    C -->|"always captured"| D["/home/LogFiles\nFilesystem storage"]
    C -->|"TELEMETRY_MODE=advanced\nOR App Service AI agent"| E["Application Insights\nOTel SDK / agent export"]

    D --> D1["hostname_docker.log\nRaw container output"]
    D --> D2["Application/*.log\nApp logs — if enabled"]

    E --> E1["AppTraces\nlogger.info / warn / error"]
    E --> E2["AppRequests\nHTTP requests"]
    E --> E3["AppExceptions\nunhandled errors"]
    E --> E4["AppDependencies\nexternal calls"]

    E1 --> F["KQL Queries\n& Alerts"]
    E2 --> F
    E3 --> F
E4 --> F| Destination | Retention | Best For |
|---|---|---|
/home/LogFiles/*_docker.log | ~35 MB rolling | Container crashes, startup errors |
/home/LogFiles/Application/ | Up to 100 MB / 7 days | Short-term log archive |
Application Insights AppTraces | 90 days default | Long-term analysis, alerting, KQL |
Step 1 — Choose Your Telemetry Mode
The reference app ships two modes via the TELEMETRY_MODE environment variable:
TELEMETRY_MODE=basic     # Default: JSON stdout only, zero extra dependencies
TELEMETRY_MODE=advanced  # Winston + OpenTelemetry → Application Insights
| Mode | Extra Dependencies | Sent to App Insights? | Best For |
|---|---|---|---|
basic | None | Only via App Insights auto-collect | Getting started, cost-sensitive |
advanced | winston, @azure/monitor-opentelemetry | Yes, via SDK | Production workloads |
Set the mode in App Settings:
az webapp config appsettings set \
  --resource-group $RG \
  --name $APP_NAME \
  --settings TELEMETRY_MODE=advanced
| Command/Code | Purpose |
|---|---|
az webapp config appsettings set ... | Updates application settings for the web app |
TELEMETRY_MODE=advanced | Enables the advanced telemetry path that exports to Application Insights |
Step 2 — Structured JSON Logging
Both modes emit newline-delimited JSON to stdout. In advanced mode the OTel SDK also ships telemetry directly to Application Insights — no extra plugins required.
Pattern 1 — Normal Operational Logging
Use structured fields so KQL queries can filter and aggregate without string parsing.
The /log-levels demo route uses the module-level logger directly.
For routes that need per-request correlation, use req.logger — a child logger with correlationId pre-bound by apps/nodejs/src/middleware/correlation.js. See apps/nodejs/src/routes/demo/requests.js:
// routes/demo/requests.js — /log-levels demo (uses module-level logger)
router.get('/log-levels', (req, res) => {
  const userId = req.query.userId || 'demo-user-123';

  logger.debug('Debug level log - detailed diagnostic info', {
    userId,
    endpoint: '/api/requests/log-levels',
    cacheStatus: 'miss',
  });

  logger.info('Info level log - normal operational message', {
    userId,
    action: 'log-levels-demo',
  });

  logger.warn('Warn level log - potential issue detected', {
    userId,
    warning: 'Demo warning: userId parameter not provided',
  });

  logger.error('Error level log - application error', {
    userId,
    errorCode: 'DEMO_ERROR',
    severity: 'high',
  });

  res.json({ message: 'Log level examples generated' });
});

// Use req.logger when you need correlationId auto-injected per request:
router.post('/user-login', (req, res) => {
  const { username } = req.body;
  req.logger.info('User login successful', { username });   // ← correlationId bound automatically
  res.json({ correlationId: req.correlationId });
});
| Command/Code | Purpose |
|---|---|
router.get('/log-levels', ...) | Exposes a demo endpoint that emits logs at multiple levels |
logger.debug/info/warn/error(...) | Writes structured log entries with different severities |
router.post('/user-login', ...) | Demonstrates request-scoped logging during a POST operation |
req.logger.info(...) | Writes a log entry with the request correlationId already attached |
res.json({ correlationId: req.correlationId }) | Returns the correlation ID so the request can be traced later |
stdout — one JSON line per call:
{"timestamp":"2025-01-02T10:30:34.100Z","level":"debug","message":"Cache lookup","service":"app-service-reference","environment":"production","correlationId":"a1b2c3d4","userId":"demo-user-123","cacheStatus":"miss"}
{"timestamp":"2025-01-02T10:30:34.101Z","level":"info","message":"Request processed","service":"app-service-reference","environment":"production","correlationId":"a1b2c3d4","userId":"demo-user-123","action":"log-levels-demo"}
{"timestamp":"2025-01-02T10:30:34.102Z","level":"warn","message":"Rate limit approaching","service":"app-service-reference","environment":"production","correlationId":"a1b2c3d4","userId":"demo-user-123","remaining":3}
{"timestamp":"2025-01-02T10:30:34.103Z","level":"error","message":"Quota exceeded","service":"app-service-reference","environment":"production","correlationId":"a1b2c3d4","userId":"demo-user-123","errorCode":"QUOTA_EXCEEDED"}
| Command/Code | Purpose |
|---|---|
timestamp | Shows when each log event was emitted |
level | Shows the severity of the log event |
message | Contains the main event description |
correlationId | Links all log lines that belong to the same request |
userId and other custom fields | Preserve business context for filtering in KQL |
Pattern 2 — External Dependency Tracking
Always record the URL, status code, and elapsed time so you can diagnose slow or failing dependencies in Application Insights. See apps/nodejs/src/routes/demo/dependencies.js:
// routes/demo/dependencies.js
router.get('/external', async (req, res) => {
  const apiUrl = 'https://jsonplaceholder.typicode.com/posts/1';
  const start = Date.now();

  try {
    const response = await fetch(apiUrl, { signal: AbortSignal.timeout(10_000) });
    const duration = Date.now() - start;

    req.logger.info('External API call successful', {
      url: apiUrl,
      statusCode: response.status,
      duration,
    });
    res.json({ data: await response.json(), duration });

  } catch (err) {
    const duration = Date.now() - start;
    req.logger.error('External API call failed', {
      url: apiUrl,
      error: err.message,
      duration,
    });
    res.status(503).json({ error: 'Service Unavailable', correlationId: req.correlationId });
  }
});
| Command/Code | Purpose |
|---|---|
router.get('/external', ...) | Defines a demo endpoint that calls an external API |
const start = Date.now(); | Captures the start time so request duration can be measured |
await fetch(apiUrl, { signal: AbortSignal.timeout(10_000) }) | Calls the external dependency with a 10-second timeout |
req.logger.info(...) | Records a successful dependency call with timing and status details |
req.logger.error(...) | Records a failed dependency call with error context |
res.status(503).json(...) | Returns a failure response when the dependency call does not succeed |
stdout on timeout:
{
  "timestamp": "2025-01-02T10:30:44.234Z",
  "level": "error",
  "message": "External API call failed",
  "service": "app-service-reference",
  "environment": "production",
  "correlationId": "a1b2c3d4-e5f6-7890-abcd-ef1234567890",
  "url": "https://jsonplaceholder.typicode.com/posts/1",
  "error": "The operation was aborted due to timeout",
  "duration": 10043
| Command/Code | Purpose |
|--------------|---------|
| `timestamp` | Shows when the dependency failure was logged |
| `level` | Indicates the event is an error |
| `message` | Describes the failed external call |
| `correlationId` | Links the dependency failure to the original request |
| `url`, `error`, `duration` | Capture the failing dependency, error detail, and elapsed time |

### Pattern 3 — Unhandled Exception Logging

`apps/nodejs/src/server.js` catches all unhandled errors in the Express error handler and logs them
with full context before returning an error response:

```js
// server.js — global error handler
app.use((err, req, res, next) => {
  logger.error('Unhandled error', {
    error: err.message,
    stack: err.stack,
    url: req.originalUrl,
    method: req.method,
    correlationId: req.correlationId,
  });

  res.status(err.status || 500).json({
    error: 'Internal Server Error',
    message: process.env.NODE_ENV === 'production' ? 'An error occurred' : err.message,
    correlationId: req.correlationId,
  });
});

// Catch unhandled Promise rejections (e.g. async routes that forget try/catch)
process.on('unhandledRejection', (reason) => {
  logger.error('Unhandled Promise Rejection', {
    reason: reason instanceof Error ? reason.message : reason,
    stack: reason instanceof Error ? reason.stack : undefined,
  });
});
| Command/Code | Purpose |
|---|---|
app.use((err, req, res, next) => { ... }) | Handles uncaught Express errors in one place |
logger.error('Unhandled error', ...) | Logs the error with request context before returning a response |
res.status(err.status || 500).json(...) | Sends a safe HTTP error response to the client |
process.on('unhandledRejection', ...) | Captures rejected promises that were not otherwise handled |
In advanced mode this entry lands in AppTraces (SeverityLevel 3). Separate exception telemetry may also appear in AppExceptions when the OTel SDK captures the error object, but the two records are not guaranteed to be identical or always co-emitted.
Advanced Mode (Winston + OpenTelemetry)
apps/nodejs/src/config/telemetry/advanced.js adds Winston and ships telemetry directly to Application Insights via the OpenTelemetry SDK. The logger.error(...) call above lands in Application Insights as:
- Table:
AppTraces - SeverityLevel:
3(Error) - Properties:
{ correlationId, url, error, duration }
Log Levels & Filtering
There are two independent filters that control what you see. Confusing one for the other is a common source of "I can't see my logs" issues.
flowchart TD
    subgraph APP ["1 · Your App  LOG_LEVEL=warn"]
        direction TB
        D["debug"] -->|"suppressed"| SX1[" "]
        I["info"]  -->|"suppressed"| SX2[" "]
        W["warn"]  --> OUT["stdout"]
        E["error"] --> OUT
    end

    OUT --> RT["App Service Runtime"]

    RT -->|"2 · --level error\nfilesystem filter"| FS["/home/LogFiles\nerror only"]
RT -->|"always passes stdout\nno extra filter"| AI["Application Insights\nwarn + error\n(advanced mode only)"]| Filter | Controls | Affects |
|---|---|---|
LOG_LEVEL env var | What your app sends to stdout | stdout, /home/LogFiles, App Insights |
az webapp log config --level | What App Service writes to /home/LogFiles | Filesystem only — not App Insights |
App Insights is not filtered by --level
Setting --level error on the filesystem does not suppress info logs from Application Insights. Only raising LOG_LEVEL in your app controls what reaches App Insights.
Node.js Level → Application Insights Severity
| Node.js Level | LOG_LEVEL value | App Insights severityLevel | KQL filter |
|---|---|---|---|
debug | debug | 0 — Verbose | SeverityLevel == 0 |
http | http | 0 — Verbose | SeverityLevel == 0 |
info | info (default) | 1 — Information | SeverityLevel == 1 |
warn | warn | 2 — Warning | SeverityLevel == 2 |
error | error | 3 — Error | SeverityLevel == 3 |
Change Log Level
App Setting changes restart the app
Changing LOG_LEVEL via App Settings triggers an app restart — there is no hot-reload. The log level is read at startup from process.env.LOG_LEVEL.
# Production: suppress debug and http to reduce noise and cost
az webapp config appsettings set \
  --resource-group $RG \
  --name $APP_NAME \
  --settings LOG_LEVEL=warn

# Incident investigation: enable debug temporarily
az webapp config appsettings set \
  --resource-group $RG \
  --name $APP_NAME \
  --settings LOG_LEVEL=debug
| Command/Code | Purpose |
|---|---|
az webapp config appsettings set ... --settings LOG_LEVEL=warn | Lowers log volume in production by suppressing lower-severity entries |
az webapp config appsettings set ... --settings LOG_LEVEL=debug | Temporarily enables verbose logs during an incident investigation |
Remember to revert after debugging
debug level can emit sensitive data and significantly increase Application Insights ingestion costs. Set LOG_LEVEL=info or warn again once the incident is resolved.
Correlation ID — Tracing a Single Request
apps/nodejs/src/middleware/correlation.js injects a unique correlationId into every request and binds it to req.logger so all log lines for the same request share the same ID automatically:
sequenceDiagram
    participant Client
    participant App as Node.js App
    participant AI as Application Insights

    Client->>App: POST /api/orders
    Note over App: generate UUID a1b2c3d4
    App->>App: req.logger = logger.child({ correlationId })
    App->>AI: info "Order validated" { correlationId: a1b2c3d4 }
    App->>AI: info "Payment processed" { correlationId: a1b2c3d4 }
    App->>AI: info "HTTP Request" { statusCode: 201, duration: 143ms }
    App->>Client: 201 Created + X-Correlation-ID: a1b2c3d4
When a user reports an error, ask for the X-Correlation-ID response header value and use it to pull every log line for that single request from Application Insights.
Step 3 — Enable App Service Log Capture
Enable filesystem logging so stdout/stderr is persisted to /home/LogFiles:
az webapp log config \
  --resource-group $RG \
  --name $APP_NAME \
  --application-logging filesystem \
  --level verbose \
  --output json
| Command/Code | Purpose |
|---|---|
az webapp log config ... --application-logging filesystem --level verbose --output json | Enables verbose filesystem logging and returns the applied configuration |
Example output:
{
  "applicationLogs": {
    "azureBlobStorage": {
      "level": "Off",
      "retentionInDays": null,
      "sasUrl": null
    },
    "azureTableStorage": {
      "level": "Off",
      "sasUrl": null
    },
    "fileSystem": {
      "level": "Verbose"
    }
  },
  "httpLogs": {
    "azureBlobStorage": {
      "enabled": false,
      "retentionInDays": 3,
      "sasUrl": null
    },
    "fileSystem": {
      "enabled": true,
      "retentionInDays": 3,
      "retentionInMb": 100
    }
  }
}
| Command/Code | Purpose |
|---|---|
applicationLogs.fileSystem.level | Shows the filesystem log verbosity level |
httpLogs.fileSystem.enabled | Shows whether HTTP access logging is enabled |
retentionInDays / retentionInMb | Show how long and how much log data App Service keeps |
Step 4 — Real-time Log Stream
Tail live logs directly in your terminal — useful during deployments and smoke tests:
| Command/Code | Purpose |
|---|---|
az webapp log tail --resource-group $RG --name $APP_NAME | Streams live logs from the App Service instance |
Press Ctrl+C to exit. Your JSON log lines appear interleaved with platform events (health probes, container restarts, etc).
Filter to app logs only (jq):
| Command/Code | Purpose |
|---|---|
az webapp log tail ... | Streams live platform and application logs |
grep --line-buffered '"level"' | Filters the stream to JSON application log lines that include a log level |
Step 5 — Browse Logs on the Filesystem
All stdout/stderr written by your container is stored under /home/LogFiles on the shared persistent storage that survives container restarts.
/home/LogFiles/
├── <hostname>_docker.log              ← Container stdout, always written
├── Application/
│   └── <date>_<hostname>_default_docker.log   ← App logs (filesystem logging enabled)
└── kudu/
    └── deployment/                    ← Deployment / build logs
Access via Kudu (browser):
https://<APP_NAME>.scm.azurewebsites.net
  → Debug Console → Bash
  → ls /home/LogFiles
  → tail -100 /home/LogFiles/Application/*.log
Download all logs as a zip:
az webapp log download \
  --resource-group $RG \
  --name $APP_NAME \
  --log-file ./logs.zip

unzip logs.zip -d ./logs
| Command/Code | Purpose |
|---|---|
az webapp log download ... --log-file ./logs.zip | Downloads the current App Service logs as a zip archive |
unzip logs.zip -d ./logs | Extracts the downloaded logs into a local folder |
Linux Limitation
This command may not work with web apps running on Linux. Use log streaming, the Azure Portal's Log stream blade, or access logs directly via /home/LogFiles as alternatives.
SSH and tail live:
az webapp ssh --resource-group $RG --name $APP_NAME

# Inside the container:
tail -f /home/LogFiles/*_docker.log
| Command/Code | Purpose |
|---|---|
az webapp ssh --resource-group $RG --name $APP_NAME | Opens an interactive SSH session into the running App Service container |
tail -f /home/LogFiles/*_docker.log | Follows the live container log file from inside the container |
Step 6 — Application Insights
Application Insights collects telemetry into four queryable tables when either:
TELEMETRY_MODE=advanced— the app initializes the OTel SDK at startup (seeapps/nodejs/src/config/telemetry/advanced.js), or- The App Service Application Insights agent is enabled in the portal (App Service → Application Insights → Turn on).
Setting APPLICATIONINSIGHTS_CONNECTION_STRING alone is not sufficient — telemetry only reaches Application Insights when one of the above paths is active.
Query location matters
Table names differ by where you run the query. See KQL Queries Reference — Table Naming for details.
- Application Insights → Logs:
traces,requests,dependencies - Log Analytics Workspace → Logs:
AppTraces,AppRequests,AppDependencies
What Gets Collected
graph TD
    A["logger.info / warn / error\nWinston"] -->|"OTel SDK export\n(advanced mode)"| B["AppTraces"]
    C["HTTP requests\nExpress router"] -->|"OTel auto-instrumented"| D["AppRequests"]
    E["External calls\nfetch / axios / http"] -->|"OTel auto-instrumented"| F["AppDependencies"]
    G["Unhandled exceptions\nprocess.on unhandledRejection"] -->|"OTel export"| H["AppExceptions"]
Verify the Connection
az webapp config appsettings list \
  --resource-group $RG \
  --name $APP_NAME \
  --query "[?name=='APPLICATIONINSIGHTS_CONNECTION_STRING']"
| Command/Code | Purpose |
|---|---|
az webapp config appsettings list ... --query "[?name=='APPLICATIONINSIGHTS_CONNECTION_STRING']" | Checks whether the App Insights connection string is configured |
Access Application Insights
- Azure Portal → search for your Application Insights resource
- Logs → paste KQL queries below
- Live Metrics → real-time request rate, failure rate, and server telemetry
KQL — Find All Logs for One Request
Use the correlationId from the X-Correlation-ID response header:
AppTraces
| where TimeGenerated > ago(24h)
| extend correlationId = tostring(Properties["correlationId"])
| where correlationId == "a1b2c3d4-e5f6-7890-abcd-ef1234567890"
| project TimeGenerated, SeverityLevel, Message, Properties
| order by TimeGenerated asc
KQL — Recent Errors with Context
AppTraces
| where TimeGenerated > ago(1h)
| where SeverityLevel == 3
| extend
    correlationId = tostring(Properties["correlationId"]),
    userId        = tostring(Properties["userId"]),
    errorCode     = tostring(Properties["errorCode"])
| project TimeGenerated, Message, correlationId, userId, errorCode
| order by TimeGenerated desc
KQL — Error Rate Over Time
AppRequests
| where TimeGenerated > ago(6h)
| summarize
    total  = count(),
    failed = countif(Success == false)
  by bin(TimeGenerated, 5m)
| extend errorRate = (failed * 100.0) / total
| render timechart
KQL — Slowest Requests
AppRequests
| where TimeGenerated > ago(1h)
| top 10 by DurationMs desc
| project TimeGenerated, Name, DurationMs, ResultCode, Success
End-to-End Debugging Scenario
A user reports an error and provides X-Correlation-ID: a1b2c3d4.
1. If the issue is happening now — tail live logs:
| Command/Code | Purpose |
|---|---|
az webapp log tail ... | Streams current logs from the web app |
grep --line-buffered a1b2c3d4 | Filters the stream to log lines for one correlation ID |
2. If the error occurred earlier — query Application Insights:
AppTraces
| where TimeGenerated > ago(24h)
| extend correlationId = tostring(Properties["correlationId"])
| where correlationId == "a1b2c3d4"
| order by TimeGenerated asc
3. Reconstruct the full request chain:
let cid = "a1b2c3d4-e5f6-7890-abcd-ef1234567890";
// Traces for this correlation ID
let traces =
    AppTraces
    | where TimeGenerated > ago(24h)
    | extend correlationId = tostring(Properties["correlationId"])
    | where correlationId == cid
    | project TimeGenerated, Kind = "trace", Detail = Message, SeverityLevel;
// Requests whose OTel operation_Id matches any trace in this correlation
let requests =
    AppRequests
    | where TimeGenerated > ago(24h)
    | extend correlationId = tostring(Properties["correlationId"])
    | where correlationId == cid
    | project TimeGenerated, Kind = "request", Detail = Name, SeverityLevel = toint(-1);
union traces, requests
| order by TimeGenerated asc
Verification Steps
-
Generate logs at all levels using the demo endpoint:
Command/Code Purpose curl https://$APP_NAME.azurewebsites.net/api/requests/log-levelsGenerates sample logs in the deployed app for verification -
Confirm JSON lines appear in the log stream:
Command/Code Purpose az webapp log tail --resource-group $RG --name $APP_NAMEConfirms the generated logs appear in the live stream -
Wait 2–3 minutes, then run a KQL query to confirm data reached Application Insights:
Deployment Test Results
The following output was captured from a live deployment to Azure App Service (Korea Central) on 2026-04-02.
Environment:
Resource Group:   rg-appservice-nodejs-guide
Web App:          app-appservice-nodejs-guide-gdzb56lzygs2u
App Insights:     appi-appservice-nodejs-guide
Log Analytics:    log-appservice-nodejs-guide
Region:           koreacentral
TELEMETRY_MODE:   advanced
Step 1 — Enable Filesystem Logging
az webapp log config \
  --resource-group $RG \
  --name $APP_NAME \
  --application-logging filesystem \
  --level verbose
| Command/Code | Purpose |
|---|---|
az webapp log config ... --application-logging filesystem --level verbose | Enables verbose filesystem logging during the deployment test |
Output:
{
  "applicationLogs": {
    "fileSystem": {
      "level": "Verbose",
      "retentionInDays": null,
      "retentionInMb": 35
    }
  },
  "detailedErrorMessages": { "enabled": false },
  "failedRequestsTracing": { "enabled": false },
  "httpLogs": {
    "fileSystem": { "enabled": false, "retentionInDays": 3, "retentionInMb": 35 },
    "azureBlobStorage": { "enabled": false, "retentionInDays": null }
  }
}
| Command/Code | Purpose |
|---|---|
applicationLogs.fileSystem.level | Confirms the application log level stored on disk |
httpLogs.fileSystem | Shows whether HTTP log capture is enabled and its limits |
detailedErrorMessages / failedRequestsTracing | Show the state of other diagnostic features |
Step 2 — Confirm JSON Logs in Filesystem
| Command/Code | Purpose |
|---|---|
az webapp log tail --resource-group $RG --name $APP_NAME | Streams the live log output used in the deployment test |
Sample output from /home/LogFiles/2026_04_02_lw1sdlwk00086E_default_docker.log:
2026-04-02T13:45:23.5947368Z ✅ Application Insights initialized (OpenTelemetry)
2026-04-02T13:45:23.7069787Z {"appInsightsEnabled":true,"environment":"production","level":"info","message":"Advanced telemetry initialized","timestamp":"2026-04-02T13:45:23.697Z"}
2026-04-02T13:41:16.0491463Z {"level":"error","message":"Error level log - application error","errorCode":"DEMO_ERROR","severity":"high","timestamp":"2026-04-02T13:41:16.035Z"}
2026-04-02T13:41:24.6814613Z {"level":"info","message":"External API call successful","url":"https://jsonplaceholder.typicode.com/posts/1","statusCode":200,"duration":392}
What you see
Structured JSON logs appear in real time. Each line is a parseable JSON object with level, message, and any additional context fields.
Step 3 — Verify Application Insights: AppTraces
After calling GET /api/requests/log-levels, the four log levels appear in AppTraces within 2–3 minutes:
AppTraces
| where TimeGenerated > ago(10m)
| project TimeGenerated, SeverityLevel, Message
| order by TimeGenerated desc
| take 10
Actual results:
TimeGenerated                 SeverityLevel  Message
────────────────────────────  ─────────────  ──────────────────────────────────────────
2026-04-02T13:54:08.74Z       1              External API call successful
2026-04-02T13:54:07.487Z      3              Error level log - application error
2026-04-02T13:54:07.487Z      2              Warn level log - potential issue detected
2026-04-02T13:54:07.486Z      1              Info level log - normal operational message
SeverityLevel mapping: 1 = Information, 2 = Warning, 3 = Error.
Step 4 — Verify Application Insights: AppRequests
HTTP requests are tracked automatically by the OTel SDK:
AppRequests
| where TimeGenerated > ago(10m)
| project TimeGenerated, Name, DurationMs, ResultCode, Success
| order by TimeGenerated desc
| take 5
Actual results:
TimeGenerated                 Name                              DurationMs  ResultCode  Success
────────────────────────────  ────────────────────────────────  ──────────  ──────────  ───────
2026-04-02T13:56:56.216Z      GET /api/requests/log-levels      34          200         true
2026-04-02T14:04:03.597Z      POST /api/requests/user-login     533         200         true
2026-04-02T14:04:05.022Z      POST /api/requests/create-order   20          201         true
2026-04-02T14:01:46.115Z      GET /api/dependencies/external    65          200         true
Step 5 — Verify correlationId Tracing
Send a request with an explicit X-Correlation-ID header:
CORR_ID="verify-corr-$(date +%s)"

# Trigger two operations under the same correlation ID
curl -X POST \
  -H "Content-Type: application/json" \
  -H "X-Correlation-ID: $CORR_ID" \
  -d '{"username":"testuser","loginMethod":"password"}' \
  https://$APP_NAME.azurewebsites.net/api/requests/user-login

curl -X POST \
  -H "Content-Type: application/json" \
  -H "X-Correlation-ID: $CORR_ID" \
  -d '{"items":[{"id":"item-1","name":"Widget","price":9.99}],"totalAmount":9.99}' \
  https://$APP_NAME.azurewebsites.net/api/requests/create-order
| Command/Code | Purpose |
|---|---|
CORR_ID="verify-corr-$(date +%s)" | Creates a unique correlation ID for the test run |
curl -X POST ... /api/requests/user-login | Sends a login request tagged with the shared correlation ID |
curl -X POST ... /api/requests/create-order | Sends an order request using the same correlation ID |
-H "X-Correlation-ID: $CORR_ID" | Forces both requests to share the same trace identifier |
Response (user-login):
{
  "message": "Login successful",
  "userId": "user-1775138644080",
  "correlationId": "verify-corr-1775138644"
}
| Command/Code | Purpose |
|---|---|
message | Confirms the login operation succeeded |
userId | Returns the generated user identifier from the sample app |
correlationId | Returns the trace ID used to connect related operations |
Response (create-order):
{
  "message": "Order created successfully",
  "orderId": "order-1775138645031",
  "itemCount": 1,
  "totalAmount": 9.99,
  "correlationId": "verify-corr-1775138644"
}
| Command/Code | Purpose |
|---|---|
message | Confirms the order operation succeeded |
orderId | Returns the generated order identifier |
itemCount | Shows how many items were submitted |
totalAmount | Shows the order total processed by the route |
correlationId | Confirms the order used the same trace ID as the login request |
After 2–3 minutes, query by correlationId in KQL:
AppTraces
| where TimeGenerated > ago(10m)
| extend cid = tostring(Properties["correlationId"])
| where cid == "verify-corr-1775138644"
| project TimeGenerated, SeverityLevel, Message, cid
| order by TimeGenerated asc
Actual results — both operations linked by the same correlationId:
TimeGenerated              SeverityLevel  Message                cid
─────────────────────────  ─────────────  ─────────────────────  ──────────────────────────
2026-04-02T14:04:04.079Z   1              User login successful   verify-corr-1775138644
2026-04-02T14:04:05.032Z   1              Order created          verify-corr-1775138644
Distributed tracing confirmed
Two separate requests — login and order creation — are linked under a single correlationId. This makes it trivial to reconstruct an end-to-end user journey in Application Insights.
Step 6 — AppDependencies (External Calls)
External HTTP calls are tracked as dependencies via the OTel SDK:
AppDependencies
| where TimeGenerated > ago(30m)
| project TimeGenerated, Name, Target, DurationMs, Success
| order by TimeGenerated desc
| take 5
Actual results:
TimeGenerated              Name  Target                              DurationMs  Success
─────────────────────────  ────  ──────────────────────────────────  ──────────  ───────
2026-04-02T13:54:08.318Z   GET   jsonplaceholder.typicode.com        429         true
2026-04-02T14:01:46.115Z   GET   jsonplaceholder.typicode.com        64          true
Next Steps
- Operations Guide — scaling, slots, health checks
- KQL Queries Reference — full query library
- Troubleshooting & Debugging — Kudu, SSH, common issues
Advanced Topics
Coming Soon
- Custom log processing with Azure Functions
- Log-based alerting and action groups
- Integration with external log aggregators (Elastic, Splunk, Datadog)
Run It in the Portal
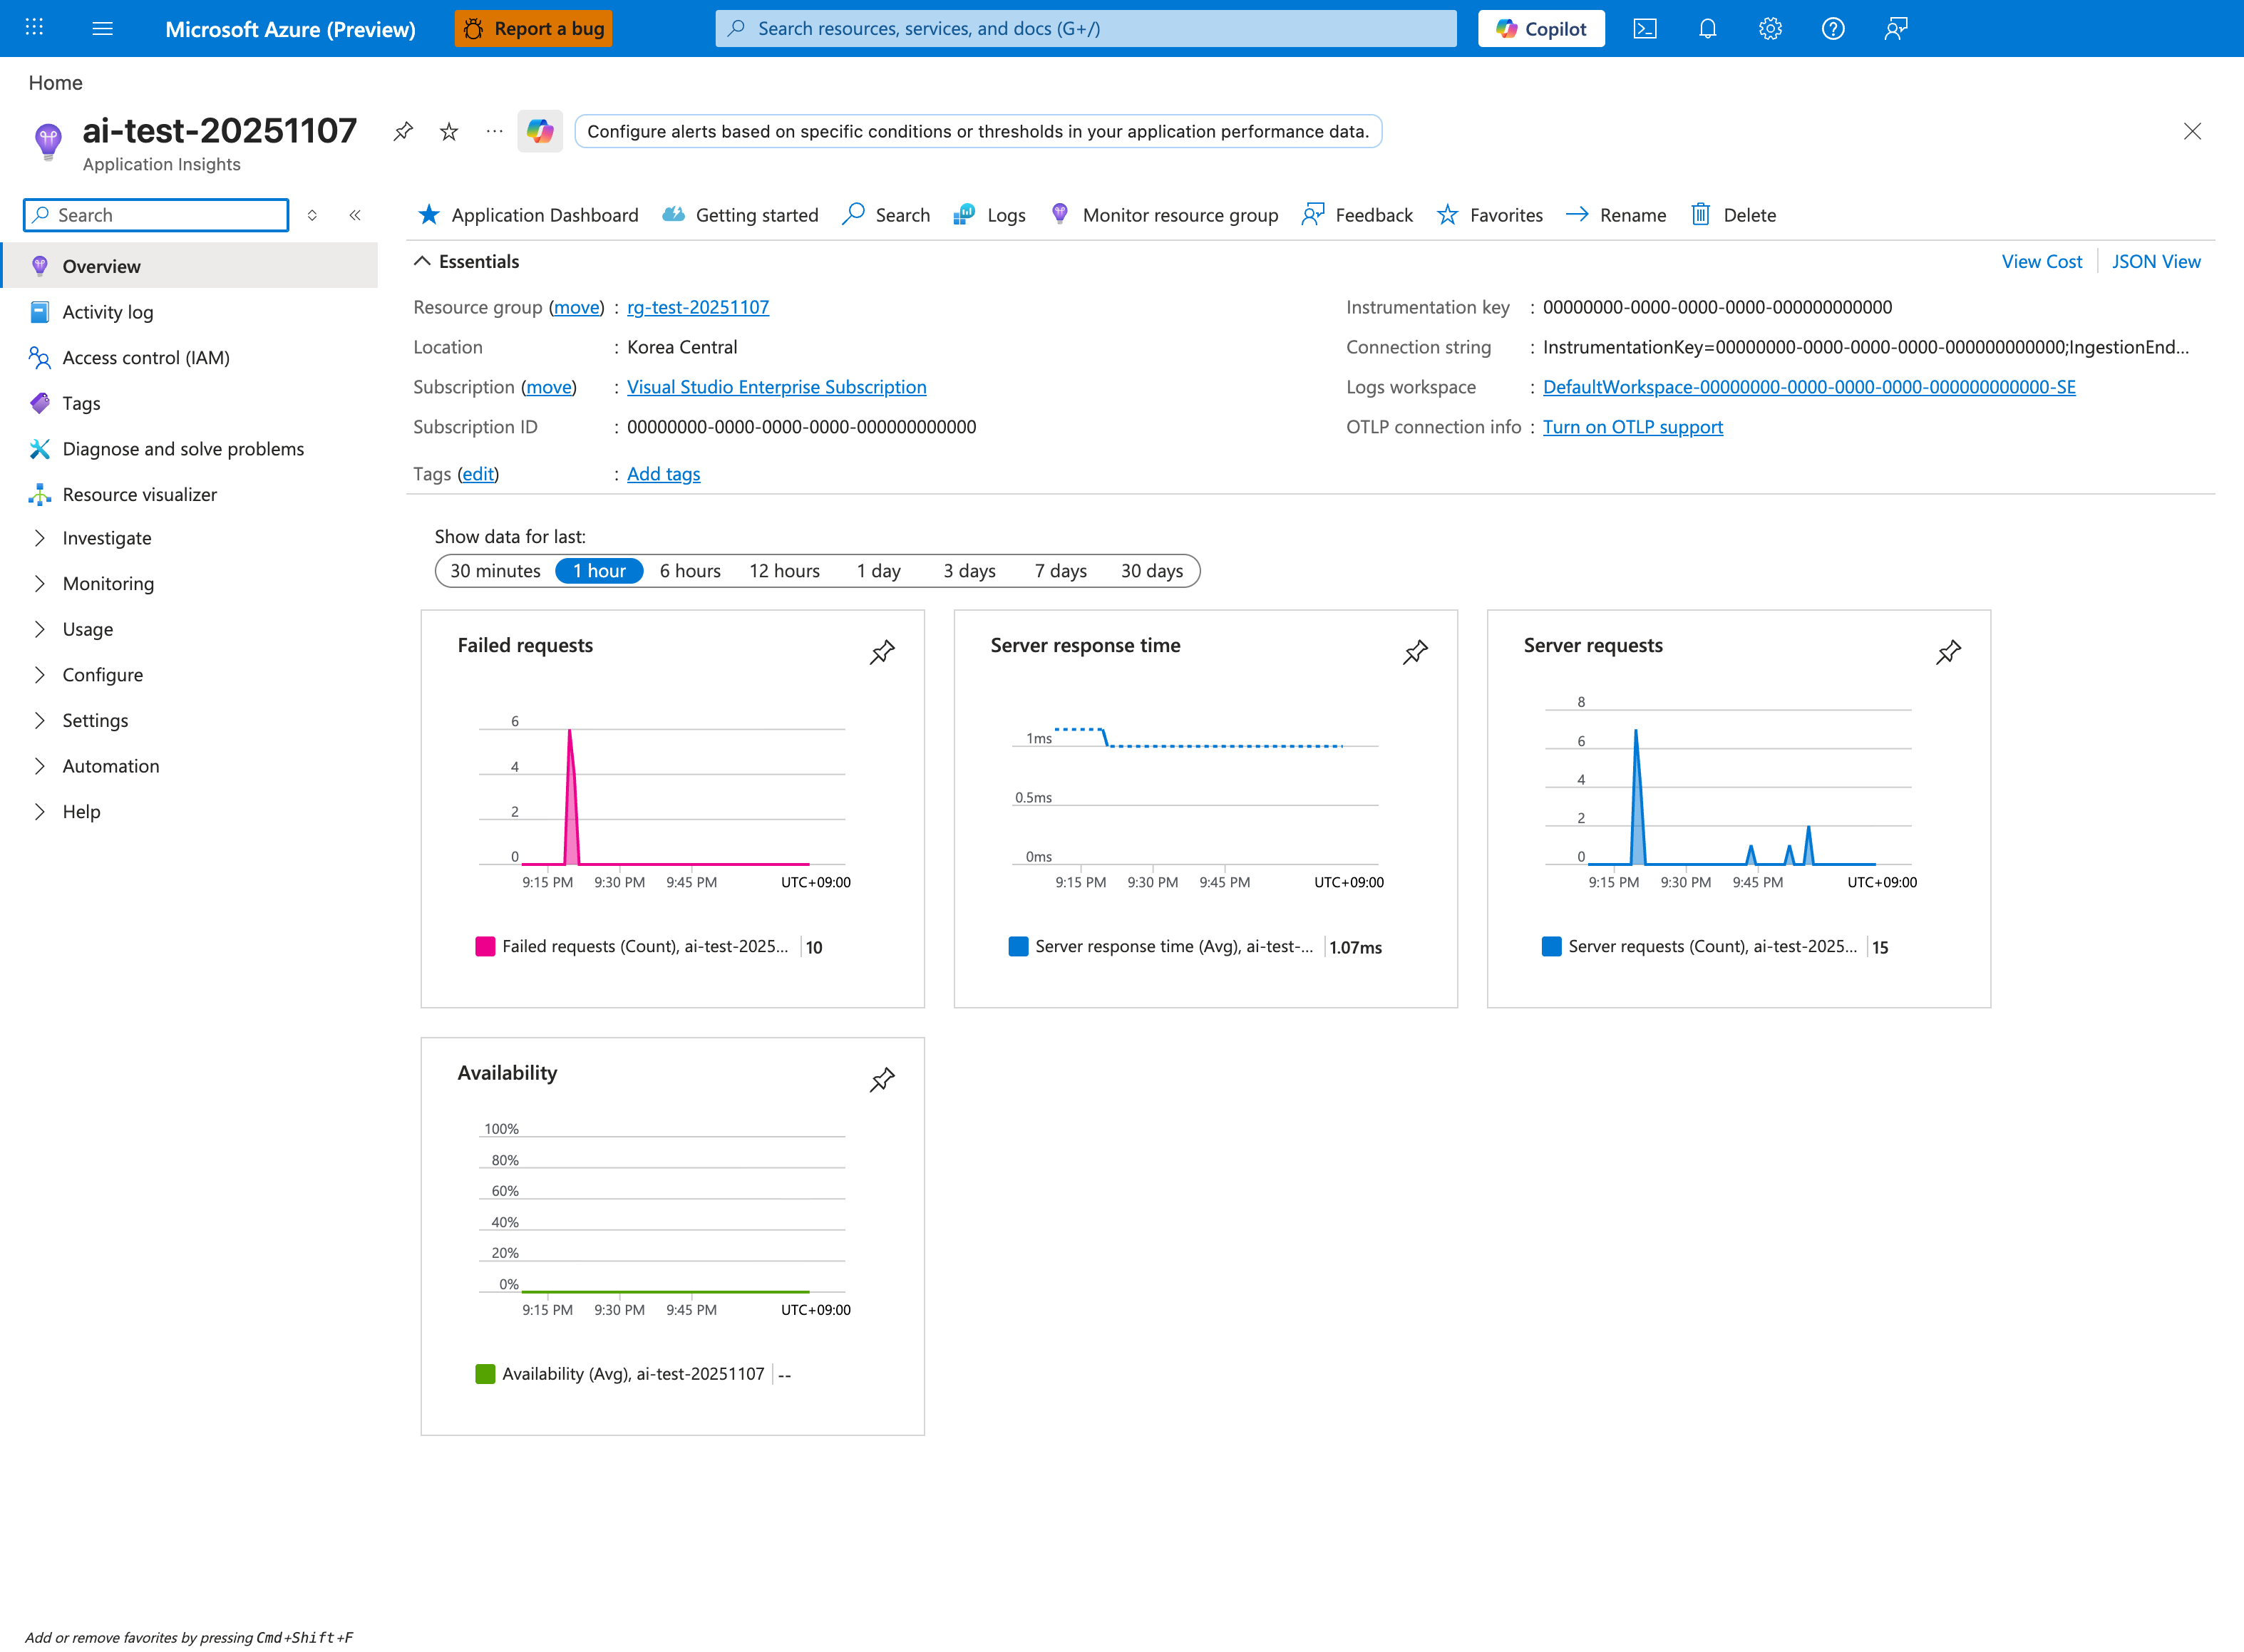
Portal view: Application Insights Overview blade (telemetry destination for this tutorial)
This Application Insights Overview blade is the Portal destination for the telemetry configured in this Node.js tutorial. The Connection string shown in Essentials corresponds to the APPLICATIONINSIGHTS_CONNECTION_STRING setting that the applicationinsights package on the Express app reads at startup, while the pinned tiles give a quick summary of what the app is emitting. In this screenshot, Server requests, Failed requests, and Server response time line up with the request, failure, and latency signals that the tutorial later inspects in AppRequests, AppExceptions, and AppTraces. Use the Logs button in the top toolbar to open the KQL surface for the query steps in the End-to-End Debugging Scenario section above.