04. Logging & Monitoring
Instrument your Spring Boot app for production observability using Logback JSON logs, Azure Monitor, and Application Insights.
Infrastructure Context
Service: App Service (Linux, Standard S1) | Network: VNet integrated | VNet: ✅
This tutorial assumes a production-ready App Service deployment with VNet integration, private endpoints for backend services, and managed identity for authentication.
flowchart TD
    INET[Internet] -->|HTTPS| WA["Web App\nApp Service S1\nLinux Java 17"]

    subgraph VNET["VNet 10.0.0.0/16"]
        subgraph INT_SUB["Integration Subnet 10.0.1.0/24\nDelegation: Microsoft.Web/serverFarms"]
            WA
        end
        subgraph PE_SUB["Private Endpoint Subnet 10.0.2.0/24"]
            PE_KV[PE: Key Vault]
            PE_SQL[PE: Azure SQL]
            PE_ST[PE: Storage]
        end
    end

    PE_KV --> KV[Key Vault]
    PE_SQL --> SQL[Azure SQL]
    PE_ST --> ST[Storage Account]

    subgraph DNS[Private DNS Zones]
        DNS_KV[privatelink.vaultcore.azure.net]
        DNS_SQL[privatelink.database.windows.net]
        DNS_ST[privatelink.blob.core.windows.net]
    end

    PE_KV -.-> DNS_KV
    PE_SQL -.-> DNS_SQL
    PE_ST -.-> DNS_ST

    WA -.->|System-Assigned MI| ENTRA[Microsoft Entra ID]
    WA --> AI[Application Insights]

    style WA fill:#0078d4,color:#fff
    style VNET fill:#E8F5E9,stroke:#4CAF50
    style DNS fill:#E3F2FD
Prerequisites
- Completed 02. First Deploy
- Access to App Service and Application Insights resources
- Deployed app with
APPLICATIONINSIGHTS_CONNECTION_STRINGconfigured
What you'll learn
- How
logback-spring.xmlswitches between dev and production formats - How to stream and query logs from App Service
- How to run practical KQL queries for Java workloads
- How to validate telemetry with sample endpoints
Main Content
Logging architecture for this guide
flowchart TD
    A[Spring Boot App] --> B[Console Logback Output]
    B --> C[App Service Log Stream]
    B --> D[Application Insights]
    D --> E[Log Analytics Workspace]
    E --> F[KQL Queries / Alerts]
Understand logback-spring.xml
The app uses profile-aware logging:
!production: human-readable pattern logs for local developmentproduction: JSON logs vianet.logstash.logback.encoder.LoggingEventCompositeJsonEncoder
Relevant production fields include:
timestamplevelthreadloggermessageexception
This shape is ideal for parsing in Azure Monitor.
Generate predictable test logs
Use the built-in endpoint:
| Command/Code | Purpose |
|---|---|
curl "https://$APP_NAME.azurewebsites.net/api/requests/log-levels?userId=monitor-demo" | Calls the sample endpoint that emits predictable logs across multiple severities. |
The endpoint emits one log per severity (DEBUG/INFO/WARN/ERROR).
Stream logs in real time
| Command/Code | Purpose |
|---|---|
az webapp log tail | Opens the live App Service log stream. |
--resource-group "$RG" | Targets the resource group that contains the app. |
--name "$APP_NAME" | Selects the web app whose logs should be streamed. |
If log stream is empty, ensure application logging is enabled.
Enable filesystem logging (short-term troubleshooting)
az webapp log config \
  --resource-group "$RG" \
  --name "$APP_NAME" \
  --application-logging filesystem \
  --level information \
  --output json
| Command/Code | Purpose |
|---|---|
az webapp log config | Configures App Service application logging behavior. |
--application-logging filesystem | Writes application logs to the local App Service filesystem. |
--level information | Captures logs at information level and above. |
--output json | Returns the logging configuration as JSON. |
Production guidance
Prefer central telemetry in Application Insights for long-term analytics. Filesystem logs are best for short-lived debugging.
Query location matters
Table names differ by where you run the query. See KQL Queries Reference — Table Naming for details.
- Application Insights → Logs:
traces,requests,dependencies - Log Analytics Workspace → Logs:
AppTraces,AppRequests,AppDependencies
KQL query: recent application logs
AppTraces
| where TimeGenerated > ago(30m)
| where AppRoleName contains "app-"
| project TimeGenerated, SeverityLevel, Message, AppRoleName
| order by TimeGenerated desc
KQL query: error distribution
AppTraces
| where TimeGenerated > ago(24h)
| where SeverityLevel >= 3
| summarize ErrorCount = count() by bin(TimeGenerated, 15m), AppRoleName
| order by TimeGenerated asc
KQL query: request latency percentiles
AppRequests
| where TimeGenerated > ago(24h)
| summarize
    RequestCount = count(),
    P50 = percentile(DurationMs, 50),
    P95 = percentile(DurationMs, 95),
    P99 = percentile(DurationMs, 99)
  by Name
| order by P95 desc
KQL query: correlate failed requests with traces
let failed = AppRequests
| where TimeGenerated > ago(6h)
| where Success == false
| project OperationId, Name, ResultCode, DurationMs, TimeGenerated;

failed
| join kind=leftouter (
    AppTraces
    | where TimeGenerated > ago(6h)
    | project OperationId, TraceMessage = Message, SeverityLevel
) on OperationId
| order by TimeGenerated desc
Alerting baseline recommendation
- Alert on sustained
5xxrate - Alert on
P95latency regression - Alert on no heartbeat/traffic during business windows
Use synthetic probes
Add availability tests against /health and a lightweight business endpoint to catch platform and app regressions early.
Platform architecture
For platform architecture details, see Platform: How App Service Works.
Verification
- Trigger
/api/requests/log-levels - Confirm logs appear in
az webapp log tail - Run KQL queries and verify rows return for the current app
- Confirm production profile emits JSON-formatted logs
Troubleshooting
No telemetry in Application Insights
- Confirm
APPLICATIONINSIGHTS_CONNECTION_STRINGexists in App Settings - Confirm app restarted after config change
- Wait a few minutes for ingestion delay
Logs show only INFO and above
Adjust logger level temporarily:
az webapp config appsettings set \
  --resource-group "$RG" \
  --name "$APP_NAME" \
  --settings LOGGING_LEVEL_COM_EXAMPLE_GUIDE=DEBUG \
  --output json
| Command/Code | Purpose |
|---|---|
az webapp config appsettings set | Updates app settings to temporarily increase logging detail. |
--settings LOGGING_LEVEL_COM_EXAMPLE_GUIDE=DEBUG | Raises the sample package log level to DEBUG. |
--output json | Returns the updated app settings in JSON format. |
KQL table names differ in your workspace
Use AppTraces/AppRequests as primary tables; in some environments, schema naming may vary by ingestion mode.
Run It in the Portal
Portal view: Application Insights Overview blade (telemetry destination for this tutorial)
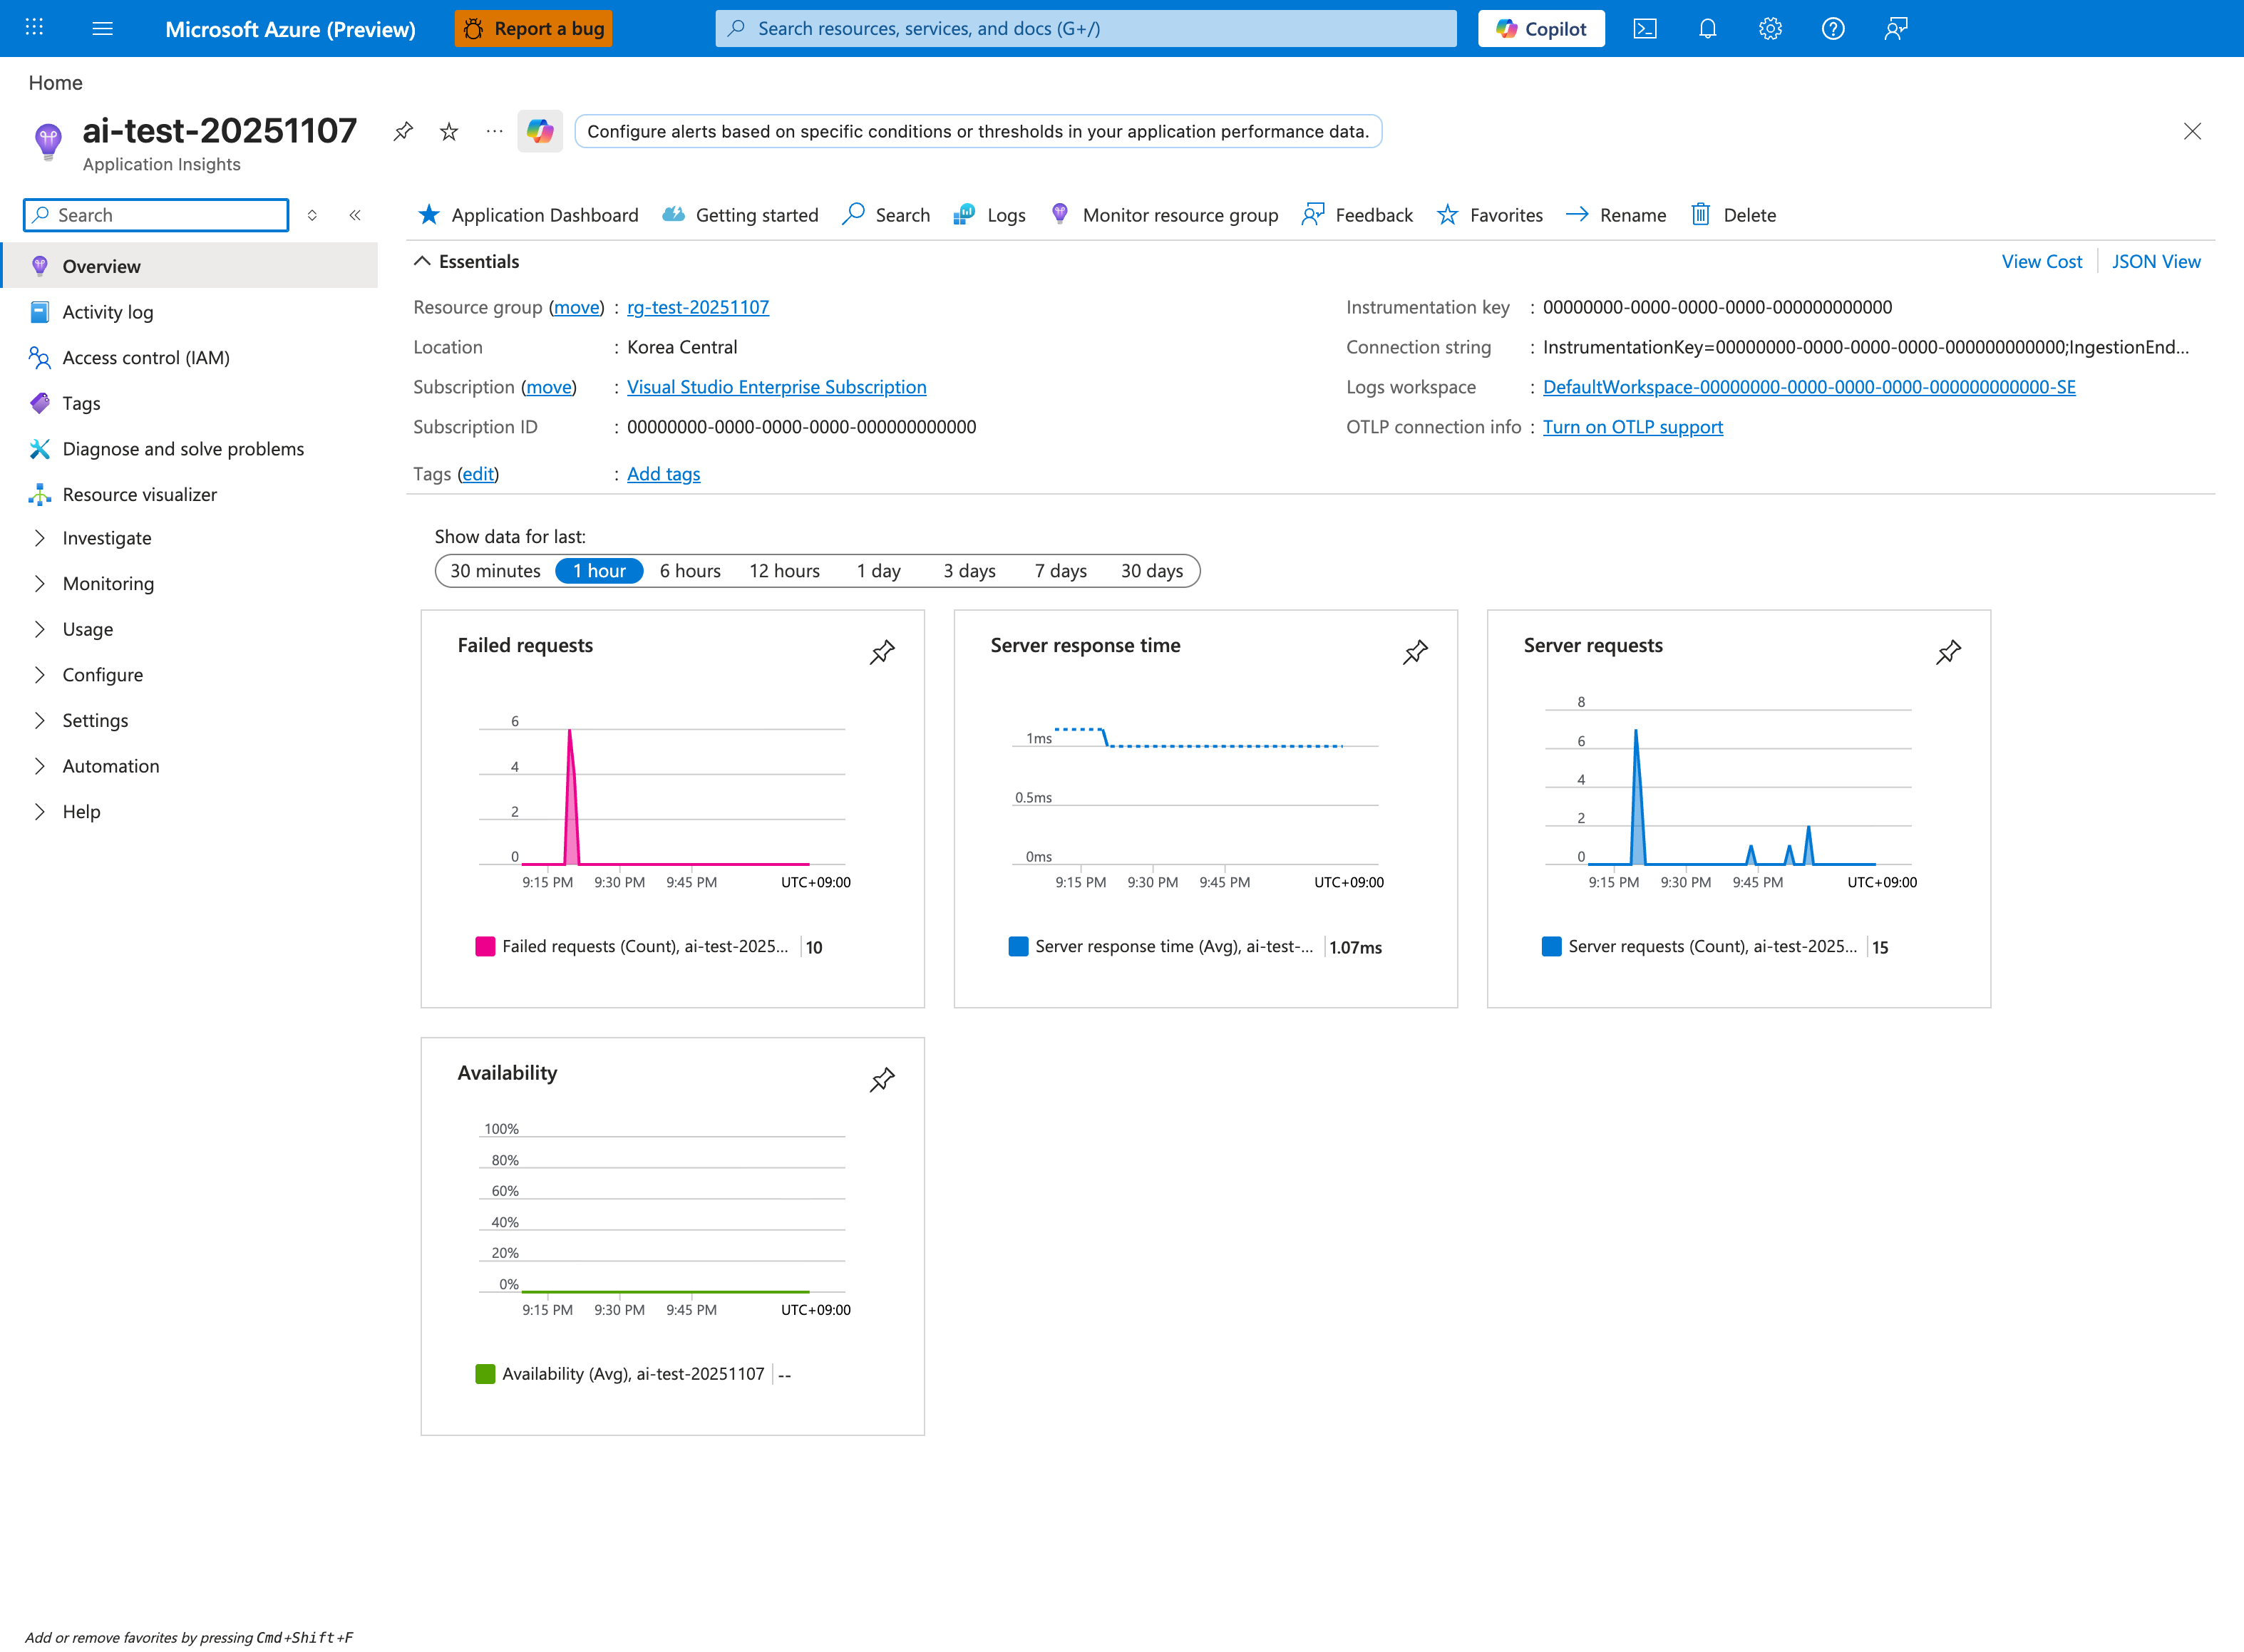
This Application Insights Overview blade is the Portal destination for the telemetry configured in this tutorial. The Connection string shown in Essentials corresponds to the APPLICATIONINSIGHTS_CONNECTION_STRING setting that the Spring Boot Application Insights agent reads at startup. The four pinned tiles — Failed requests, Server response time, Server requests, and Availability — give a quick summary of what the app is emitting at the request and reliability level. Use the Logs button in the top toolbar to open the KQL surface, which is where the tutorial's AppTraces, AppRequests, and AppDependencies query steps run.