04. Logging & Monitoring
Instrument ASP.NET Core 8 on Azure App Service with ILogger and Application Insights, then query operational signals using KQL.
Infrastructure Context
Service: App Service (Windows, Standard S1) | Network: VNet integrated | VNet: ✅
This tutorial assumes a production-ready App Service deployment with VNet integration, private endpoints for backend services, and managed identity for authentication.
flowchart TD
    INET[Internet] -->|HTTPS| WA["Web App\nApp Service S1\nWindows .NET 8"]

    subgraph VNET["VNet 10.0.0.0/16"]
        subgraph INT_SUB["Integration Subnet 10.0.1.0/24\nDelegation: Microsoft.Web/serverFarms"]
            WA
        end
        subgraph PE_SUB["Private Endpoint Subnet 10.0.2.0/24"]
            PE_KV[PE: Key Vault]
            PE_SQL[PE: Azure SQL]
            PE_ST[PE: Storage]
        end
    end

    PE_KV --> KV[Key Vault]
    PE_SQL --> SQL[Azure SQL]
    PE_ST --> ST[Storage Account]

    subgraph DNS[Private DNS Zones]
        DNS_KV[privatelink.vaultcore.azure.net]
        DNS_SQL[privatelink.database.windows.net]
        DNS_ST[privatelink.blob.core.windows.net]
    end

    PE_KV -.-> DNS_KV
    PE_SQL -.-> DNS_SQL
    PE_ST -.-> DNS_ST

    WA -.->|System-Assigned MI| ENTRA[Microsoft Entra ID]
    WA --> AI[Application Insights]

    style WA fill:#0078d4,color:#fff
    style VNET fill:#E8F5E9,stroke:#4CAF50
    style DNS fill:#E3F2FD
flowchart TD
A[App request] --> B[ILogger structured logs]
B --> C[Application Insights ingestion]
C --> D[Log Analytics workspace]
D --> E[Run KQL diagnostics]
E --> F[Operational decisions]Prerequisites
- Tutorial 03. Configuration completed
- Application Insights resource connected to your web app
- Log Analytics workspace configured (recommended)
What you'll learn
- Structured logging with
ILogger<T> - Application Insights SDK behavior in ASP.NET Core
- Request/dependency auto-collection and custom telemetry
- KQL queries for production diagnostics
Main content
1) Confirm SDK registration
The reference app already includes telemetry wiring:
| Command/Code | Purpose |
|---|---|
builder.Services.AddApplicationInsightsTelemetry(); | Registers Application Insights telemetry collection for the ASP.NET Core app. |
builder.Services.AddControllers(); | Adds controller support to the dependency injection container. |
Package reference in project:
| Command/Code | Purpose |
|---|---|
<PackageReference Include="Microsoft.ApplicationInsights.AspNetCore" Version="2.22.0" /> | Adds the ASP.NET Core Application Insights SDK package to the project. |
2) Add structured request logging
[ApiController]
[Route("api/requests")]
public sealed class RequestLogController : ControllerBase
{
    private readonly ILogger<RequestLogController> _logger;
    public RequestLogController(ILogger<RequestLogController> logger) => _logger = logger;

    [HttpGet("sample")]
    public IActionResult Sample([FromQuery] string userId = "anonymous")
    {
        _logger.LogInformation("Sample request received for {UserId}", userId);
        return Ok(new { status = "ok", userId, timestamp = DateTime.UtcNow });
    }
}
| Command/Code | Purpose |
|---|---|
[Route("api/requests")] | Maps the controller under the /api/requests route prefix. |
private readonly ILogger<RequestLogController> _logger; | Injects a typed logger for structured application logs. |
_logger.LogInformation("Sample request received for {UserId}", userId); | Writes a structured informational log entry that includes the user ID. |
return Ok(new { status = "ok", userId, timestamp = DateTime.UtcNow }); | Returns a response that confirms the sample request was handled. |
3) Enable/verify App Service diagnostics logs
az webapp log config \
  --resource-group "$RESOURCE_GROUP_NAME" \
  --name "$WEB_APP_NAME" \
  --application-logging filesystem \
  --level information \
  --web-server-logging filesystem \
  --output json
| Command/Code | Purpose |
|---|---|
az webapp log config --resource-group "$RESOURCE_GROUP_NAME" --name "$WEB_APP_NAME" --application-logging filesystem --level information --web-server-logging filesystem --output json | Enables application and web server filesystem logging for the web app. |
Stream logs live:
| Command/Code | Purpose |
|---|---|
az webapp log tail --resource-group "$RESOURCE_GROUP_NAME" --name "$WEB_APP_NAME" | Streams live App Service logs to the terminal. |
4) Understand automatic collection
With Application Insights SDK in ASP.NET Core, these are collected automatically:
- Incoming HTTP requests
- Outgoing dependencies (
HttpClient, SQL calls in supported providers) - Exceptions (unhandled + tracked)
- Performance counters and basic host telemetry
When to add custom telemetry
Use TelemetryClient for business events or domain-specific metrics. Keep event cardinality low to avoid noisy, expensive telemetry.
Query location matters
Table names differ by where you run the query. See KQL Queries Reference — Table Naming for details.
- Application Insights → Logs:
traces,requests,dependencies - Log Analytics Workspace → Logs:
AppTraces,AppRequests,AppDependencies
5) Add custom event and metric
using Microsoft.ApplicationInsights;

public sealed class BusinessTelemetryService
{
    private readonly TelemetryClient _telemetryClient;
    public BusinessTelemetryService(TelemetryClient telemetryClient) => _telemetryClient = telemetryClient;

    public void TrackCheckout(string region, decimal amount)
    {
        _telemetryClient.TrackEvent("CheckoutCompleted", new() { ["region"] = region });
        _telemetryClient.TrackMetric("CheckoutAmount", (double)amount);
    }
}
| Command/Code | Purpose |
|---|---|
using Microsoft.ApplicationInsights; | Imports the TelemetryClient API used for custom telemetry. |
private readonly TelemetryClient _telemetryClient; | Stores the Application Insights client for reuse in the service. |
_telemetryClient.TrackEvent("CheckoutCompleted", new() { ["region"] = region }); | Sends a custom business event with region metadata. |
_telemetryClient.TrackMetric("CheckoutAmount", (double)amount); | Records a numeric metric for checkout amount. |
6) KQL for .NET app operations
Recent failed requests:
requests
| where timestamp > ago(30m)
| where success == false
| project timestamp, name, resultCode, operation_Id, cloud_RoleName
| order by timestamp desc
Dependency latency hot spots:
dependencies
| where timestamp > ago(1h)
| summarize p95=percentile(duration, 95ms), avg=avg(duration), count() by target, type
| order by p95 desc
Correlate exception with request operation:
exceptions
| where timestamp > ago(1h)
| join kind=leftouter requests on operation_Id
| project timestamp, outerMessage, requestName=name, resultCode, operation_Id
| order by timestamp desc
7) Azure DevOps release quality gate example
- task: AzureCLI@2
  displayName: Query recent failed requests
  inputs:
    azureSubscription: $(azureSubscription)
    scriptType: bash
    scriptLocation: inlineScript
    inlineScript: |
      az monitor app-insights query \
        --app $(appInsightsName) \
        --resource-group $(resourceGroupName) \
        --analytics-query "requests | where timestamp > ago(10m) | where success == false | count" \
        --output table
Verification
| Command/Code | Purpose |
|---|---|
curl --silent "https://$WEB_APP_NAME.azurewebsites.net/api/requests/sample?userId=ops-check" | Triggers a request that should generate request telemetry and log entries. |
Then confirm:
- Request appears in Application Insights
requeststable. - Log message appears in App Service log stream.
- Operation correlation is present across request/dependency/exception telemetry.
Troubleshooting
No telemetry arriving
- Check
APPLICATIONINSIGHTS_CONNECTION_STRINGin App Settings - Ensure outbound access to Azure Monitor endpoints is not blocked
- Restart app after changing telemetry connection settings
Logs too noisy
Adjust log levels:
az webapp config appsettings set \
  --resource-group "$RESOURCE_GROUP_NAME" \
  --name "$WEB_APP_NAME" \
  --settings Logging__LogLevel__Default=Warning Logging__LogLevel__Microsoft.AspNetCore=Warning
| Command/Code | Purpose |
|---|---|
az webapp config appsettings set --resource-group "$RESOURCE_GROUP_NAME" --name "$WEB_APP_NAME" --settings Logging__LogLevel__Default=Warning Logging__LogLevel__Microsoft.AspNetCore=Warning | Raises log level thresholds to reduce noisy application logging. |
Missing dependency telemetry
Confirm you are using instrumented libraries and avoid suppressing DiagnosticSource activity in custom middleware.
Run It in the Portal
Portal view: Application Insights Overview blade (telemetry destination for this tutorial)
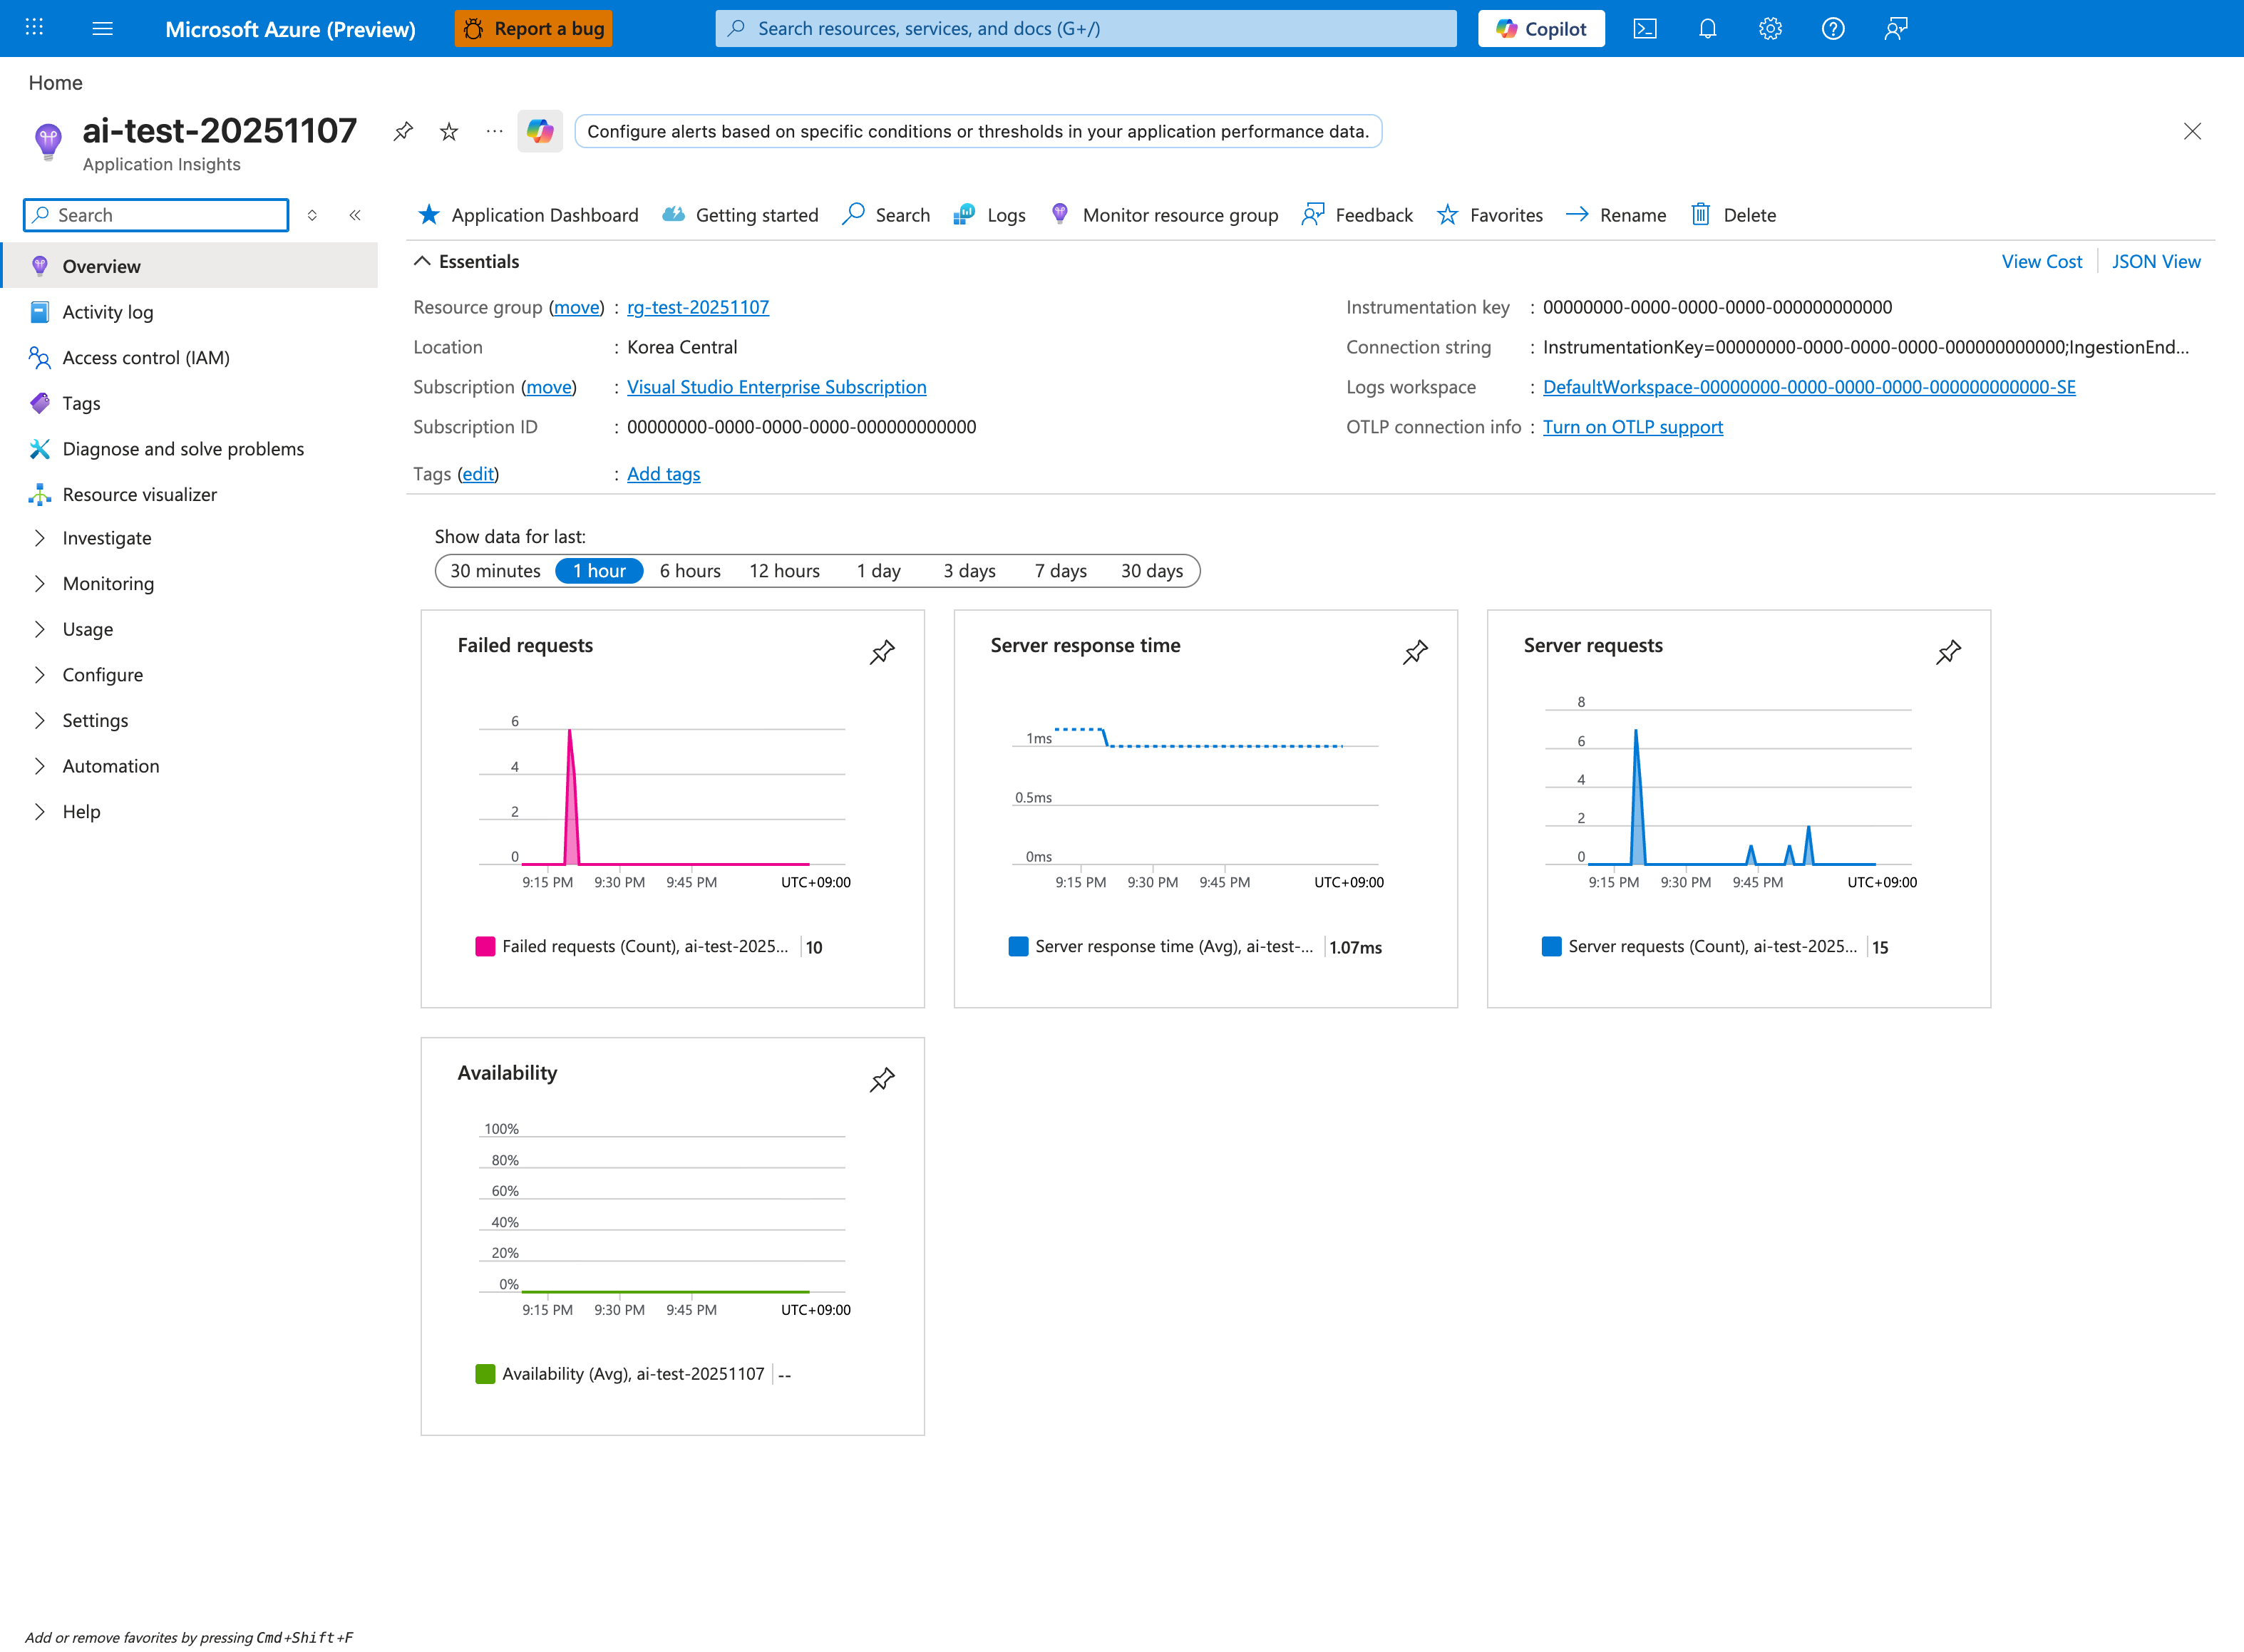
This Application Insights Overview blade is the Portal destination for the telemetry configured in this ASP.NET Core tutorial. The visible Server requests, Failed requests, and Server response time tiles give a quick requests/latency snapshot, and the Connection string and Logs entry are both shown in the Overview surface. Use the Logs button in the top toolbar to open the KQL surface for the query steps in the End-to-End Debugging Scenario section above.
See Also
- 05. Infrastructure as Code
- Reference: KQL Queries
- For platform details, see Azure App Service Guide